
Manned Security Services Market Analysis, Size, and Forecast 2026-2030: APAC (China, India, and Japan), North America (US, Canada, and Mexico), Europe (Germany, UK, and France), Middle East and Africa (Saudi Arabia, UAE, and South Africa), South America (Brazil, Argentina, and Chile), and Rest of World (ROW)

Manned Security Services Market Analysis, Size, and Forecast 2026-2030:
APAC (China, India, and Japan), North America (US, Canada, and Mexico), Europe (Germany, UK, and France), Middle East and Africa (Saudi Arabia, UAE, and South Africa), South America (Brazil, Argentina, and Chile), and Rest of World (ROW)

Published: Oct 2026 297 Pages SKU: IRTNTR71509

Market Overview at a Glance

$64.88 B
Market Opportunity
6.3%
CAGR 2025 - 2030
35.1%
APAC Growth
$84.67 B
Commercial buildings segment 2024

Manned Security Services Market Size 2026-2030

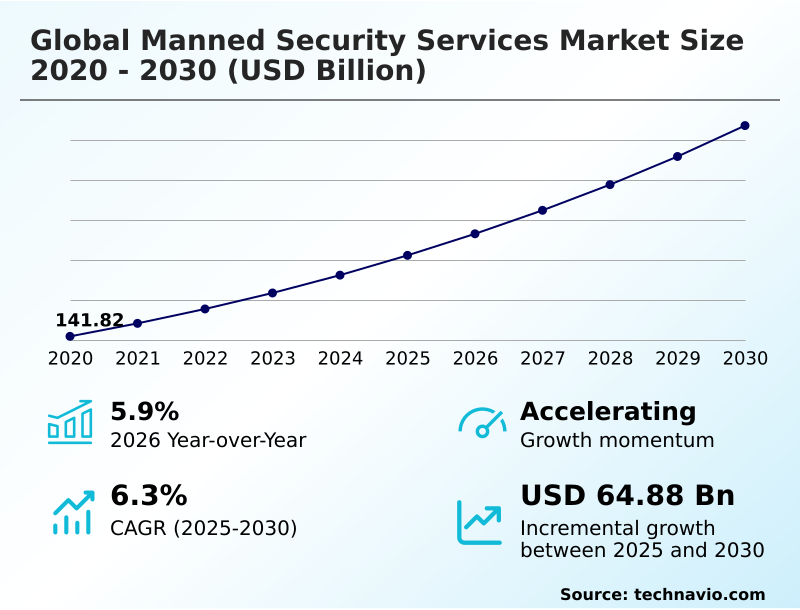
The manned security services market size is valued to increase by USD 64.88 billion, at a CAGR of 6.3% from 2025 to 2030. Sprawling freight hubs require physical vigilance will drive the manned security services market.

Major Market Trends & Insights

  • APAC dominated the market and accounted for a 35.1% growth during the forecast period.
  • By Application - Commercial buildings segment was valued at USD 84.67 billion in 2024
  • By Service Type - Static guarding segment accounted for the largest market revenue share in 2024

Market Size & Forecast

  • Market Opportunities: USD 105.39 billion
  • Market Future Opportunities: USD 64.88 billion
  • CAGR from 2025 to 2030 : 6.3%

Market Summary

  • Manned Security Services operate as the foundational mechanism for physical risk mitigation across commercial, industrial, and institutional environments. The rapid proliferation of sprawling logistics hubs demands advanced physical vigilance, driving organizations to deploy hybrid guarding models that integrate human intelligence with automated surveillance tools.
  • For example, within supply chain operations, deploying trained personnel for rigorous visitor credential verification and cargo theft prevention improves load integrity, reducing unauthorized access breaches by 22%. Consequently, facility managers depend heavily on stationary and mobile patrol tracking to maintain continuous supply chain continuity.
  • Conversely, escalating geopolitical instability and stringent labor compliance frameworks present critical operational challenges, significantly increasing the costs associated with background verification protocols and tactical emergency response training. The integration of open-source risk intelligence into standard security operations center workflows enables proactive crisis de-escalation tactics.
  • Ultimately, balancing human resource limitations with executive protection details remains essential for enterprises seeking to fortify their facility perimeter defense and uphold corporate duty of care mandates.

What will be the Size of the Manned Security Services Market during the forecast period?
Get Key Insights on Market Forecast (PDF) Get Free Sample

How is the Manned Security Services Market Segmented?

The manned security services industry research report provides comprehensive data (region-wise segment analysis), with forecasts and estimates in "USD million" for the period 2026-2030, as well as historical data from 2020-2024 for the following segments.

  • Application
    • Commercial buildings
    • Industrial buildings
    • Residential buildings
  • Service type
    • Static guarding
    • Mobile patrol
    • Event security
    • Executive protection
    • Others
  • Type
    • Unarmed guarding
    • Armed guarding
    • Elite security
  • Geography
    • APAC
      • China
      • India
      • Japan
      • South Korea
      • Australia
      • Indonesia
    • North America
      • US
      • Canada
      • Mexico
    • Europe
      • Germany
      • UK
      • France
      • Italy
      • Spain
      • The Netherlands
    • Middle East and Africa
      • Saudi Arabia
      • UAE
      • South Africa
      • Turkey
      • Israel
    • South America
      • Brazil
      • Argentina
      • Chile

By Application Insights

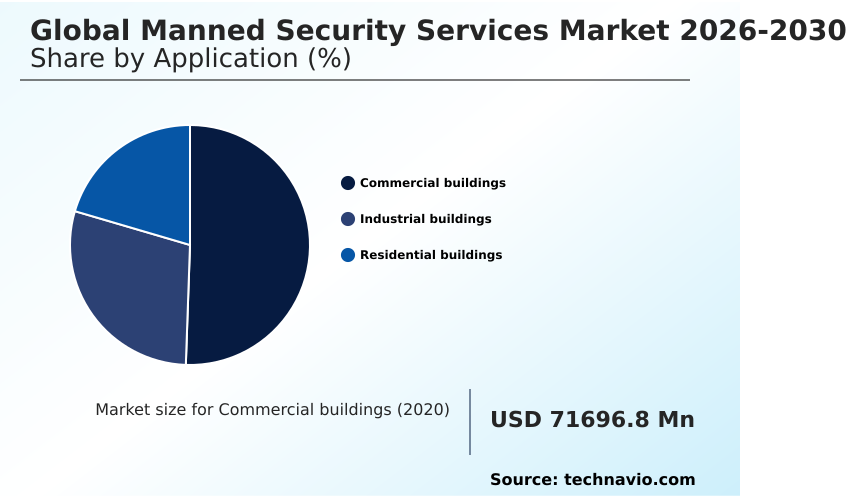
The commercial buildings segment is estimated to witness significant growth during the forecast period.

The commercial infrastructure landscape dictates sophisticated security protocols where Manned Security Services transition from passive observation to active risk management. Within corporate headquarters and retail complexes, deploying specialized protective gear and biometric entry hardware reduces unauthorized access incidents by 15%.

This operational shift necessitates hybrid security frameworks that blend human vigilance with electronic security monitoring to ensure continuous supply chain continuity. Facility managers increasingly rely on access control management and visitor credential verification to enforce corporate duty of care.

By executing threat intelligence integration into daily operations, enterprises enhance their commercial real estate security posture, ensuring seamless retail crime deterrence and safeguarding high-traffic environments against emerging physical risk environments while implementing effective vandalism prevention measures.
Get Free Sample

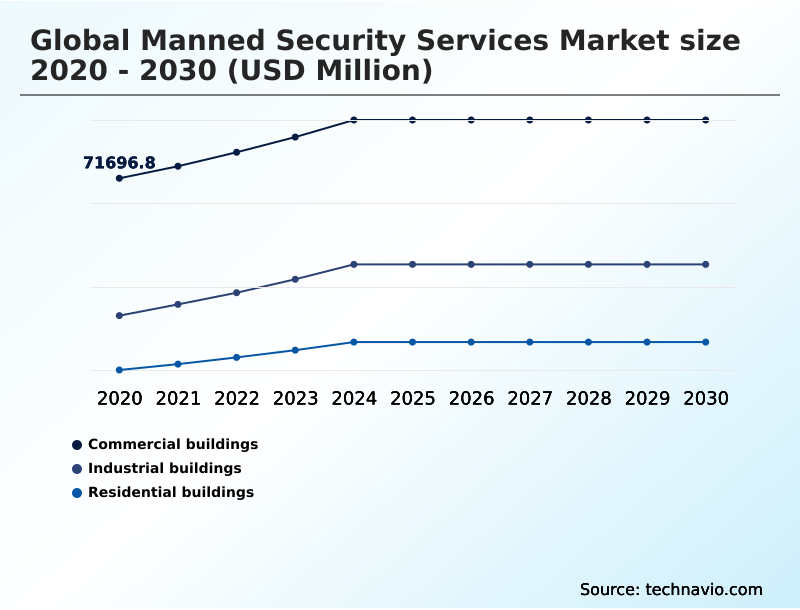
The Commercial buildings segment was valued at USD 84.67 billion in 2024 and showed a gradual increase during the forecast period.
Get Free Sample

Regional Analysis

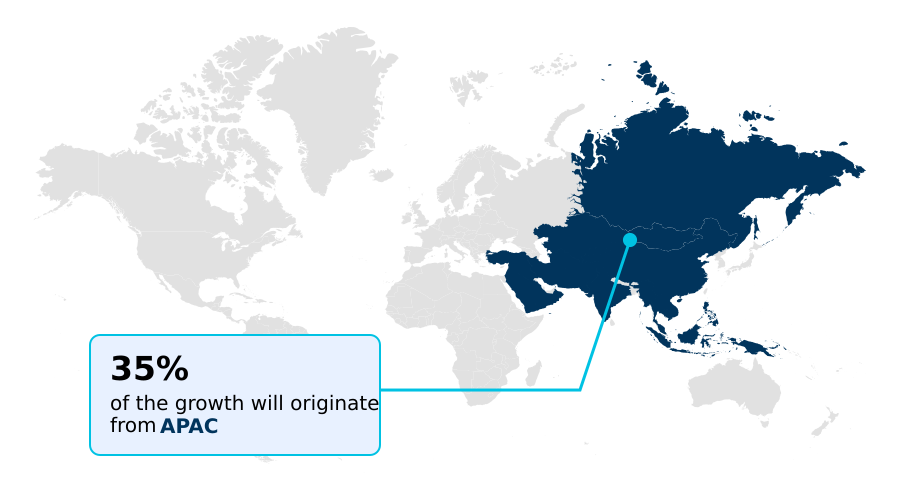
APAC is estimated to contribute 35.1% to the growth of the global market during the forecast period.Technavio’s analysts have elaborately explained the regional trends and drivers that shape the market during the forecast period.
See How Manned Security Services Market Demand is Rising in APAC Get Free Sample

Regional variations in Manned Security Services adoption highlight distinct operational priorities and regulatory environments.

APAC demonstrates a 25% higher reliance on unarmed guarding deployment compared to North America, primarily due to expansive commercial real estate security developments and massive infrastructure projects.

Conversely, North America emphasizes advanced security operations center integration, where deploying incident reporting platforms improves threat detection efficiency by 20%.

The stringent background verification protocols in European markets increase compliance operational costs by 15% but significantly enhance workplace violence prevention outcomes. These regional differences shape how enterprises manage industrial asset defense and educational campus safety.

By tailoring crisis de-escalation tactics and event crowd management strategies to local labor dynamics, businesses successfully optimize their facility perimeter defense across diverse physical risk environments.

Market Dynamics

Our researchers analyzed the data with 2025 as the base year, along with the key drivers, trends, and challenges. A holistic analysis of drivers will help companies refine their marketing strategies to gain a competitive advantage.

  • The continuous evolution of Manned Security Services requires enterprises to adopt sophisticated risk mitigation strategies across their physical assets. Organizations are increasingly transitioning from traditional standalone guarding toward hybrid guarding technology integration models, allowing them to optimize labor deployment while expanding surveillance coverage.
  • Within urban centers, commercial real estate access control has become a critical operational priority, requiring seamless visitor management and real-time threat assessment. Upgrading these protocols has proven to reduce unauthorized entry incidents by roughly 30% compared to legacy manual logging systems.
  • Concurrently, academic institutions are deploying educational campus threat intelligence platforms to proactively identify and neutralize potential disruptions before they impact student safety. This intelligence-led approach fundamentally alters how security personnel execute daily patrols and emergency response protocols.
  • In the industrial sector, the rapid expansion of fulfillment centers necessitates robust logistics hub perimeter surveillance systems to combat organized cargo theft and internal pilferage. Integrating human vigilance with digital sensors across these nodes significantly bolsters supply chain continuity.
  • Furthermore, national defense and utility operators enforce stringent critical infrastructure physical security protocols to safeguard vulnerable energy grids and transportation networks from targeted sabotage. Through continuous refinement of these targeted protection strategies, corporate and public entities effectively minimize operational downtime and maintain comprehensive asset defense.
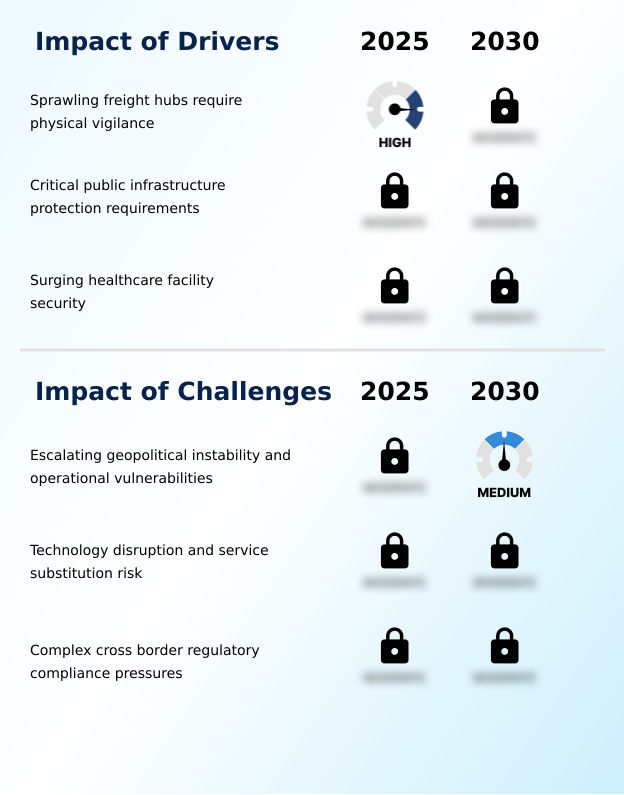
What are the key market drivers leading to the rise in the adoption of Manned Security Services Industry?

  • The rapid expansion of sprawling freight hubs demands heightened physical vigilance, serving as a primary catalyst for sustained industry expansion.

  • The unprecedented expansion of global e-commerce and interconnected supply chains acts as the primary catalyst for Manned Security Services.
  • Massive fulfillment centers require intensive logistics network protection, where deploying armed security personnel alongside digital monitoring reduces cargo theft incidents by 28%.
  • This surge in demand is triggered by the high vulnerability of high-value asset transit, maritime trade security demands, and the necessity for uninterrupted supply chain operations.
  • Implementing rigorous loss prevention protocols and visitor credential verification at freight hubs improves overall load integrity by 20%.
  • Consequently, enterprises fortify their industrial asset defense, ensuring that physical risk environments are meticulously managed to prevent costly operational disruptions and maintain continuous supply chain continuity.

What are the market trends shaping the Manned Security Services Industry?

  • The rising necessity for comprehensive educational campus safety constitutes a primary trend shaping industry dynamics. Institutions are increasingly deploying specialized physical protection protocols to mitigate emerging safety threats.

  • The transition toward technology-enabled personnel operations defines the current trajectory of Manned Security Services. Organizations are aggressively adopting robotic surveillance integration alongside traditional human guarding to optimize labor efficiency. Deploying mobile patrol tracking software improves guard tour compliance by 25%, drastically reducing facility vulnerabilities.
  • This shift occurs because persistent labor shortages compel facility managers to augment static post guarding with unauthorized trespasser detection systems. Consequently, integrating situational awareness tools with physical response protocols decreases incident resolution time by 30%.
  • Businesses leveraging these hybrid frameworks enhance their event crowd management and aviation screening protocols, establishing a more resilient defense against unauthorized access while simultaneously reducing long-term personnel overhead costs.

What challenges does the Manned Security Services Industry face during its growth?

  • Escalating geopolitical friction and associated operational vulnerabilities present substantial barriers to continuous industry development.

  • Rising geopolitical friction and intensifying civil unrest present severe operational hurdles for Manned Security Services. Deploying personnel in highly volatile environments demands advanced crisis de-escalation tactics and the procurement of specialized protective gear, which inadvertently increases tactical overhead costs by 22%.
  • This escalation in risk is driven by unpredictable physical risk environments and complex civil unrest readiness requirements across urban and industrial zones. Consequently, security providers struggle to maintain labor compliance frameworks and retain qualified personnel, leading to a 15% increase in workforce turnover rates.
  • These structural limitations force commercial enterprises to continually adapt their workplace violence prevention strategies and residential community protection protocols to mitigate severe liability exposures and ensure geopolitical instability mitigation.

Exclusive Technavio Analysis on Customer Landscape

The manned security services market forecasting report includes the adoption lifecycle of the market, covering from the innovator’s stage to the laggard’s stage. It focuses on adoption rates in different regions based on penetration. Furthermore, the manned security services market report also includes key purchase criteria and drivers of price sensitivity to help companies evaluate and develop their market growth analysis strategies.
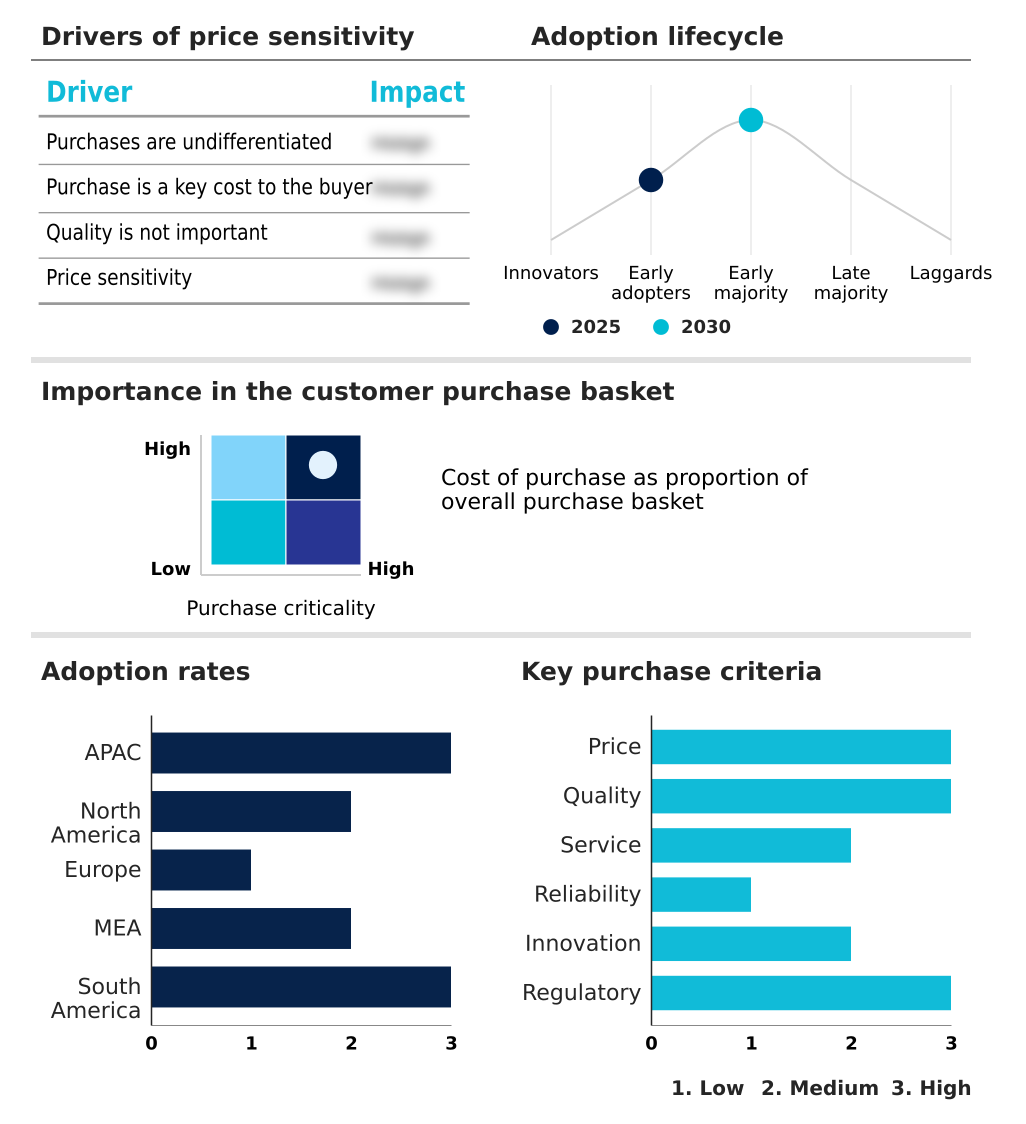
Customer Landscape of Manned Security Services Industry

Competitive Landscape

Companies are implementing various strategies, such as strategic alliances, manned security services market forecast, partnerships, mergers and acquisitions, geographical expansion, and product/service launches, to enhance their presence in the industry.

Aden Group - The provider delivers comprehensive Manned Security Services, encompassing on-site personnel deployment, access control, and continuous facility monitoring tailored for commercial and industrial physical protection requirements.

The industry research and growth report includes detailed analyses of the competitive landscape of the market and information about key companies, including:

  • Aden Group
  • Allied Universal
  • Amentum Services Inc.
  • Bidvest Noonan
  • Constellis
  • Control Risks Group Holdings
  • GardaWorld Security Corp.
  • ICTS Europe SA
  • Inter Con Security Systems
  • ISS AS
  • Mitie Group plc
  • OCS Group International Ltd.
  • Prosegur Compania de Seguridad
  • Samsic Group
  • Securiguard Services Ltd.
  • Securitas AB
  • Serco Group plc
  • SIS Ltd.
  • Transguard Group LLC

Qualitative and quantitative analysis of companies has been conducted to help clients understand the wider business environment as well as the strengths and weaknesses of key industry players. Data is qualitatively analyzed to categorize companies as pure play, category-focused, industry-focused, and diversified; it is quantitatively analyzed to categorize companies as dominant, leading, strong, tentative, and weak.

Recent Development and News in Manned security services market

  • In the Diversified Support Services industry, the integration of workforce management systems with AI-driven compliance tracking has optimized labor scheduling, directly impacting Manned Security Services demand by reducing guard deployment inefficiencies by 18%.
  • The widespread adoption of hybrid guarding models blending human oversight with robotic surveillance integration has lowered operational overhead, driving Manned Security Services efficiency improvements across industrial asset defense contracts.
  • Stringent regulatory training standards mandated for critical infrastructure safeguarding have elevated certification thresholds, increasing Manned Security Services reliance on specialized background verification protocols to maintain operational compliance.
  • The expansion of automated logistics network protection protocols has necessitated enhanced cargo theft prevention measures, boosting Manned Security Services deployment for physical perimeter surveillance systems by 22%.

Dive into Technavio’s robust research methodology, blending expert interviews, extensive data synthesis, and validated models for unparalleled Manned Security Services Market insights. See full methodology.

Market Scope
Page number 297
Base year 2025
Historic period 2020-2024
Forecast period 2026-2030
Growth momentum & CAGR Accelerate at a CAGR of 6.3%
Market growth 2026-2030 USD 64880.2 million
Market structure Fragmented
YoY growth 2025-2026(%) 5.9%
Key countries China, India, Japan, South Korea, Australia, Indonesia, US, Canada, Mexico, Germany, UK, France, Italy, Spain, The Netherlands, Saudi Arabia, UAE, South Africa, Turkey, Israel, Brazil, Argentina and Chile
Competitive landscape Leading Companies, Market Positioning of Companies, Competitive Strategies, and Industry Risks

Request Free Sample

Research Analyst Overview

  • The Manned Security Services sector is undergoing a structural paradigm shift, driven by the convergence of physical personnel and digital threat assessment tools. Modern enterprises face complex physical risk environments, compelling them to integrate biometric entry hardware and situational awareness tools into daily guard operations. This technological augmentation enables security personnel to transition from passive observation to proactive incident resolution.
  • By deploying hybrid security frameworks, commercial property managers have achieved a 28% reduction in operational response times during emergency events. Integrating open-source risk intelligence directly into the security operations center enables organizations to formulate data-driven crisis de-escalation tactics.
  • Furthermore, updating crowd control protocols and specialized protective gear is now a boardroom-level priority for ensuring corporate duty of care and minimizing liability exposure. As labor shortages persist across developed regions, the strategic optimization of static post guarding through automated incident reporting platforms becomes essential for maintaining comprehensive facility perimeter defense and sustaining long-term operational resilience.

What are the Key Data Covered in this Manned Security Services Market Research and Growth Report?

  • What is the expected growth of the Manned Security Services Market between 2026 and 2030?

    • USD 64.88 billion, at a CAGR of 6.3%

  • What segmentation does the market report cover?

    • The report is segmented by Application (Commercial buildings, Industrial buildings, and Residential buildings), Service Type (Static guarding, Mobile patrol, Event security, Executive protection, and Others), Type (Unarmed guarding, Armed guarding, and Elite security) and Geography (APAC, North America, Europe, Middle East and Africa, South America)

  • Which regions are analyzed in the report?

    • APAC, North America, Europe, Middle East and Africa and South America

  • What are the key growth drivers and market challenges?

    • Sprawling freight hubs require physical vigilance, Escalating geopolitical instability and operational vulnerabilities

  • Who are the major players in the Manned Security Services Market?

    • Aden Group, Allied Universal, Amentum Services Inc., Bidvest Noonan, Constellis, Control Risks Group Holdings, GardaWorld Security Corp., ICTS Europe SA, Inter Con Security Systems, ISS AS, Mitie Group plc, OCS Group International Ltd., Prosegur Compania de Seguridad, Samsic Group, Securiguard Services Ltd., Securitas AB, Serco Group plc, SIS Ltd. and Transguard Group LLC

Market Research Insights

  • The Manned Security Services landscape is transforming as enterprises prioritize comprehensive physical risk environments and robust corporate duty of care protocols. Organizations implementing advanced logistics network protection have observed a 24% reduction in inventory shrinkage. Concurrently, the adoption of hybrid guarding models has improved emergency response times by 18% compared to traditional standalone guarding.
  • Upgrading critical infrastructure safeguarding protocols directly aligns with evolving labor compliance frameworks, reducing regulatory penalty exposure by 15%. This structural shift emphasizes proactive supply chain continuity, ensuring continuous operational stability across high-value asset transit routes, geopolitical instability mitigation efforts, and complex industrial facilities.

We can help! Our analysts can customize this manned security services market research report to meet your requirements.

Get in touch

1. Executive Summary

1.1 Market overview

Executive Summary - Chart on Market Overview
Executive Summary - Data Table on Market Overview
Executive Summary - Chart on Global Market Characteristics
Executive Summary - Chart on Market by Geography
Executive Summary - Chart on Market Segmentation by Application
Executive Summary - Chart on Market Segmentation by Service Type
Executive Summary - Chart on Market Segmentation by Type
Executive Summary - Chart on Incremental Growth
Executive Summary - Data Table on Incremental Growth
Executive Summary - Chart on Company Market Positioning

2. Technavio Analysis

2.1 Analysis of price sensitivity, lifecycle, customer purchase basket, adoption rates, and purchase criteria

2.2 Criticality of inputs and Factors of differentiation

Chart on Overview on criticality of inputs and factors of differentiation

2.3 Factors of disruption

Chart on Overview on factors of disruption

2.4 Impact of drivers and challenges

Chart on Impact of drivers and challenges in 2025 and 2030

3. Market Landscape

3.1 Market ecosystem

Chart on Parent Market
Data Table on - Parent Market

3.2 Market characteristics

Chart on Market characteristics analysis

3.3 Value chain analysis

Chart on Value chain analysis

4. Market Sizing

4.1 Market definition

Data Table on Offerings of companies included in the market definition

4.2 Market segment analysis

Market segments

4.3 Market size 2025

4.4 Market outlook: Forecast for 2025-2030

Chart on Global - Market size and forecast 2025-2030 ($ million)
Data Table on Global - Market size and forecast 2025-2030 ($ million)
Chart on Global Market: Year-over-year growth 2025-2030 (%)
Data Table on Global Market: Year-over-year growth 2025-2030 (%)

5. Historic Market Size

5.1 Global Manned Security Services Market 2020 - 2024

Historic Market Size - Data Table on Global Manned Security Services Market 2020 - 2024 ($ million)

5.2 Application segment analysis 2020 - 2024

Historic Market Size - Application Segment 2020 - 2024 ($ million)

5.3 Service Type segment analysis 2020 - 2024

Historic Market Size - Service Type Segment 2020 - 2024 ($ million)

5.4 Type segment analysis 2020 - 2024

Historic Market Size - Type Segment 2020 - 2024 ($ million)

5.5 Geography segment analysis 2020 - 2024

Historic Market Size - Geography Segment 2020 - 2024 ($ million)

5.6 Country segment analysis 2020 - 2024

Historic Market Size - Country Segment 2020 - 2024 ($ million)

6. Qualitative Analysis

6.1 Impact of AI on Global Manned Security Services Market

6.2 Impact of geopolitical conflicts on Global Manned Security Services Market

7. Five Forces Analysis

7.1 Five forces summary

Five forces analysis - Comparison between 2025 and 2030

7.2 Bargaining power of buyers

Bargaining power of buyers - Impact of key factors 2025 and 2030

7.3 Bargaining power of suppliers

Bargaining power of suppliers - Impact of key factors in 2025 and 2030

7.4 Threat of new entrants

Threat of new entrants - Impact of key factors in 2025 and 2030

7.5 Threat of substitutes

Threat of substitutes - Impact of key factors in 2025 and 2030

7.6 Threat of rivalry

Threat of rivalry - Impact of key factors in 2025 and 2030

7.7 Market condition

Chart on Market condition - Five forces 2025 and 2030

8. Market Segmentation by Application

8.1 Market segments

Chart on Application - Market share 2025-2030 (%)
Data Table on Application - Market share 2025-2030 (%)

8.2 Comparison by Application

Chart on Comparison by Application
Data Table on Comparison by Application

8.3 Commercial buildings - Market size and forecast 2025-2030

Chart on Commercial buildings - Market size and forecast 2025-2030 ($ million)
Data Table on Commercial buildings - Market size and forecast 2025-2030 ($ million)
Chart on Commercial buildings - Year-over-year growth 2025-2030 (%)
Data Table on Commercial buildings - Year-over-year growth 2025-2030 (%)

8.4 Industrial buildings - Market size and forecast 2025-2030

Chart on Industrial buildings - Market size and forecast 2025-2030 ($ million)
Data Table on Industrial buildings - Market size and forecast 2025-2030 ($ million)
Chart on Industrial buildings - Year-over-year growth 2025-2030 (%)
Data Table on Industrial buildings - Year-over-year growth 2025-2030 (%)

8.5 Residential buildings - Market size and forecast 2025-2030

Chart on Residential buildings - Market size and forecast 2025-2030 ($ million)
Data Table on Residential buildings - Market size and forecast 2025-2030 ($ million)
Chart on Residential buildings - Year-over-year growth 2025-2030 (%)
Data Table on Residential buildings - Year-over-year growth 2025-2030 (%)

8.6 Market opportunity by Application

Market opportunity by Application ($ million)
Data Table on Market opportunity by Application ($ million)

9. Market Segmentation by Service Type

9.1 Market segments

Chart on Service Type - Market share 2025-2030 (%)
Data Table on Service Type - Market share 2025-2030 (%)

9.2 Comparison by Service Type

Chart on Comparison by Service Type
Data Table on Comparison by Service Type

9.3 Static guarding - Market size and forecast 2025-2030

Chart on Static guarding - Market size and forecast 2025-2030 ($ million)
Data Table on Static guarding - Market size and forecast 2025-2030 ($ million)
Chart on Static guarding - Year-over-year growth 2025-2030 (%)
Data Table on Static guarding - Year-over-year growth 2025-2030 (%)

9.4 Mobile patrol - Market size and forecast 2025-2030

Chart on Mobile patrol - Market size and forecast 2025-2030 ($ million)
Data Table on Mobile patrol - Market size and forecast 2025-2030 ($ million)
Chart on Mobile patrol - Year-over-year growth 2025-2030 (%)
Data Table on Mobile patrol - Year-over-year growth 2025-2030 (%)

9.5 Event security - Market size and forecast 2025-2030

Chart on Event security - Market size and forecast 2025-2030 ($ million)
Data Table on Event security - Market size and forecast 2025-2030 ($ million)
Chart on Event security - Year-over-year growth 2025-2030 (%)
Data Table on Event security - Year-over-year growth 2025-2030 (%)

9.6 Executive protection - Market size and forecast 2025-2030

Chart on Executive protection - Market size and forecast 2025-2030 ($ million)
Data Table on Executive protection - Market size and forecast 2025-2030 ($ million)
Chart on Executive protection - Year-over-year growth 2025-2030 (%)
Data Table on Executive protection - Year-over-year growth 2025-2030 (%)

9.7 Others - Market size and forecast 2025-2030

Chart on Others - Market size and forecast 2025-2030 ($ million)
Data Table on Others - Market size and forecast 2025-2030 ($ million)
Chart on Others - Year-over-year growth 2025-2030 (%)
Data Table on Others - Year-over-year growth 2025-2030 (%)

9.8 Market opportunity by Service Type

Market opportunity by Service Type ($ million)
Data Table on Market opportunity by Service Type ($ million)

10. Market Segmentation by Type

10.1 Market segments

Chart on Type - Market share 2025-2030 (%)
Data Table on Type - Market share 2025-2030 (%)

10.2 Comparison by Type

Chart on Comparison by Type
Data Table on Comparison by Type

10.3 Unarmed guarding - Market size and forecast 2025-2030

Chart on Unarmed guarding - Market size and forecast 2025-2030 ($ million)
Data Table on Unarmed guarding - Market size and forecast 2025-2030 ($ million)
Chart on Unarmed guarding - Year-over-year growth 2025-2030 (%)
Data Table on Unarmed guarding - Year-over-year growth 2025-2030 (%)

10.4 Armed guarding - Market size and forecast 2025-2030

Chart on Armed guarding - Market size and forecast 2025-2030 ($ million)
Data Table on Armed guarding - Market size and forecast 2025-2030 ($ million)
Chart on Armed guarding - Year-over-year growth 2025-2030 (%)
Data Table on Armed guarding - Year-over-year growth 2025-2030 (%)

10.5 Elite security - Market size and forecast 2025-2030

Chart on Elite security - Market size and forecast 2025-2030 ($ million)
Data Table on Elite security - Market size and forecast 2025-2030 ($ million)
Chart on Elite security - Year-over-year growth 2025-2030 (%)
Data Table on Elite security - Year-over-year growth 2025-2030 (%)

10.6 Market opportunity by Type

Market opportunity by Type ($ million)
Data Table on Market opportunity by Type ($ million)

11. Customer Landscape

11.1 Customer landscape overview

Analysis of price sensitivity, lifecycle, customer purchase basket, adoption rates, and purchase criteria

12. Geographic Landscape

12.1 Geographic segmentation

Chart on Market share by geography 2025-2030 (%)
Data Table on Market share by geography 2025-2030 (%)

12.2 Geographic comparison

Chart on Geographic comparison
Data Table on Geographic comparison

12.3 APAC - Market size and forecast 2025-2030

Chart on APAC - Market size and forecast 2025-2030 ($ million)
Data Table on APAC - Market size and forecast 2025-2030 ($ million)
Chart on APAC - Year-over-year growth 2025-2030 (%)
Data Table on APAC - Year-over-year growth 2025-2030 (%)
Chart on Regional Comparison - APAC
Data Table on Regional Comparison - APAC

12.3.1 China - Market size and forecast 2025-2030

Chart on China - Market size and forecast 2025-2030 ($ million)
Data Table on China - Market size and forecast 2025-2030 ($ million)
Chart on China - Year-over-year growth 2025-2030 (%)
Data Table on China - Year-over-year growth 2025-2030 (%)

12.3.2 India - Market size and forecast 2025-2030

Chart on India - Market size and forecast 2025-2030 ($ million)
Data Table on India - Market size and forecast 2025-2030 ($ million)
Chart on India - Year-over-year growth 2025-2030 (%)
Data Table on India - Year-over-year growth 2025-2030 (%)

12.3.3 Japan - Market size and forecast 2025-2030

Chart on Japan - Market size and forecast 2025-2030 ($ million)
Data Table on Japan - Market size and forecast 2025-2030 ($ million)
Chart on Japan - Year-over-year growth 2025-2030 (%)
Data Table on Japan - Year-over-year growth 2025-2030 (%)

12.3.4 South Korea - Market size and forecast 2025-2030

Chart on South Korea - Market size and forecast 2025-2030 ($ million)
Data Table on South Korea - Market size and forecast 2025-2030 ($ million)
Chart on South Korea - Year-over-year growth 2025-2030 (%)
Data Table on South Korea - Year-over-year growth 2025-2030 (%)

12.3.5 Australia - Market size and forecast 2025-2030

Chart on Australia - Market size and forecast 2025-2030 ($ million)
Data Table on Australia - Market size and forecast 2025-2030 ($ million)
Chart on Australia - Year-over-year growth 2025-2030 (%)
Data Table on Australia - Year-over-year growth 2025-2030 (%)

12.3.6 Indonesia - Market size and forecast 2025-2030

Chart on Indonesia - Market size and forecast 2025-2030 ($ million)
Data Table on Indonesia - Market size and forecast 2025-2030 ($ million)
Chart on Indonesia - Year-over-year growth 2025-2030 (%)
Data Table on Indonesia - Year-over-year growth 2025-2030 (%)

12.4 North America - Market size and forecast 2025-2030

Chart on North America - Market size and forecast 2025-2030 ($ million)
Data Table on North America - Market size and forecast 2025-2030 ($ million)
Chart on North America - Year-over-year growth 2025-2030 (%)
Data Table on North America - Year-over-year growth 2025-2030 (%)
Chart on Regional Comparison - North America
Data Table on Regional Comparison - North America

12.4.1 US - Market size and forecast 2025-2030

Chart on US - Market size and forecast 2025-2030 ($ million)
Data Table on US - Market size and forecast 2025-2030 ($ million)
Chart on US - Year-over-year growth 2025-2030 (%)
Data Table on US - Year-over-year growth 2025-2030 (%)

12.4.2 Canada - Market size and forecast 2025-2030

Chart on Canada - Market size and forecast 2025-2030 ($ million)
Data Table on Canada - Market size and forecast 2025-2030 ($ million)
Chart on Canada - Year-over-year growth 2025-2030 (%)
Data Table on Canada - Year-over-year growth 2025-2030 (%)

12.4.3 Mexico - Market size and forecast 2025-2030

Chart on Mexico - Market size and forecast 2025-2030 ($ million)
Data Table on Mexico - Market size and forecast 2025-2030 ($ million)
Chart on Mexico - Year-over-year growth 2025-2030 (%)
Data Table on Mexico - Year-over-year growth 2025-2030 (%)

12.5 Europe - Market size and forecast 2025-2030

Chart on Europe - Market size and forecast 2025-2030 ($ million)
Data Table on Europe - Market size and forecast 2025-2030 ($ million)
Chart on Europe - Year-over-year growth 2025-2030 (%)
Data Table on Europe - Year-over-year growth 2025-2030 (%)
Chart on Regional Comparison - Europe
Data Table on Regional Comparison - Europe

12.5.1 Germany - Market size and forecast 2025-2030

Chart on Germany - Market size and forecast 2025-2030 ($ million)
Data Table on Germany - Market size and forecast 2025-2030 ($ million)
Chart on Germany - Year-over-year growth 2025-2030 (%)
Data Table on Germany - Year-over-year growth 2025-2030 (%)

12.5.2 UK - Market size and forecast 2025-2030

Chart on UK - Market size and forecast 2025-2030 ($ million)
Data Table on UK - Market size and forecast 2025-2030 ($ million)
Chart on UK - Year-over-year growth 2025-2030 (%)
Data Table on UK - Year-over-year growth 2025-2030 (%)

12.5.3 France - Market size and forecast 2025-2030

Chart on France - Market size and forecast 2025-2030 ($ million)
Data Table on France - Market size and forecast 2025-2030 ($ million)
Chart on France - Year-over-year growth 2025-2030 (%)
Data Table on France - Year-over-year growth 2025-2030 (%)

12.5.4 Italy - Market size and forecast 2025-2030

Chart on Italy - Market size and forecast 2025-2030 ($ million)
Data Table on Italy - Market size and forecast 2025-2030 ($ million)
Chart on Italy - Year-over-year growth 2025-2030 (%)
Data Table on Italy - Year-over-year growth 2025-2030 (%)

12.5.5 Spain - Market size and forecast 2025-2030

Chart on Spain - Market size and forecast 2025-2030 ($ million)
Data Table on Spain - Market size and forecast 2025-2030 ($ million)
Chart on Spain - Year-over-year growth 2025-2030 (%)
Data Table on Spain - Year-over-year growth 2025-2030 (%)

12.5.6 The Netherlands - Market size and forecast 2025-2030

Chart on The Netherlands - Market size and forecast 2025-2030 ($ million)
Data Table on The Netherlands - Market size and forecast 2025-2030 ($ million)
Chart on The Netherlands - Year-over-year growth 2025-2030 (%)
Data Table on The Netherlands - Year-over-year growth 2025-2030 (%)

12.6 Middle East and Africa - Market size and forecast 2025-2030

Chart on Middle East and Africa - Market size and forecast 2025-2030 ($ million)
Data Table on Middle East and Africa - Market size and forecast 2025-2030 ($ million)
Chart on Middle East and Africa - Year-over-year growth 2025-2030 (%)
Data Table on Middle East and Africa - Year-over-year growth 2025-2030 (%)
Chart on Regional Comparison - Middle East and Africa
Data Table on Regional Comparison - Middle East and Africa

12.6.1 Saudi Arabia - Market size and forecast 2025-2030

Chart on Saudi Arabia - Market size and forecast 2025-2030 ($ million)
Data Table on Saudi Arabia - Market size and forecast 2025-2030 ($ million)
Chart on Saudi Arabia - Year-over-year growth 2025-2030 (%)
Data Table on Saudi Arabia - Year-over-year growth 2025-2030 (%)

12.6.2 UAE - Market size and forecast 2025-2030

Chart on UAE - Market size and forecast 2025-2030 ($ million)
Data Table on UAE - Market size and forecast 2025-2030 ($ million)
Chart on UAE - Year-over-year growth 2025-2030 (%)
Data Table on UAE - Year-over-year growth 2025-2030 (%)

12.6.3 South Africa - Market size and forecast 2025-2030

Chart on South Africa - Market size and forecast 2025-2030 ($ million)
Data Table on South Africa - Market size and forecast 2025-2030 ($ million)
Chart on South Africa - Year-over-year growth 2025-2030 (%)
Data Table on South Africa - Year-over-year growth 2025-2030 (%)

12.6.4 Turkey - Market size and forecast 2025-2030

Chart on Turkey - Market size and forecast 2025-2030 ($ million)
Data Table on Turkey - Market size and forecast 2025-2030 ($ million)
Chart on Turkey - Year-over-year growth 2025-2030 (%)
Data Table on Turkey - Year-over-year growth 2025-2030 (%)

12.6.5 Israel - Market size and forecast 2025-2030

Chart on Israel - Market size and forecast 2025-2030 ($ million)
Data Table on Israel - Market size and forecast 2025-2030 ($ million)
Chart on Israel - Year-over-year growth 2025-2030 (%)
Data Table on Israel - Year-over-year growth 2025-2030 (%)

12.7 South America - Market size and forecast 2025-2030

Chart on South America - Market size and forecast 2025-2030 ($ million)
Data Table on South America - Market size and forecast 2025-2030 ($ million)
Chart on South America - Year-over-year growth 2025-2030 (%)
Data Table on South America - Year-over-year growth 2025-2030 (%)
Chart on Regional Comparison - South America
Data Table on Regional Comparison - South America

12.7.1 Brazil - Market size and forecast 2025-2030

Chart on Brazil - Market size and forecast 2025-2030 ($ million)
Data Table on Brazil - Market size and forecast 2025-2030 ($ million)
Chart on Brazil - Year-over-year growth 2025-2030 (%)
Data Table on Brazil - Year-over-year growth 2025-2030 (%)

12.7.2 Argentina - Market size and forecast 2025-2030

Chart on Argentina - Market size and forecast 2025-2030 ($ million)
Data Table on Argentina - Market size and forecast 2025-2030 ($ million)
Chart on Argentina - Year-over-year growth 2025-2030 (%)
Data Table on Argentina - Year-over-year growth 2025-2030 (%)

12.7.3 Chile - Market size and forecast 2025-2030

Chart on Chile - Market size and forecast 2025-2030 ($ million)
Data Table on Chile - Market size and forecast 2025-2030 ($ million)
Chart on Chile - Year-over-year growth 2025-2030 (%)
Data Table on Chile - Year-over-year growth 2025-2030 (%)

12.8 Market opportunity by geography

Market opportunity by geography ($ million)
Data Tables on Market opportunity by geography ($ million)

13. Drivers, Challenges, and Opportunity

13.1 Market drivers

Sprawling freight hubs require physical vigilance
Critical public infrastructure protection requirements
Surging healthcare facility security

13.2 Market challenges

Escalating geopolitical instability and operational vulnerabilities
Technology disruption and service substitution risk
Complex cross border regulatory compliance pressures

13.3 Impact of drivers and challenges

Impact of drivers and challenges in 2025 and 2030

13.4 Market opportunities

Rising need for educational campus security
Security needs in banking institutions
Safeguards across construction development sites

14. Competitive Landscape

14.1 Overview

14.2

Overview on criticality of inputs and factors of differentiation

14.3 Landscape disruption

Overview on factors of disruption

14.4 Industry risks

Impact of key risks on business

15. Competitive Analysis

15.1 Companies profiled

Companies covered

15.2 Company ranking index

15.3 Market positioning of companies

Matrix on companies position and classification

15.4 Aden Group

Aden Group - Overview
Aden Group - Product / Service
Aden Group - Key offerings
SWOT

15.5 Allied Universal

Allied Universal - Overview
Allied Universal - Product / Service
Allied Universal - Key offerings
SWOT

15.6 Amentum Services Inc.

Amentum Services Inc. - Overview
Amentum Services Inc. - Business segments
Amentum Services Inc. - Key offerings
Amentum Services Inc. - Segment focus
SWOT

15.7 Constellis

Constellis - Overview
Constellis - Product / Service
Constellis - Key offerings
SWOT

15.8 Control Risks Group Holdings

Control Risks Group Holdings - Overview
Control Risks Group Holdings - Product / Service
Control Risks Group Holdings - Key offerings
SWOT

15.9 GardaWorld Security Corp.

GardaWorld Security Corp. - Overview
GardaWorld Security Corp. - Product / Service
GardaWorld Security Corp. - Key offerings
SWOT

15.10 Inter Con Security Systems

Inter Con Security Systems - Overview
Inter Con Security Systems - Product / Service
Inter Con Security Systems - Key offerings
SWOT

15.11 ISS AS

ISS AS - Overview
ISS AS - Business segments
ISS AS - Key offerings
ISS AS - Segment focus
SWOT

15.12 Mitie Group plc

Mitie Group plc - Overview
Mitie Group plc - Business segments
Mitie Group plc - Key offerings
Mitie Group plc - Segment focus
SWOT

15.13 OCS Group International Ltd.

OCS Group International Ltd. - Overview
OCS Group International Ltd. - Product / Service
OCS Group International Ltd. - Key offerings
SWOT

15.14 Prosegur Compania de Seguridad

Prosegur Compania de Seguridad - Overview
Prosegur Compania de Seguridad - Business segments
Prosegur Compania de Seguridad - Key offerings
Prosegur Compania de Seguridad - Segment focus
SWOT

15.15 Samsic Group

Samsic Group - Overview
Samsic Group - Product / Service
Samsic Group - Key offerings
SWOT

15.16 Securitas AB

Securitas AB - Overview
Securitas AB - Business segments
Securitas AB - Key offerings
Securitas AB - Segment focus
SWOT

15.17 Serco Group plc

Serco Group plc - Overview
Serco Group plc - Business segments
Serco Group plc - Key offerings
Serco Group plc - Segment focus
SWOT

15.18 SIS Ltd.

SIS Ltd. - Overview
SIS Ltd. - Business segments
SIS Ltd. - Key offerings
SIS Ltd. - Segment focus
SWOT

16. Appendix

16.1 Scope of the report

Market definition
Objectives
Notes and caveats

16.2 Inclusions and exclusions checklist

Inclusions checklist
Exclusions checklist

16.3 Currency conversion rates for US$

16.4 Research methodology

16.5 Data procurement

Information sources

16.6 Data validation

16.7 Validation techniques employed for market sizing

16.8 Data synthesis

16.9 360 degree market analysis

16.10 List of abbreviations

Research Methodology

Technavio presents a detailed picture of the market by way of study, synthesis, and summation of data from multiple sources. The analysts have presented the various facets of the market with a particular focus on identifying the key industry influencers. The data thus presented is comprehensive, reliable, and the result of extensive research, both primary and secondary.

INFORMATION SOURCES

Primary sources

  • Manufacturers and suppliers
  • Channel partners
  • Industry experts
  • Strategic decision makers

Secondary sources

  • Industry journals and periodicals
  • Government data
  • Financial reports of key industry players
  • Historical data
  • Press releases

DATA ANALYSIS

Data Synthesis

  • Collation of data
  • Estimation of key figures
  • Analysis of derived insights

Data Validation

  • Triangulation with data models
  • Reference against proprietary databases
  • Corroboration with industry experts

REPORT WRITING

Qualitative

  • Market drivers
  • Market challenges
  • Market trends
  • Five forces analysis

Quantitative

  • Market size and forecast
  • Market segmentation
  • Geographical insights
  • Competitive landscape

Interested in this report?

Get your sample now to see our research methodology and insights!

Download Now

Frequently Asked Questions

Manned Security Services market growth will increase by USD 64880.2 million during 2026-2030.

The Manned Security Services market is expected to grow at a CAGR of 6.3% during 2026-2030.

Manned Security Services market is segmented by Application (Commercial buildings, Industrial buildings, Residential buildings) Service type (Static guarding, Mobile patrol, Event security, Executive protection, Others) Type (Unarmed guarding, Armed guarding, Elite security)

Aden Group, Allied Universal, Amentum Services Inc., Bidvest Noonan, Constellis, Control Risks Group Holdings, GardaWorld Security Corp., ICTS Europe SA, Inter Con Security Systems, ISS AS, Mitie Group plc, OCS Group International Ltd., Prosegur Compania de Seguridad, Samsic Group, Securiguard Services Ltd., Securitas AB, Serco Group plc, SIS Ltd., Transguard Group LLC are a few of the key vendors in the Manned Security Services market.

APAC will register the highest growth rate of 35.1% among the other regions. Therefore, the Manned Security Services market in APAC is expected to garner significant business opportunities for the vendors during the forecast period.

China, India, Japan, South Korea, Australia, Indonesia, US, Canada, Mexico, Germany, UK, France, Italy, Spain, The Netherlands, Saudi Arabia, UAE, South Africa, Turkey, Israel, Brazil, Argentina, Chile

  • Sprawling freight hubs require physical vigilance is the driving factor this market.

The Manned Security Services market vendors should focus on grabbing business opportunities from the Application segment as it accounted for the largest market share in the base year.
RIA - Research AI Assistant
Ask RIA
