Private Security Services Market Analysis, Size, and Forecast 2026-2030: APAC (China, Japan, and India), North America (US, Canada, and Mexico), Europe (Germany, UK, and France), South America (Brazil, Argentina, and Colombia), Middle East and Africa (Saudi Arabia, UAE, and South Africa), and Rest of World (ROW)

Private Security Services Market Analysis, Size, and Forecast 2026-2030:
APAC (China, Japan, and India), North America (US, Canada, and Mexico), Europe (Germany, UK, and France), South America (Brazil, Argentina, and Colombia), Middle East and Africa (Saudi Arabia, UAE, and South Africa), and Rest of World (ROW)

Published: Mar 2026 307 Pages SKU: IRTNTR71582

Market Overview at a Glance

$280.39 B
Market Opportunity
11.8%
CAGR 2025 - 2030
43.1%
APAC Growth
$126.78 B
Industrial segment 2024

Private Security Services Market Size 2026-2030

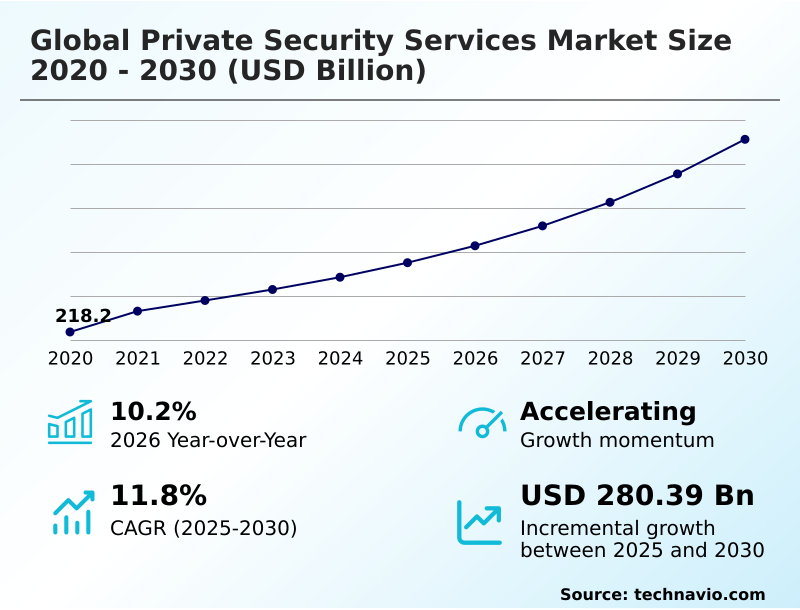
The private security services market size is valued to increase by USD 280.39 billion, at a CAGR of 11.8% from 2025 to 2030. Rapid urbanization and population growth will drive the private security services market.

Major Market Trends & Insights

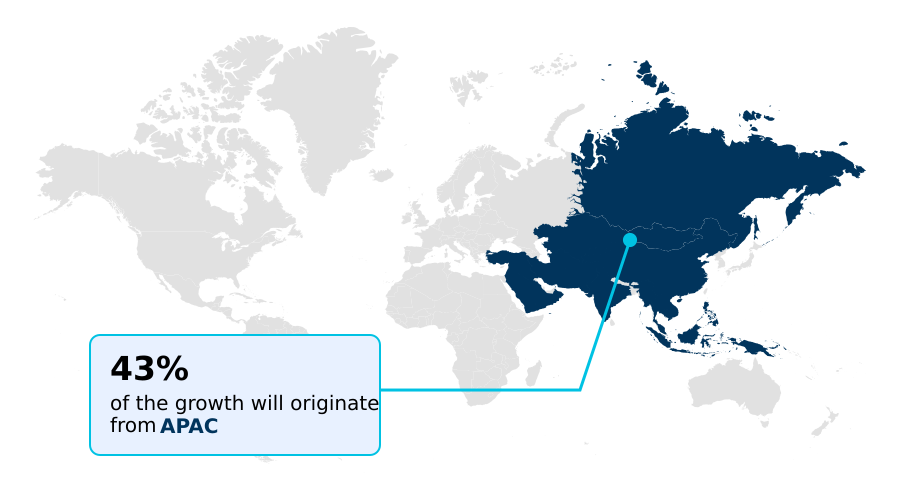
  • APAC dominated the market and accounted for a 43.1% growth during the forecast period.
  • By Application - Industrial segment was valued at USD 126.78 billion in 2024
  • By Service - Manned guarding segment accounted for the largest market revenue share in 2024

Market Size & Forecast

  • Market Opportunities: USD 437.89 billion
  • Market Future Opportunities: USD 280.39 billion
  • CAGR from 2025 to 2030 : 11.8%

Market Summary

  • The private security services market is undergoing a significant transformation, moving beyond traditional manned guarding to embrace a hybrid model of protection. This evolution integrates sophisticated technologies like access control systems and high-definition video surveillance to create comprehensive security ecosystems. For instance, a multinational corporation securing a new research campus illustrates this shift.
  • The company would implement biometric scanners for sensitive labs, ensuring only authorized personnel can enter, while an AI-driven remote monitoring platform analyzes feeds from across the facility to detect anomalies in real time. This integrated approach to corporate security management not only protects physical assets but also safeguards invaluable intellectual property.
  • The market is also expanding to address the needs of critical infrastructure protection and specialized event security management, where the combination of skilled personnel and advanced technology is essential for mitigating complex risks and ensuring public safety in high-stakes environments. This convergence of human expertise and technological innovation defines the industry's future direction.

What will be the Size of the Private Security Services Market during the forecast period?

Get Key Insights on Market Forecast (PDF) Request Free Sample

How is the Private Security Services Market Segmented?

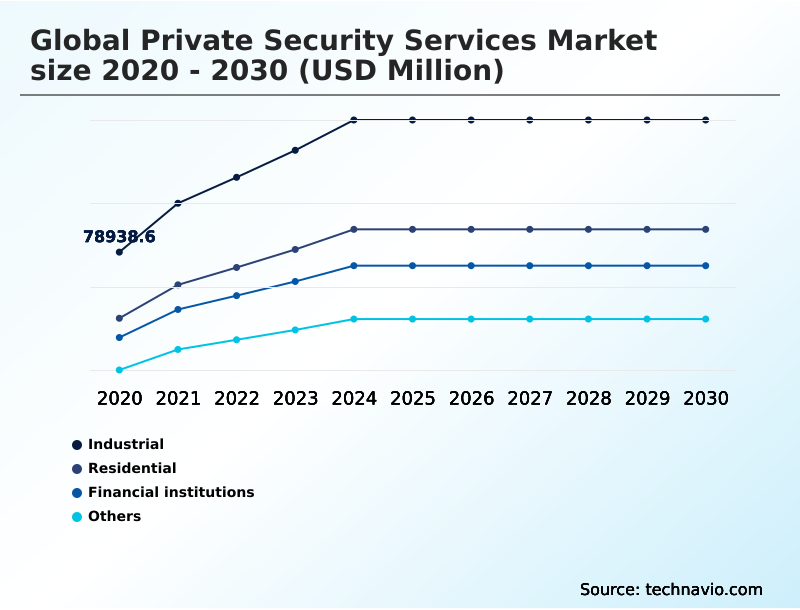
The private security services industry research report provides comprehensive data (region-wise segment analysis), with forecasts and estimates in "USD million" for the period 2026-2030, as well as historical data from 2020-2024 for the following segments.

  • Application
    • Industrial
    • Residential
    • Financial institutions
    • Others
  • Service
    • Manned guarding
    • Electronic security services
    • Cash services
  • End-user
    • BFSI
    • Manufacturing
    • Energy and utilities
    • Others
  • Geography
    • APAC
      • China
      • Japan
      • India
    • North America
      • US
      • Canada
      • Mexico
    • Europe
      • Germany
      • UK
      • France
    • South America
      • Brazil
      • Argentina
      • Colombia
    • Middle East and Africa
      • Saudi Arabia
      • UAE
      • South Africa
    • Rest of World (ROW)

By Application Insights

The industrial segment is estimated to witness significant growth during the forecast period.

The industrial segment focuses on protecting expansive sites where comprehensive risk assessment is paramount for operational continuity. Providers deploy integrated security solutions combining mobile patrols with advanced perimeter intrusion detection to safeguard against theft and unauthorized access.

The use of drone surveillance is increasingly vital for monitoring large outdoor areas, enhancing asset protection in sectors like manufacturing and logistics.

This tech-driven approach improves supply chain security, with firms reporting a 15% increase in compliance with workplace safety regulations.

Protecting intellectual property and sensitive equipment within data center physical security perimeters is also a critical application, demanding sophisticated and layered defense strategies to mitigate both internal and external threats, ensuring uninterrupted industrial operations.

Request Free Sample

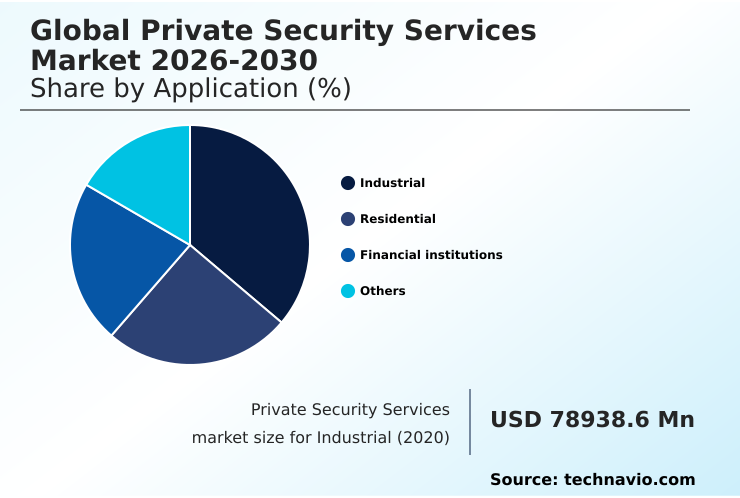
The Industrial segment was valued at USD 126.78 billion in 2024 and showed a gradual increase during the forecast period.

Request Free Sample

Regional Analysis

APAC is estimated to contribute 43.1% to the growth of the global market during the forecast period.Technavio’s analysts have elaborately explained the regional trends and drivers that shape the market during the forecast period.

See How Private Security Services Market Demand is Rising in APAC Request Free Sample

The global geographic landscape for private security services is diverse, with regional demands shaping service specializations. The APAC region is poised to contribute over 43% of the market's incremental growth, outpacing North America.

In high-risk regions, demand is strong for specialized services like armored car transport and executive protection. Mature markets are focused on technology integration for corporate security management and event security management.

This includes sophisticated remote monitoring of critical transportation hub security. In contrast, emerging markets often prioritize visible manned guarding to establish a primary security presence.

This regional differentiation underscores the need for adaptable service models that can cater to specific risk profiles, from basic asset protection to complex, technology-driven security operations.

Market Dynamics

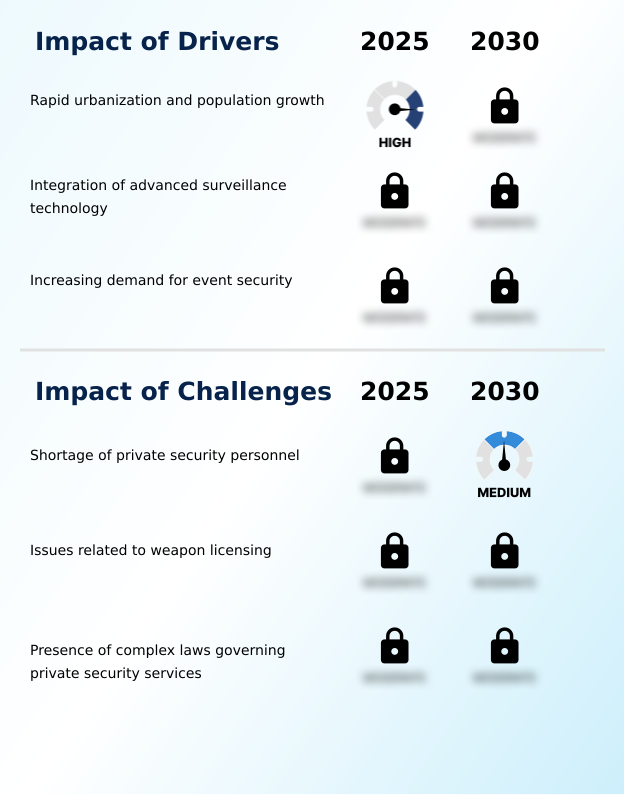
Our researchers analyzed the data with 2025 as the base year, along with the key drivers, trends, and challenges. A holistic analysis of drivers will help companies refine their marketing strategies to gain a competitive advantage.

  • Businesses evaluating their security needs must look beyond the base cost of private security services and consider the strategic benefits of manned guarding services versus technology-driven alternatives. The decision often involves choosing between integrated security for commercial buildings and standalone systems.
  • The role of AI in video surveillance systems is reshaping threat detection, while new trends in residential security solutions offer homeowners unprecedented control. Specialized services such as armored transport for cash handling and executive protection for high-risk individuals address specific, critical vulnerabilities. For public-facing operations, effective event security crowd control techniques are non-negotiable.
  • Furthermore, the convergence of cybersecurity in physical security is a critical consideration. When choosing a private security company, it is essential to review private security guard training requirements and their approach to workplace violence prevention strategies. Businesses with public-facing operations, such as retailers, must implement retail loss prevention best practices.
  • For industrial players, perimeter security for industrial facilities is a top priority, supported by a thorough risk assessment for corporate security. The adoption of security technology for smart cities, including drone surveillance in private security and advanced access control systems for data centers, highlights the industry's innovative turn. Community-focused mobile patrol services for neighborhoods offer a visible deterrent.
  • Ultimately, companies with robust emergency response planning for businesses recover operations nearly 50% faster than those without, underscoring the value of a comprehensive security strategy.

What are the key market drivers leading to the rise in the adoption of Private Security Services Industry?

  • Rapid urbanization and population growth are key drivers for the market, fueling demand for security services in expanding metropolitan areas.

  • Rapid urbanization and technological advancements are primary drivers fueling market growth. The increasing density of urban centers necessitates sophisticated crowd management and emergency evacuation plans, with technologies like facial recognition technology improving identity verification accuracy by up to 99%.
  • This drives demand for enhanced critical infrastructure protection. The need for specialized services in sectors such as educational campus safety and hospitality security services is also expanding. Businesses are prioritizing loss prevention strategies to mitigate financial impact.
  • Furthermore, growing global complexities have increased the demand for geopolitical risk advisory services, helping organizations navigate threats in volatile regions and ensure the safety of their personnel and assets.

What are the market trends shaping the Private Security Services Industry?

  • The increasing popularity of virtual security systems, which offer remote monitoring capabilities, is a significant upcoming trend. This shift provides a cost-effective alternative to traditional on-site guarding.

  • Key trends are reshaping the private security landscape, with a notable move toward proactive, technology-driven models. The adoption of virtual guarding services is accelerating, offering a scalable alternative to on-site personnel and reducing operational costs by up to 20%. This is complemented by a growing demand for advanced security consulting to develop robust crisis response planning.
  • Digital incident reporting platforms are also gaining traction, improving data accuracy by over 40% and enabling faster analysis. The convergence of cyber-physical security is becoming a central theme, protecting interconnected assets from multilayered threats.
  • In the residential sector, professionally managed residential security patrols are being enhanced with smart home security integration, while specialized services like the deployment of K9 units provide an additional layer of deterrence and detection.

What challenges does the Private Security Services Industry face during its growth?

  • A significant shortage of qualified private security personnel poses a key challenge to the industry's growth and operational capacity.

  • The market faces significant operational challenges, primarily a persistent shortage of skilled labor, with annual turnover rates exceeding 30% in some regions. This strain forces a greater reliance on technology, such as automated alarm monitoring and advanced video surveillance systems, to supplement human guards.
  • Another major hurdle is the complex and fragmented regulatory landscape, which can increase compliance costs by up to 20% for firms deploying retail security solutions or operating in high-risk environment security settings. These regulations impact the implementation of access control systems and biometric scanners, complicating threat detection protocols for financial institution security and overall asset protection strategies.

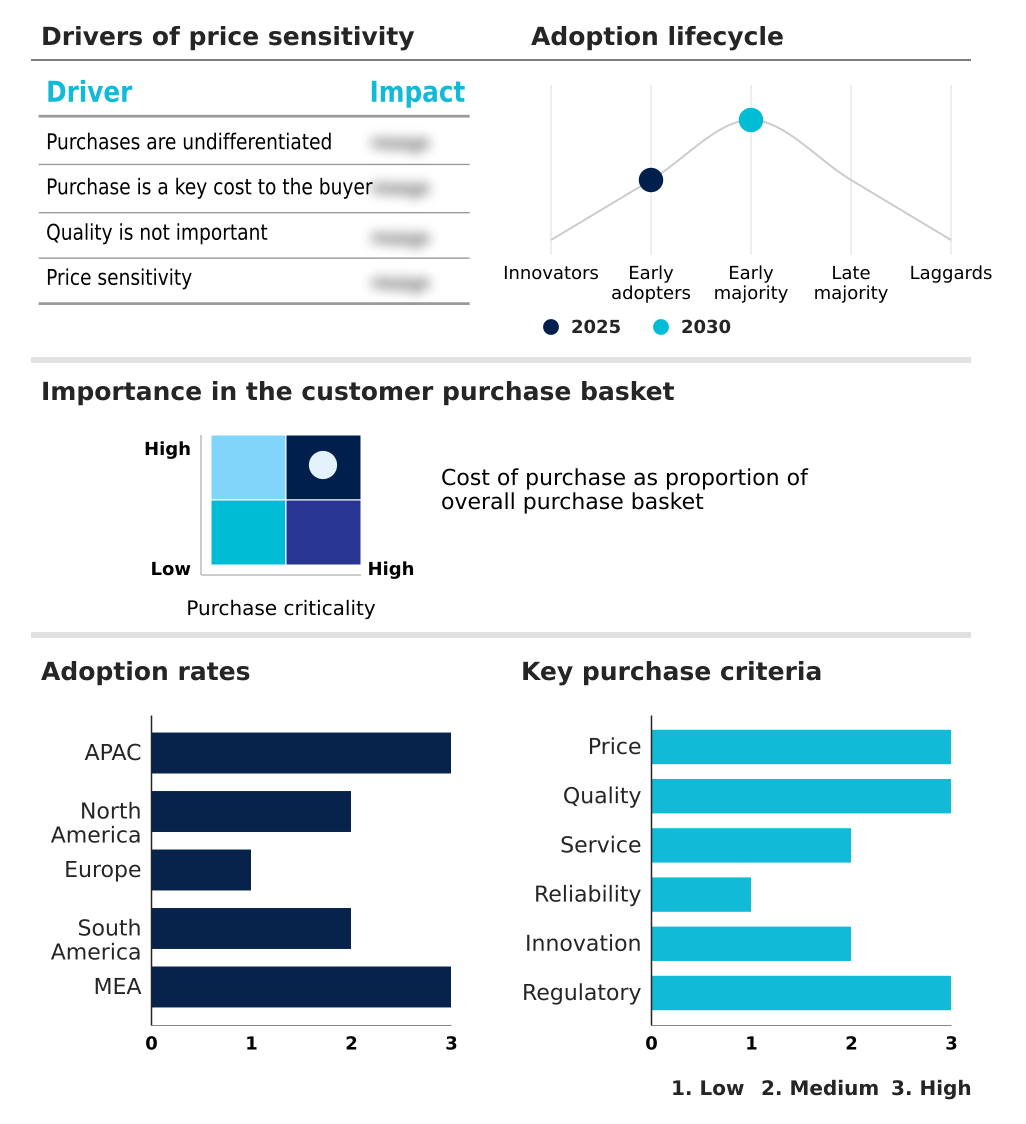
Exclusive Technavio Analysis on Customer Landscape

The private security services market forecasting report includes the adoption lifecycle of the market, covering from the innovator’s stage to the laggard’s stage. It focuses on adoption rates in different regions based on penetration. Furthermore, the private security services market report also includes key purchase criteria and drivers of price sensitivity to help companies evaluate and develop their market growth analysis strategies.

Customer Landscape of Private Security Services Industry

Competitive Landscape

Companies are implementing various strategies, such as strategic alliances, private security services market forecast, partnerships, mergers and acquisitions, geographical expansion, and product/service launches, to enhance their presence in the industry.

ADT Inc. - Provides comprehensive private security, including manned guarding, patrol services, and customized protection solutions that address diverse and complex safety requirements across industries.

The industry research and growth report includes detailed analyses of the competitive landscape of the market and information about key companies, including:

  • ADT Inc.
  • Allied Universal
  • Bidvest Group Ltd.
  • Constellis
  • Control Risks Group Holdings
  • GardaWorld Security Corp.
  • ICTS Europe SA
  • Inter Con Security Systems
  • ISS AS
  • Mitie Group plc
  • OCS Group International Ltd.
  • Prosegur Compania de Seguridad
  • Secom Co. Ltd.
  • Securitas AB
  • The Brinks Co.
  • Total Security Services Ltd.
  • Transguard Group LLC
  • Vector Security Inc.

Qualitative and quantitative analysis of companies has been conducted to help clients understand the wider business environment as well as the strengths and weaknesses of key industry players. Data is qualitatively analyzed to categorize companies as pure play, category-focused, industry-focused, and diversified; it is quantitatively analyzed to categorize companies as dominant, leading, strong, tentative, and weak.

Recent Development and News in Private security services market

  • In May, 2025, Securitas launched a major recruitment initiative in North America to address labor shortages, investing in enhanced training and retention programs to attract new talent to the security profession.
  • In March, 2025, Allied Universal announced its role in securing major entertainment venues, leveraging a combination of traditional patrolling and data analytics for advanced crowd and flow management.
  • In February, 2025, Honeywell Building Technologies reported a significant increase in demand for urban safety solutions, particularly in the APAC region, driven by the rapid growth of smart cities requiring interconnected security networks.
  • In January, 2025, Hikvision launched a new line of intelligent remote guarding platforms for the commercial sector, featuring cameras that trigger instant alerts and enable remote verbal warnings to intruders.

Dive into Technavio’s robust research methodology, blending expert interviews, extensive data synthesis, and validated models for unparalleled Private Security Services Market insights. See full methodology.

Market Scope
Page number 307
Base year 2025
Historic period 2020-2024
Forecast period 2026-2030
Growth momentum & CAGR Accelerate at a CAGR of 11.8%
Market growth 2026-2030 USD 280391.4 million
Market structure Fragmented
YoY growth 2025-2026(%) 10.2%
Key countries China, Japan, India, South Korea, Australia, Indonesia, US, Canada, Mexico, Germany, UK, France, Italy, Spain, The Netherlands, Brazil, Argentina, Colombia, Saudi Arabia, UAE, South Africa, Israel and Turkey
Competitive landscape Leading Companies, Market Positioning of Companies, Competitive Strategies, and Industry Risks

Request Free Sample

Research Analyst Overview

  • The private security services market is defined by an evolving integration of traditional manned guarding with advanced technologies. Core services like access control systems and video surveillance are now augmented by sophisticated biometric scanners and facial recognition technology to enhance asset protection.
  • This shift toward integrated security solutions is critical, with enterprises reporting up to a 30% reduction in incident response times post-implementation. The market addresses a wide spectrum of risks, from routine loss prevention to complex crisis response planning. Specialized offerings such as armored car transport, executive protection, and drone surveillance cater to high-stakes environments.
  • The adoption of tools for remote monitoring and automated incident reporting improves operational oversight. Furthermore, the deployment of K9 units and advanced threat detection systems is becoming standard for critical infrastructure.
  • Security consulting is pivotal in designing these multi-layered systems, ensuring that geopolitical risk advisory and proactive cyber-physical security measures are embedded into a cohesive defense strategy for managing large-scale events and protecting personnel through effective crowd management and emergency evacuation protocols.

What are the Key Data Covered in this Private Security Services Market Research and Growth Report?

  • What is the expected growth of the Private Security Services Market between 2026 and 2030?

    • USD 280.39 billion, at a CAGR of 11.8%

  • What segmentation does the market report cover?

    • The report is segmented by Application (Industrial, Residential, Financial institutions, and Others), Service (Manned guarding, Electronic security services, and Cash services), End-user (BFSI, Manufacturing, Energy and utilities, and Others) and Geography (APAC, North America, Europe, South America, Middle East and Africa)

  • Which regions are analyzed in the report?

    • APAC, North America, Europe, South America and Middle East and Africa

  • What are the key growth drivers and market challenges?

    • Rapid urbanization and population growth, Shortage of private security personnel

  • Who are the major players in the Private Security Services Market?

    • ADT Inc., Allied Universal, Bidvest Group Ltd., Constellis, Control Risks Group Holdings, GardaWorld Security Corp., ICTS Europe SA, Inter Con Security Systems, ISS AS, Mitie Group plc, OCS Group International Ltd., Prosegur Compania de Seguridad, Secom Co. Ltd., Securitas AB, The Brinks Co., Total Security Services Ltd., Transguard Group LLC and Vector Security Inc.

Market Research Insights

  • Market dynamics are increasingly shaped by the adoption of technology-driven services that enhance efficiency and response capabilities. For example, firms leveraging virtual guarding services have reported operational overhead reductions of up to 20% compared to traditional on-site models.
  • In the residential sector, the focus on smart home security integration continues to grow, while the commercial side sees an emphasis on robust retail security solutions. These advanced systems have been shown to decrease inventory shrinkage by over 15% in high-volume settings.
  • Concurrently, businesses are placing a greater emphasis on comprehensive supply chain security to meet evolving compliance mandates and mitigate transit-related risks, driving demand for integrated tracking and monitoring platforms that provide end-to-end visibility and protection of assets.

We can help! Our analysts can customize this private security services market research report to meet your requirements.

Get in touch

1. Executive Summary

1.1 Market overview

Executive Summary - Chart on Market Overview
Executive Summary - Data Table on Market Overview
Executive Summary - Chart on Global Market Characteristics
Executive Summary - Chart on Market by Geography
Executive Summary - Chart on Market Segmentation by Application
Executive Summary - Chart on Market Segmentation by Service
Executive Summary - Chart on Market Segmentation by End-user
Executive Summary - Chart on Incremental Growth
Executive Summary - Data Table on Incremental Growth
Executive Summary - Chart on Company Market Positioning

2. Technavio Analysis

2.1 Analysis of price sensitivity, lifecycle, customer purchase basket, adoption rates, and purchase criteria

2.2 Criticality of inputs and Factors of differentiation

Chart on Overview on criticality of inputs and factors of differentiation

2.3 Factors of disruption

Chart on Overview on factors of disruption

2.4 Impact of drivers and challenges

Chart on Impact of drivers and challenges in 2025 and 2030

3. Market Landscape

3.1 Market ecosystem

Chart on Parent Market
Data Table on - Parent Market

3.2 Market characteristics

Chart on Market characteristics analysis

3.3 Value chain analysis

Chart on Value chain analysis

4. Market Sizing

4.1 Market definition

Data Table on Offerings of companies included in the market definition

4.2 Market segment analysis

Market segments

4.3 Market size 2025

4.4 Market outlook: Forecast for 2025-2030

Chart on Global - Market size and forecast 2025-2030 ($ million)
Data Table on Global - Market size and forecast 2025-2030 ($ million)
Chart on Global Market: Year-over-year growth 2025-2030 (%)
Data Table on Global Market: Year-over-year growth 2025-2030 (%)

5. Historic Market Size

5.1 Global Private Security Services Market 2020 - 2024

Historic Market Size - Data Table on Global Private Security Services Market 2020 - 2024 ($ million)

5.2 Application segment analysis 2020 - 2024

Historic Market Size - Application Segment 2020 - 2024 ($ million)

5.3 Service segment analysis 2020 - 2024

Historic Market Size - Service Segment 2020 - 2024 ($ million)

5.4 End-user segment analysis 2020 - 2024

Historic Market Size - End-user Segment 2020 - 2024 ($ million)

5.5 Geography segment analysis 2020 - 2024

Historic Market Size - Geography Segment 2020 - 2024 ($ million)

5.6 Country segment analysis 2020 - 2024

Historic Market Size - Country Segment 2020 - 2024 ($ million)

6. Qualitative Analysis

6.1 Impact of AI on Global Private Security Services Market

7. Five Forces Analysis

7.1 Five forces summary

Five forces analysis - Comparison between 2025 and 2030

7.2 Bargaining power of buyers

Bargaining power of buyers - Impact of key factors 2025 and 2030

7.3 Bargaining power of suppliers

Bargaining power of suppliers - Impact of key factors in 2025 and 2030

7.4 Threat of new entrants

Threat of new entrants - Impact of key factors in 2025 and 2030

7.5 Threat of substitutes

Threat of substitutes - Impact of key factors in 2025 and 2030

7.6 Threat of rivalry

Threat of rivalry - Impact of key factors in 2025 and 2030

7.7 Market condition

Chart on Market condition - Five forces 2025 and 2030

8. Market Segmentation by Application

8.1 Market segments

Chart on Application - Market share 2025-2030 (%)
Data Table on Application - Market share 2025-2030 (%)

8.2 Comparison by Application

Chart on Comparison by Application
Data Table on Comparison by Application

8.3 Industrial - Market size and forecast 2025-2030

Chart on Industrial - Market size and forecast 2025-2030 ($ million)
Data Table on Industrial - Market size and forecast 2025-2030 ($ million)
Chart on Industrial - Year-over-year growth 2025-2030 (%)
Data Table on Industrial - Year-over-year growth 2025-2030 (%)

8.4 Residential - Market size and forecast 2025-2030

Chart on Residential - Market size and forecast 2025-2030 ($ million)
Data Table on Residential - Market size and forecast 2025-2030 ($ million)
Chart on Residential - Year-over-year growth 2025-2030 (%)
Data Table on Residential - Year-over-year growth 2025-2030 (%)

8.5 Financial institutions - Market size and forecast 2025-2030

Chart on Financial institutions - Market size and forecast 2025-2030 ($ million)
Data Table on Financial institutions - Market size and forecast 2025-2030 ($ million)
Chart on Financial institutions - Year-over-year growth 2025-2030 (%)
Data Table on Financial institutions - Year-over-year growth 2025-2030 (%)

8.6 Others - Market size and forecast 2025-2030

Chart on Others - Market size and forecast 2025-2030 ($ million)
Data Table on Others - Market size and forecast 2025-2030 ($ million)
Chart on Others - Year-over-year growth 2025-2030 (%)
Data Table on Others - Year-over-year growth 2025-2030 (%)

8.7 Market opportunity by Application

Market opportunity by Application ($ million)
Data Table on Market opportunity by Application ($ million)

9. Market Segmentation by Service

9.1 Market segments

Chart on Service - Market share 2025-2030 (%)
Data Table on Service - Market share 2025-2030 (%)

9.2 Comparison by Service

Chart on Comparison by Service
Data Table on Comparison by Service

9.3 Manned guarding - Market size and forecast 2025-2030

Chart on Manned guarding - Market size and forecast 2025-2030 ($ million)
Data Table on Manned guarding - Market size and forecast 2025-2030 ($ million)
Chart on Manned guarding - Year-over-year growth 2025-2030 (%)
Data Table on Manned guarding - Year-over-year growth 2025-2030 (%)

9.4 Electronic security services - Market size and forecast 2025-2030

Chart on Electronic security services - Market size and forecast 2025-2030 ($ million)
Data Table on Electronic security services - Market size and forecast 2025-2030 ($ million)
Chart on Electronic security services - Year-over-year growth 2025-2030 (%)
Data Table on Electronic security services - Year-over-year growth 2025-2030 (%)

9.5 Cash services - Market size and forecast 2025-2030

Chart on Cash services - Market size and forecast 2025-2030 ($ million)
Data Table on Cash services - Market size and forecast 2025-2030 ($ million)
Chart on Cash services - Year-over-year growth 2025-2030 (%)
Data Table on Cash services - Year-over-year growth 2025-2030 (%)

9.6 Market opportunity by Service

Market opportunity by Service ($ million)
Data Table on Market opportunity by Service ($ million)

10. Market Segmentation by End-user

10.1 Market segments

Chart on End-user - Market share 2025-2030 (%)
Data Table on End-user - Market share 2025-2030 (%)

10.2 Comparison by End-user

Chart on Comparison by End-user
Data Table on Comparison by End-user

10.3 BFSI - Market size and forecast 2025-2030

Chart on BFSI - Market size and forecast 2025-2030 ($ million)
Data Table on BFSI - Market size and forecast 2025-2030 ($ million)
Chart on BFSI - Year-over-year growth 2025-2030 (%)
Data Table on BFSI - Year-over-year growth 2025-2030 (%)

10.4 Manufacturing - Market size and forecast 2025-2030

Chart on Manufacturing - Market size and forecast 2025-2030 ($ million)
Data Table on Manufacturing - Market size and forecast 2025-2030 ($ million)
Chart on Manufacturing - Year-over-year growth 2025-2030 (%)
Data Table on Manufacturing - Year-over-year growth 2025-2030 (%)

10.5 Energy and utilities - Market size and forecast 2025-2030

Chart on Energy and utilities - Market size and forecast 2025-2030 ($ million)
Data Table on Energy and utilities - Market size and forecast 2025-2030 ($ million)
Chart on Energy and utilities - Year-over-year growth 2025-2030 (%)
Data Table on Energy and utilities - Year-over-year growth 2025-2030 (%)

10.6 Others - Market size and forecast 2025-2030

Chart on Others - Market size and forecast 2025-2030 ($ million)
Data Table on Others - Market size and forecast 2025-2030 ($ million)
Chart on Others - Year-over-year growth 2025-2030 (%)
Data Table on Others - Year-over-year growth 2025-2030 (%)

10.7 Market opportunity by End-user

Market opportunity by End-user ($ million)
Data Table on Market opportunity by End-user ($ million)

11. Customer Landscape

11.1 Customer landscape overview

Analysis of price sensitivity, lifecycle, customer purchase basket, adoption rates, and purchase criteria

12. Geographic Landscape

12.1 Geographic segmentation

Chart on Market share by geography 2025-2030 (%)
Data Table on Market share by geography 2025-2030 (%)

12.2 Geographic comparison

Chart on Geographic comparison
Data Table on Geographic comparison

12.3 APAC - Market size and forecast 2025-2030

Chart on APAC - Market size and forecast 2025-2030 ($ million)
Data Table on APAC - Market size and forecast 2025-2030 ($ million)
Chart on APAC - Year-over-year growth 2025-2030 (%)
Data Table on APAC - Year-over-year growth 2025-2030 (%)
Chart on Regional Comparison - APAC
Data Table on Regional Comparison - APAC

12.3.1 China - Market size and forecast 2025-2030

Chart on China - Market size and forecast 2025-2030 ($ million)
Data Table on China - Market size and forecast 2025-2030 ($ million)
Chart on China - Year-over-year growth 2025-2030 (%)
Data Table on China - Year-over-year growth 2025-2030 (%)

12.3.2 Japan - Market size and forecast 2025-2030

Chart on Japan - Market size and forecast 2025-2030 ($ million)
Data Table on Japan - Market size and forecast 2025-2030 ($ million)
Chart on Japan - Year-over-year growth 2025-2030 (%)
Data Table on Japan - Year-over-year growth 2025-2030 (%)

12.3.3 India - Market size and forecast 2025-2030

Chart on India - Market size and forecast 2025-2030 ($ million)
Data Table on India - Market size and forecast 2025-2030 ($ million)
Chart on India - Year-over-year growth 2025-2030 (%)
Data Table on India - Year-over-year growth 2025-2030 (%)

12.3.4 South Korea - Market size and forecast 2025-2030

Chart on South Korea - Market size and forecast 2025-2030 ($ million)
Data Table on South Korea - Market size and forecast 2025-2030 ($ million)
Chart on South Korea - Year-over-year growth 2025-2030 (%)
Data Table on South Korea - Year-over-year growth 2025-2030 (%)

12.3.5 Australia - Market size and forecast 2025-2030

Chart on Australia - Market size and forecast 2025-2030 ($ million)
Data Table on Australia - Market size and forecast 2025-2030 ($ million)
Chart on Australia - Year-over-year growth 2025-2030 (%)
Data Table on Australia - Year-over-year growth 2025-2030 (%)

12.3.6 Indonesia - Market size and forecast 2025-2030

Chart on Indonesia - Market size and forecast 2025-2030 ($ million)
Data Table on Indonesia - Market size and forecast 2025-2030 ($ million)
Chart on Indonesia - Year-over-year growth 2025-2030 (%)
Data Table on Indonesia - Year-over-year growth 2025-2030 (%)

12.4 North America - Market size and forecast 2025-2030

Chart on North America - Market size and forecast 2025-2030 ($ million)
Data Table on North America - Market size and forecast 2025-2030 ($ million)
Chart on North America - Year-over-year growth 2025-2030 (%)
Data Table on North America - Year-over-year growth 2025-2030 (%)
Chart on Regional Comparison - North America
Data Table on Regional Comparison - North America

12.4.1 US - Market size and forecast 2025-2030

Chart on US - Market size and forecast 2025-2030 ($ million)
Data Table on US - Market size and forecast 2025-2030 ($ million)
Chart on US - Year-over-year growth 2025-2030 (%)
Data Table on US - Year-over-year growth 2025-2030 (%)

12.4.2 Canada - Market size and forecast 2025-2030

Chart on Canada - Market size and forecast 2025-2030 ($ million)
Data Table on Canada - Market size and forecast 2025-2030 ($ million)
Chart on Canada - Year-over-year growth 2025-2030 (%)
Data Table on Canada - Year-over-year growth 2025-2030 (%)

12.4.3 Mexico - Market size and forecast 2025-2030

Chart on Mexico - Market size and forecast 2025-2030 ($ million)
Data Table on Mexico - Market size and forecast 2025-2030 ($ million)
Chart on Mexico - Year-over-year growth 2025-2030 (%)
Data Table on Mexico - Year-over-year growth 2025-2030 (%)

12.5 Europe - Market size and forecast 2025-2030

Chart on Europe - Market size and forecast 2025-2030 ($ million)
Data Table on Europe - Market size and forecast 2025-2030 ($ million)
Chart on Europe - Year-over-year growth 2025-2030 (%)
Data Table on Europe - Year-over-year growth 2025-2030 (%)
Chart on Regional Comparison - Europe
Data Table on Regional Comparison - Europe

12.5.1 Germany - Market size and forecast 2025-2030

Chart on Germany - Market size and forecast 2025-2030 ($ million)
Data Table on Germany - Market size and forecast 2025-2030 ($ million)
Chart on Germany - Year-over-year growth 2025-2030 (%)
Data Table on Germany - Year-over-year growth 2025-2030 (%)

12.5.2 UK - Market size and forecast 2025-2030

Chart on UK - Market size and forecast 2025-2030 ($ million)
Data Table on UK - Market size and forecast 2025-2030 ($ million)
Chart on UK - Year-over-year growth 2025-2030 (%)
Data Table on UK - Year-over-year growth 2025-2030 (%)

12.5.3 France - Market size and forecast 2025-2030

Chart on France - Market size and forecast 2025-2030 ($ million)
Data Table on France - Market size and forecast 2025-2030 ($ million)
Chart on France - Year-over-year growth 2025-2030 (%)
Data Table on France - Year-over-year growth 2025-2030 (%)

12.5.4 Italy - Market size and forecast 2025-2030

Chart on Italy - Market size and forecast 2025-2030 ($ million)
Data Table on Italy - Market size and forecast 2025-2030 ($ million)
Chart on Italy - Year-over-year growth 2025-2030 (%)
Data Table on Italy - Year-over-year growth 2025-2030 (%)

12.5.5 Spain - Market size and forecast 2025-2030

Chart on Spain - Market size and forecast 2025-2030 ($ million)
Data Table on Spain - Market size and forecast 2025-2030 ($ million)
Chart on Spain - Year-over-year growth 2025-2030 (%)
Data Table on Spain - Year-over-year growth 2025-2030 (%)

12.5.6 The Netherlands - Market size and forecast 2025-2030

Chart on The Netherlands - Market size and forecast 2025-2030 ($ million)
Data Table on The Netherlands - Market size and forecast 2025-2030 ($ million)
Chart on The Netherlands - Year-over-year growth 2025-2030 (%)
Data Table on The Netherlands - Year-over-year growth 2025-2030 (%)

12.6 South America - Market size and forecast 2025-2030

Chart on South America - Market size and forecast 2025-2030 ($ million)
Data Table on South America - Market size and forecast 2025-2030 ($ million)
Chart on South America - Year-over-year growth 2025-2030 (%)
Data Table on South America - Year-over-year growth 2025-2030 (%)
Chart on Regional Comparison - South America
Data Table on Regional Comparison - South America

12.6.1 Brazil - Market size and forecast 2025-2030

Chart on Brazil - Market size and forecast 2025-2030 ($ million)
Data Table on Brazil - Market size and forecast 2025-2030 ($ million)
Chart on Brazil - Year-over-year growth 2025-2030 (%)
Data Table on Brazil - Year-over-year growth 2025-2030 (%)

12.6.2 Argentina - Market size and forecast 2025-2030

Chart on Argentina - Market size and forecast 2025-2030 ($ million)
Data Table on Argentina - Market size and forecast 2025-2030 ($ million)
Chart on Argentina - Year-over-year growth 2025-2030 (%)
Data Table on Argentina - Year-over-year growth 2025-2030 (%)

12.6.3 Colombia - Market size and forecast 2025-2030

Chart on Colombia - Market size and forecast 2025-2030 ($ million)
Data Table on Colombia - Market size and forecast 2025-2030 ($ million)
Chart on Colombia - Year-over-year growth 2025-2030 (%)
Data Table on Colombia - Year-over-year growth 2025-2030 (%)

12.7 Middle East and Africa - Market size and forecast 2025-2030

Chart on Middle East and Africa - Market size and forecast 2025-2030 ($ million)
Data Table on Middle East and Africa - Market size and forecast 2025-2030 ($ million)
Chart on Middle East and Africa - Year-over-year growth 2025-2030 (%)
Data Table on Middle East and Africa - Year-over-year growth 2025-2030 (%)
Chart on Regional Comparison - Middle East and Africa
Data Table on Regional Comparison - Middle East and Africa

12.7.1 Saudi Arabia - Market size and forecast 2025-2030

Chart on Saudi Arabia - Market size and forecast 2025-2030 ($ million)
Data Table on Saudi Arabia - Market size and forecast 2025-2030 ($ million)
Chart on Saudi Arabia - Year-over-year growth 2025-2030 (%)
Data Table on Saudi Arabia - Year-over-year growth 2025-2030 (%)

12.7.2 UAE - Market size and forecast 2025-2030

Chart on UAE - Market size and forecast 2025-2030 ($ million)
Data Table on UAE - Market size and forecast 2025-2030 ($ million)
Chart on UAE - Year-over-year growth 2025-2030 (%)
Data Table on UAE - Year-over-year growth 2025-2030 (%)

12.7.3 South Africa - Market size and forecast 2025-2030

Chart on South Africa - Market size and forecast 2025-2030 ($ million)
Data Table on South Africa - Market size and forecast 2025-2030 ($ million)
Chart on South Africa - Year-over-year growth 2025-2030 (%)
Data Table on South Africa - Year-over-year growth 2025-2030 (%)

12.7.4 Israel - Market size and forecast 2025-2030

Chart on Israel - Market size and forecast 2025-2030 ($ million)
Data Table on Israel - Market size and forecast 2025-2030 ($ million)
Chart on Israel - Year-over-year growth 2025-2030 (%)
Data Table on Israel - Year-over-year growth 2025-2030 (%)

12.7.5 Turkey - Market size and forecast 2025-2030

Chart on Turkey - Market size and forecast 2025-2030 ($ million)
Data Table on Turkey - Market size and forecast 2025-2030 ($ million)
Chart on Turkey - Year-over-year growth 2025-2030 (%)
Data Table on Turkey - Year-over-year growth 2025-2030 (%)

12.8 Market opportunity by geography

Market opportunity by geography ($ million)
Data Tables on Market opportunity by geography ($ million)

13. Drivers, Challenges, and Opportunity

13.1 Market drivers

Rapid urbanization and population growth
Integration of advanced surveillance technology
Increasing demand for event security

13.2 Market challenges

Shortage of private security personnel
Issues related to weapon licensing
Presence of complex laws governing private security services

13.3 Impact of drivers and challenges

Impact of drivers and challenges in 2025 and 2030

13.4 Market opportunities

Increasing popularity of virtual security systems
Rise in awareness of integrated security solutions
Rising adoption of AI and automation in security services

14. Competitive Landscape

14.1 Overview

14.2

Overview on criticality of inputs and factors of differentiation

14.3 Landscape disruption

Overview on factors of disruption

14.4 Industry risks

Impact of key risks on business

15. Competitive Analysis

15.1 Companies profiled

Companies covered

15.2 Company ranking index

15.3 Market positioning of companies

Matrix on companies position and classification

15.4 ADT Inc.

ADT Inc. - Overview
ADT Inc. - Business segments
ADT Inc. - Key news
ADT Inc. - Key offerings
ADT Inc. - Segment focus
SWOT

15.5 Allied Universal

Allied Universal - Overview
Allied Universal - Product / Service
Allied Universal - Key offerings
SWOT

15.6 Bidvest Group Ltd.

Bidvest Group Ltd. - Overview
Bidvest Group Ltd. - Business segments
Bidvest Group Ltd. - Key offerings
Bidvest Group Ltd. - Segment focus
SWOT

15.7 Constellis

Constellis - Overview
Constellis - Product / Service
Constellis - Key offerings
SWOT

15.8 GardaWorld Security Corp.

GardaWorld Security Corp. - Overview
GardaWorld Security Corp. - Product / Service
GardaWorld Security Corp. - Key offerings
SWOT

15.9 ICTS Europe SA

ICTS Europe SA - Overview
ICTS Europe SA - Product / Service
ICTS Europe SA - Key offerings
SWOT

15.10 Inter Con Security Systems

Inter Con Security Systems - Overview
Inter Con Security Systems - Product / Service
Inter Con Security Systems - Key offerings
SWOT

15.11 ISS AS

ISS AS - Overview
ISS AS - Business segments
ISS AS - Key offerings
ISS AS - Segment focus
SWOT

15.12 Mitie Group plc

Mitie Group plc - Overview
Mitie Group plc - Business segments
Mitie Group plc - Key offerings
Mitie Group plc - Segment focus
SWOT

15.13 OCS Group International Ltd.

OCS Group International Ltd. - Overview
OCS Group International Ltd. - Product / Service
OCS Group International Ltd. - Key offerings
SWOT

15.14 Prosegur Compania de Seguridad

Prosegur Compania de Seguridad - Overview
Prosegur Compania de Seguridad - Business segments
Prosegur Compania de Seguridad - Key offerings
Prosegur Compania de Seguridad - Segment focus
SWOT

15.15 Secom Co. Ltd.

Secom Co. Ltd. - Overview
Secom Co. Ltd. - Business segments
Secom Co. Ltd. - Key offerings
Secom Co. Ltd. - Segment focus
SWOT

15.16 Securitas AB

Securitas AB - Overview
Securitas AB - Business segments
Securitas AB - Key news
Securitas AB - Key offerings
Securitas AB - Segment focus
SWOT

15.17 The Brinks Co.

The Brinks Co. - Overview
The Brinks Co. - Business segments
The Brinks Co. - Key offerings
The Brinks Co. - Segment focus
SWOT

15.18 Transguard Group LLC

Transguard Group LLC - Overview
Transguard Group LLC - Product / Service
Transguard Group LLC - Key offerings
SWOT

16. Appendix

16.1 Scope of the report

Market definition
Objectives
Notes and caveats

16.2 Inclusions and exclusions checklist

Inclusions checklist
Exclusions checklist

16.3 Currency conversion rates for US$

16.4 Research methodology

16.5 Data procurement

Information sources

16.6 Data validation

16.7 Validation techniques employed for market sizing

16.8 Data synthesis

16.9 360 degree market analysis

16.10 List of abbreviations

Research Methodology

Technavio presents a detailed picture of the market by way of study, synthesis, and summation of data from multiple sources. The analysts have presented the various facets of the market with a particular focus on identifying the key industry influencers. The data thus presented is comprehensive, reliable, and the result of extensive research, both primary and secondary.

INFORMATION SOURCES

Primary sources

  • Manufacturers and suppliers
  • Channel partners
  • Industry experts
  • Strategic decision makers

Secondary sources

  • Industry journals and periodicals
  • Government data
  • Financial reports of key industry players
  • Historical data
  • Press releases

DATA ANALYSIS

Data Synthesis

  • Collation of data
  • Estimation of key figures
  • Analysis of derived insights

Data Validation

  • Triangulation with data models
  • Reference against proprietary databases
  • Corroboration with industry experts

REPORT WRITING

Qualitative

  • Market drivers
  • Market challenges
  • Market trends
  • Five forces analysis

Quantitative

  • Market size and forecast
  • Market segmentation
  • Geographical insights
  • Competitive landscape

Interested in this report?

Get your sample now to see our research methodology and insights!

Download Now

Frequently Asked Questions

Private Security Services market growth will increase by USD 280391.4 million during 2026-2030.

The Private Security Services market is expected to grow at a CAGR of 11.8% during 2026-2030.

Private Security Services market is segmented by Application (Industrial, Residential, Financial institutions, Others) Service (Manned guarding, Electronic security services, Cash services) End-user (BFSI, Manufacturing, Energy and utilities, Others)

ADT Inc., Allied Universal, Bidvest Group Ltd., Constellis, Control Risks Group Holdings, GardaWorld Security Corp., ICTS Europe SA, Inter Con Security Systems, ISS AS, Mitie Group plc, OCS Group International Ltd., Prosegur Compania de Seguridad, Secom Co. Ltd., Securitas AB, The Brinks Co., Total Security Services Ltd., Transguard Group LLC, Vector Security Inc. are a few of the key vendors in the Private Security Services market.

APAC will register the highest growth rate of 43.1% among the other regions. Therefore, the Private Security Services market in APAC is expected to garner significant business opportunities for the vendors during the forecast period.

China, Japan, India, South Korea, Australia, Indonesia, US, Canada, Mexico, Germany, UK, France, Italy, Spain, The Netherlands, Brazil, Argentina, Colombia, Saudi Arabia, UAE, South Africa, Israel, Turkey

  • Rapid urbanization and population growth is the driving factor this market.

The Private Security Services market vendors should focus on grabbing business opportunities from the Application segment as it accounted for the largest market share in the base year.
RIA - Research AI Assistant
Ask RIA