Maritime Surveillance Market Size 2025-2029
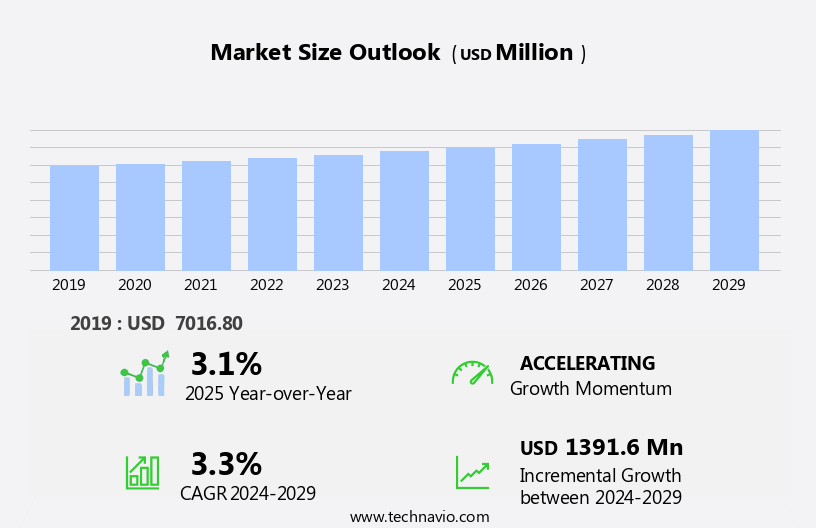
The maritime surveillance market size is forecast to increase by USD 1.39 billion at a CAGR of 3.3% between 2024 and 2029.
- The market is experiencing significant growth due to escalating marine threats and the expansion of naval fleets in critical regions. These factors have heightened the demand for advanced surveillance systems to ensure border security and protect economic interests. However, the high installation cost of maritime surveillance systems poses a significant challenge for market growth. Despite this, opportunities abound for companies that can offer cost-effective and innovative solutions. The integration of artificial intelligence and machine learning technologies into maritime surveillance systems is a key trend driving market expansion.
- Additionally, the increasing adoption of unmanned surface vehicles and underwater drones for surveillance is expected to create new opportunities in the market. Companies seeking to capitalize on these opportunities must stay abreast of technological advancements and regulatory requirements while navigating the complexities of international maritime law and geopolitical tensions.
What will be the Size of the Maritime Surveillance Market during the forecast period?

Request Free Sample
- The market encompasses a range of technologies and services designed to enhance security, optimize operations, and protect the environment in the maritime domain. This market is experiencing significant growth due to increasing demand for advanced maritime situational awareness, efficient maritime operations, and effective response to emergencies and threats. Key drivers include the integration of maritime sensor networks, information sharing between agencies, and the adoption of smart shipping and digital transformation. Maritime surveillance solutions are utilized for various applications, including maritime operations centers, coastal patrol, maritime emergency response, human trafficking prevention, and maritime security assessment.
- Additionally, there is a growing focus on sustainable maritime operations, oceanographic data collection, and environmental protection. Collaborative surveillance, threat intelligence, and risk management are also critical components of the market, as is the integration of technologies such as blockchain, multi-sensor data fusion, and autonomous maritime operations. The market is further driven by the implementation of advanced maritime communication networks, seabed mapping, and 5G technology. Overall, the market is a dynamic and evolving landscape, with a strong focus on innovation and continuous improvement to meet the complex needs of stakeholders in the maritime industry.
How is this Maritime Surveillance Industry segmented?
The maritime surveillance industry research report provides comprehensive data (region-wise segment analysis), with forecasts and estimates in "USD million" for the period 2025-2029, as well as historical data from 2019-2023 for the following segments.
- Component
- Sensors
- Radar
- AIS receiver
- Others
- End-user
- Defense
- Customs
- Fisheries
- Intelligence
- Others
- Type
- Coastal surveillance
- Port surveillance
- Vessel tracking
- Submarine surveillance
- Geography
- North America
- Europe
- APAC
- China
- India
- Japan
- South Korea
- Middle East and Africa
- South America
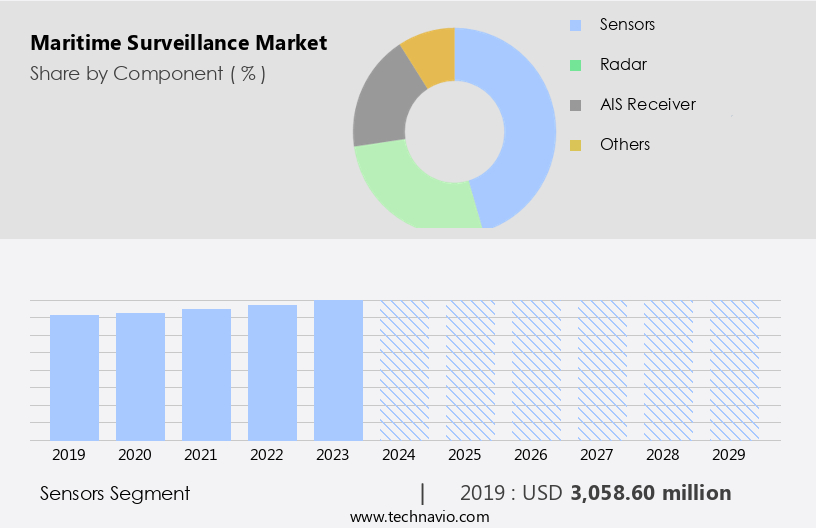
By Component Insights
The sensors segment is estimated to witness significant growth during the forecast period.
Maritime surveillance involves utilizing advanced sensors and technologies for various applications, such as oil spill detection, maritime law enforcement, naval operations, and fisheries management. Integrated surveillance systems employ communication systems, cloud computing, maritime information sharing, and data visualization tools for enhanced situational awareness. Artificial Intelligence (AI) and Machine Learning (ML) enable threat analysis, risk assessment, and ship detection from satellite imagery, radar systems, and underwater acoustic sensors. Multi-Sensor Networks and sensor fusion provide real-time data for maritime security operations, illegal fishing, and border security.
Cyber-Physical Systems ensure secure data transmission with strong security protocols. The shipping industry relies on vessel tracking, maritime traffic management, and geospatial intelligence for improved maritime domain awareness and maritime safety. Big Data and data analytics facilitate real-time decision-making, ensuring optimal operational efficiency and effective response to potential threats.

Get a glance at the market report of share of various segments Request Free Sample
The Sensors segment was valued at USD 3.06 billion in 2019 and showed a gradual increase during the forecast period.
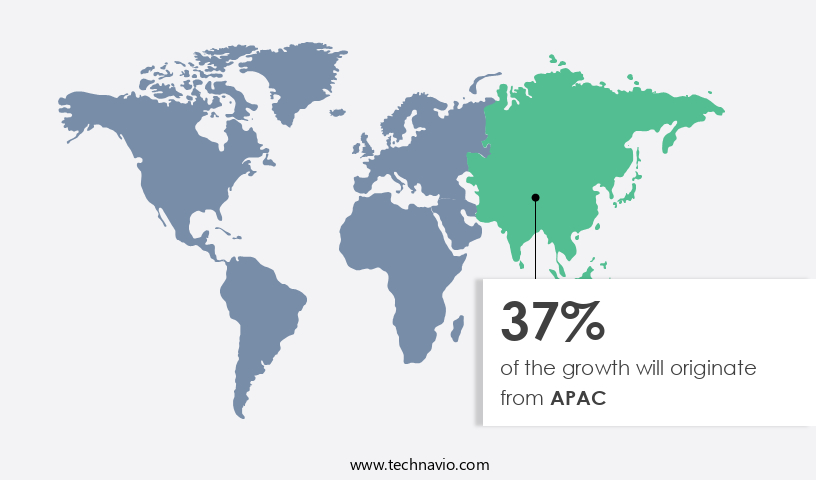
Regional Analysis
APAC is estimated to contribute 37% to the growth of the global market during the forecast period.Technavio’s analysts have elaborately explained the regional trends and drivers that shape the market during the forecast period.

For more insights on the market size of various regions, Request Free Sample
The North American market is projected to expand due to heightened security concerns following potential terrorist threats in the region, particularly in the US. Maritime law enforcement agencies, such as the US Coast Guard, have recognized the significance of Automatic Identification System (AIS) and Long Range Identification and Tracking (LRIT) devices, leading to the enhancement of maritime surveillance systems in US ports. Integrated surveillance systems, combining communication systems, satellite imagery, remote sensing, and sensor fusion, play a crucial role in maritime domain awareness, enabling real-time threat analysis, ship detection, and vessel tracking. Furthermore, the adoption of advanced technologies like artificial intelligence (AI), machine learning (ML), and cyber-physical systems contributes to enhanced data visualization, data analytics, and situational awareness.
Maritime information sharing, multi-sensor networks, and geospatial intelligence facilitate effective maritime security operations, border security, and environmental monitoring. The shipping industry, fisheries management, and maritime traffic management also benefit from these advanced solutions. Security protocols and edge computing ensure data privacy and protection. In summary, the North American market is poised for growth due to the increasing demand for enhanced maritime safety, security, and situational awareness.
Market Dynamics
Our researchers analyzed the data with 2024 as the base year, along with the key drivers, trends, and challenges. A holistic analysis of drivers will help companies refine their marketing strategies to gain a competitive advantage.
What are the key market drivers leading to the rise in the adoption of Maritime Surveillance Industry?
- Growing marine threats is the key driver of the market. The market is experiencing significant growth due to the increasing importance of securing coastal borders and ensuring national security and territorial integrity. Marine borders hold strategic significance in global trade, immigration, and emigration. With many countries possessing extensive coastlines, the use of advanced airborne platforms for patrolling territorial waters is becoming increasingly crucial. Maritime surveillance systems offer effective solutions for detecting and identifying potential threats, enabling authorities to carry out necessary security operations.
- For instance, the oil rigs in the Gulf of Guinea, off the coast of Western Africa, are frequently targeted by pirates. These systems play a vital role in safeguarding economic interests and maintaining peace and order at sea.
What are the market trends shaping the Maritime Surveillance Industry?
- Expansion of Chinese naval fleet in critical regions is the upcoming market trend. The market has experienced significant growth due to increasing geopolitical tensions and the need for border security in critical regions. China's naval fleet expansion, announced in 2012 with the goal of making China a maritime superpower, has intensified competition and the requirement for advanced surveillance systems. This expansion has led China to assert its presence in areas of contention, such as the South China Sea and the Indian Ocean, causing concern for neighboring countries.
- In response, military forces are enhancing their maritime surveillance capabilities to monitor and secure their territorial waters. This competitive environment and the necessity for advanced technology solutions are expected to drive the expansion of the market over the forecast period.
What challenges does the Maritime Surveillance Industry face during its growth?
- The high installation cost of maritime surveillance systems is a key challenge affecting the industry's growth. Maritime surveillance technologies and equipment play a crucial role in ensuring the safe transit of goods, people, and vessels in the shipping industry. However, the high costs of repairing, maintaining, and upgrading these systems deter some small ports and harbors from investing in them. Operational risks in the shipping business, including mechanical failure, adverse weather conditions, pirate attacks, and navigational errors, can result in significant expenses for market players. The safety of personnel managing vessels and marine equipment, cargo, machinery, and devices is another concern.
- Despite these challenges, the benefits of maritime surveillance, such as enhanced security and improved operational efficiency, make it an essential investment for many players in the industry. The integration of advanced technologies, such as artificial intelligence and machine learning, into maritime surveillance systems can help reduce costs and increase efficiency, making them more accessible to a wider range of stakeholders.
Exclusive Customer Landscape
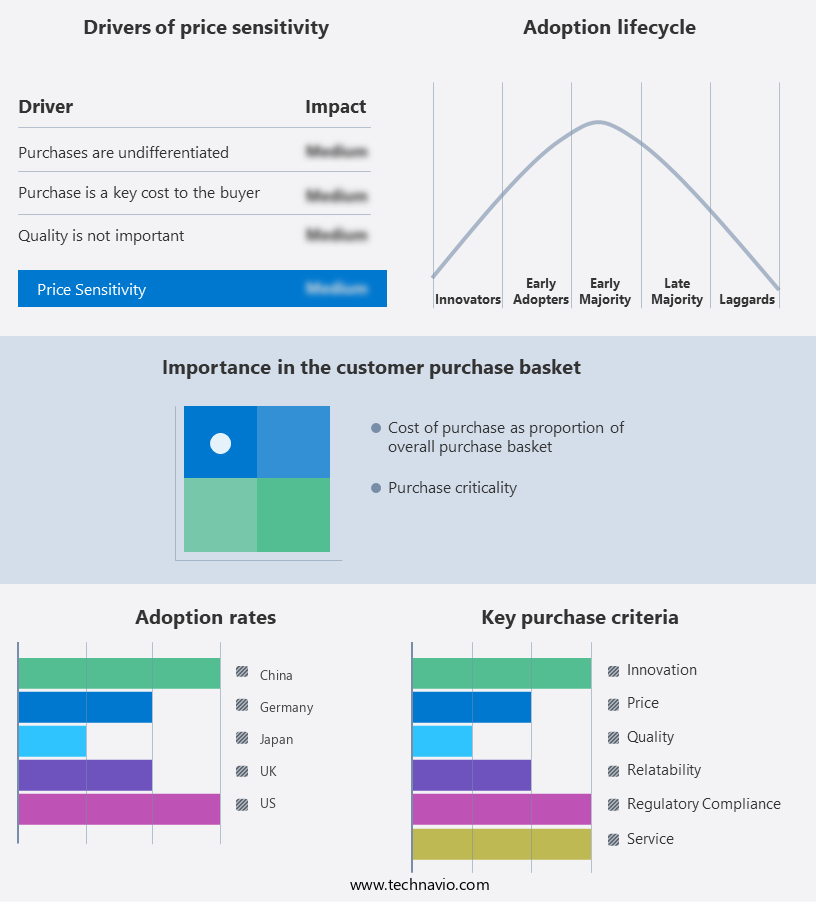
The maritime surveillance market forecasting report includes the adoption lifecycle of the market, covering from the innovator’s stage to the laggard’s stage. It focuses on adoption rates in different regions based on penetration. Furthermore, the maritime surveillance market report also includes key purchase criteria and drivers of price sensitivity to help companies evaluate and develop their market growth analysis strategies.

Customer Landscape
Key Companies & Market Insights
Companies are implementing various strategies, such as strategic alliances, maritime surveillance market forecast, partnerships, mergers and acquisitions, geographical expansion, and product/service launches, to enhance their presence in the industry.
Airbus SE - The company provides advanced maritime surveillance solutions through its software, OceanFinder. This innovative technology enables real-time fleet monitoring, streamlines mission preparation, and offers enhanced situational awareness for effective maritime security and management.
The industry research and growth report includes detailed analyses of the competitive landscape of the market and information about key companies, including:
- Airbus SE
- BAE Systems Plc
- Elbit Systems Ltd.
- Furuno Electric Co. Ltd.
- HENSOLDT AG
- Honeywell International Inc.
- Kongsberg Gruppen ASA
- L3Harris Technologies Inc.
- Lockheed Martin Corp.
- MIND TECHNOLOGY INC.
- Northrop Grumman Corp.
- RTX Corp.
- Saab AB
- Safran SA
- Sonardyne International Ltd.
- SRT Marine Systems Plc
- Teledyne Technologies Inc.
- Terma AS
- Thales Group
- The Boeing Co.
Qualitative and quantitative analysis of companies has been conducted to help clients understand the wider business environment as well as the strengths and weaknesses of key industry players. Data is qualitatively analyzed to categorize companies as pure play, category-focused, industry-focused, and diversified; it is quantitatively analyzed to categorize companies as dominant, leading, strong, tentative, and weak.
Research Analyst Overview
The market encompasses a range of technologies and applications designed to enhance situational awareness and ensure the security and safety of maritime domains. Integrated surveillance systems play a crucial role in this market, combining multiple sensors and data sources to provide real-time information for effective decision-making. Communication systems are a key component of maritime surveillance, enabling seamless information sharing between various stakeholders. Cloud computing and data analytics have revolutionized the way data is processed and analyzed, providing valuable insights for maritime law enforcement, naval operations, and fisheries management. Maritime domain awareness is a critical aspect of maritime surveillance, with geospatial intelligence and satellite imagery playing essential roles in monitoring large areas of water for potential threats or anomalies.
Remote sensing technologies, such as synthetic aperture radar and underwater acoustic sensors, provide valuable data for environmental monitoring and ship detection. Artificial intelligence (AI) and machine learning (ML) are increasingly being adopted in maritime surveillance to enhance threat analysis and risk assessment capabilities. Sensor fusion and data visualization tools enable effective data analysis and interpretation, while multi-sensor networks and cyber-physical systems ensure the reliability and accuracy of data. The maritime security operations market is a significant contributor to the maritime surveillance industry, with a focus on border security, coastal defense, and port security. Real-time data and threat analysis are essential for an effective response to potential security threats, while vessel tracking and AIS data provide valuable information for situational awareness.
Maritime traffic management is another key application of maritime surveillance, with the shipping industry relying on accurate and timely information for efficient operations and safety. Edge computing and big data analytics enable real-time processing of large volumes of data, providing valuable insights for maritime safety and operational efficiency. Illegal fishing and other forms of maritime crime are significant challenges in many regions, and maritime surveillance technologies play a crucial role in detecting and deterring these activities. Effective communication and information sharing between law enforcement agencies and other stakeholders are essential for effective enforcement and compliance with regulations.
Security protocols and risk assessment are critical components of maritime surveillance, ensuring the protection of critical infrastructure and assets. Threat analysis and ship detection capabilities are essential for identifying potential security threats and responding effectively to mitigate risks. The market is a dynamic and evolving industry, driven by the need for enhanced situational awareness, security, and safety in maritime domains. Integrated surveillance systems, communication and data sharing, AI and ML, and geospatial intelligence are key technologies driving innovation in this market. Effective collaboration between stakeholders and the adoption of advanced technologies will continue to shape the future of maritime surveillance.
|
Market Scope
|
|
Report Coverage
|
Details
|
|
Page number
|
241
|
|
Base year
|
2024
|
|
Historic period
|
2019-2023 |
|
Forecast period
|
2025-2029
|
|
Growth momentum & CAGR
|
Accelerate at a CAGR of 3.3%
|
|
Market growth 2025-2029
|
USD 1.39 billion
|
|
Market structure
|
Fragmented
|
|
YoY growth 2024-2025(%)
|
3.1
|
|
Key countries
|
US, China, Germany, UK, Canada, Japan, France, India, Italy, and South Korea
|
|
Competitive landscape
|
Leading Companies, Market Positioning of Companies, Competitive Strategies, and Industry Risks
|
Request Free Sample
What are the Key Data Covered in this Maritime Surveillance Market Research and Growth Report?
- CAGR of the Maritime Surveillance industry during the forecast period
- Detailed information on factors that will drive the growth and forecasting between 2025 and 2029
- Precise estimation of the size of the market and its contribution of the industry in focus to the parent market
- Accurate predictions about upcoming growth and trends and changes in consumer behaviour
- Growth of the market across North America, Europe, APAC, Middle East and Africa, and South America
- Thorough analysis of the market’s competitive landscape and detailed information about companies
- Comprehensive analysis of factors that will challenge the maritime surveillance market growth and forecasting market growth and forecasting
We can help! Our analysts can customize this maritime surveillance market research report to meet your requirements.
Get in touch
1 Executive Summary
- 1.1 Market overview
- Executive Summary - Chart on Market Overview
- Executive Summary - Data Table on Market Overview
- Executive Summary - Chart on Global Market Characteristics
- Executive Summary - Chart on Market by Geography
- Executive Summary - Chart on Market Segmentation by Component
- Executive Summary - Chart on Market Segmentation by End-user
- Executive Summary - Chart on Market Segmentation by Type
- Executive Summary - Chart on Incremental Growth
- Executive Summary - Data Table on Incremental Growth
- Executive Summary - Chart on Company Market Positioning
2 Technavio Analysis
- 2.1 Analysis of price sensitivity, lifecycle, customer purchase basket, adoption rates, and purchase criteria
- Analysis of price sensitivity, lifecycle, customer purchase basket, adoption rates, and purchase criteria
- 2.2 Criticality of inputs and Factors of differentiation
- Overview on criticality of inputs and factors of differentiation
- 2.3 Factors of disruption
- Overview on factors of disruption
- 2.4 Impact of drivers and challenges
- Impact of drivers and challenges in 2024 and 2029
3 Market Landscape
- 3.1 Market ecosystem
- Parent Market
- Data Table on - Parent Market
- 3.2 Market characteristics
- Market characteristics analysis
4 Market Sizing
- 4.1 Market definition
- Offerings of companies included in the market definition
- 4.2 Market segment analysis
- 4.4 Market outlook: Forecast for 2024-2029
- Chart on Global - Market size and forecast 2024-2029 ($ million)
- Data Table on Global - Market size and forecast 2024-2029 ($ million)
- Chart on Global Market: Year-over-year growth 2024-2029 (%)
- Data Table on Global Market: Year-over-year growth 2024-2029 (%)
5 Historic Market Size
- 5.1 Global Maritime Surveillance Market 2019 - 2023
- Historic Market Size - Data Table on Global Maritime Surveillance Market 2019 - 2023 ($ million)
- 5.2 Component segment analysis 2019 - 2023
- Historic Market Size - Component Segment 2019 - 2023 ($ million)
- 5.3 End-user segment analysis 2019 - 2023
- Historic Market Size - End-user Segment 2019 - 2023 ($ million)
- 5.4 Type segment analysis 2019 - 2023
- Historic Market Size - Type Segment 2019 - 2023 ($ million)
- 5.5 Geography segment analysis 2019 - 2023
- Historic Market Size - Geography Segment 2019 - 2023 ($ million)
- 5.6 Country segment analysis 2019 - 2023
- Historic Market Size - Country Segment 2019 - 2023 ($ million)
6 Qualitative Analysis
- 6.1 Impact of AI in global maritime surveillance market
7 Five Forces Analysis
- 7.1 Five forces summary
- Five forces analysis - Comparison between 2024 and 2029
- 7.2 Bargaining power of buyers
- Bargaining power of buyers - Impact of key factors 2024 and 2029
- 7.3 Bargaining power of suppliers
- Bargaining power of suppliers - Impact of key factors in 2024 and 2029
- 7.4 Threat of new entrants
- Threat of new entrants - Impact of key factors in 2024 and 2029
- 7.5 Threat of substitutes
- Threat of substitutes - Impact of key factors in 2024 and 2029
- 7.6 Threat of rivalry
- Threat of rivalry - Impact of key factors in 2024 and 2029
- 7.7 Market condition
- Chart on Market condition - Five forces 2024 and 2029
8 Market Segmentation by Component
- 8.1 Market segments
- Chart on Component - Market share 2024-2029 (%)
- Data Table on Component - Market share 2024-2029 (%)
- 8.2 Comparison by Component
- Chart on Comparison by Component
- Data Table on Comparison by Component
- 8.3 Sensors - Market size and forecast 2024-2029
- Chart on Sensors - Market size and forecast 2024-2029 ($ million)
- Data Table on Sensors - Market size and forecast 2024-2029 ($ million)
- Chart on Sensors - Year-over-year growth 2024-2029 (%)
- Data Table on Sensors - Year-over-year growth 2024-2029 (%)
- 8.4 Radar - Market size and forecast 2024-2029
- Chart on Radar - Market size and forecast 2024-2029 ($ million)
- Data Table on Radar - Market size and forecast 2024-2029 ($ million)
- Chart on Radar - Year-over-year growth 2024-2029 (%)
- Data Table on Radar - Year-over-year growth 2024-2029 (%)
- 8.5 AIS receiver - Market size and forecast 2024-2029
- Chart on AIS receiver - Market size and forecast 2024-2029 ($ million)
- Data Table on AIS receiver - Market size and forecast 2024-2029 ($ million)
- Chart on AIS receiver - Year-over-year growth 2024-2029 (%)
- Data Table on AIS receiver - Year-over-year growth 2024-2029 (%)
- 8.6 Others - Market size and forecast 2024-2029
- Chart on Others - Market size and forecast 2024-2029 ($ million)
- Data Table on Others - Market size and forecast 2024-2029 ($ million)
- Chart on Others - Year-over-year growth 2024-2029 (%)
- Data Table on Others - Year-over-year growth 2024-2029 (%)
- 8.7 Market opportunity by Component
- Market opportunity by Component ($ million)
- Data Table on Market opportunity by Component ($ million)
9 Market Segmentation by End-user
- 9.1 Market segments
- Chart on End-user - Market share 2024-2029 (%)
- Data Table on End-user - Market share 2024-2029 (%)
- 9.2 Comparison by End-user
- Chart on Comparison by End-user
- Data Table on Comparison by End-user
- 9.3 Defense - Market size and forecast 2024-2029
- Chart on Defense - Market size and forecast 2024-2029 ($ million)
- Data Table on Defense - Market size and forecast 2024-2029 ($ million)
- Chart on Defense - Year-over-year growth 2024-2029 (%)
- Data Table on Defense - Year-over-year growth 2024-2029 (%)
- 9.4 Customs - Market size and forecast 2024-2029
- Chart on Customs - Market size and forecast 2024-2029 ($ million)
- Data Table on Customs - Market size and forecast 2024-2029 ($ million)
- Chart on Customs - Year-over-year growth 2024-2029 (%)
- Data Table on Customs - Year-over-year growth 2024-2029 (%)
- 9.5 Fisheries - Market size and forecast 2024-2029
- Chart on Fisheries - Market size and forecast 2024-2029 ($ million)
- Data Table on Fisheries - Market size and forecast 2024-2029 ($ million)
- Chart on Fisheries - Year-over-year growth 2024-2029 (%)
- Data Table on Fisheries - Year-over-year growth 2024-2029 (%)
- 9.6 Intelligence - Market size and forecast 2024-2029
- Chart on Intelligence - Market size and forecast 2024-2029 ($ million)
- Data Table on Intelligence - Market size and forecast 2024-2029 ($ million)
- Chart on Intelligence - Year-over-year growth 2024-2029 (%)
- Data Table on Intelligence - Year-over-year growth 2024-2029 (%)
- 9.7 Others - Market size and forecast 2024-2029
- Chart on Others - Market size and forecast 2024-2029 ($ million)
- Data Table on Others - Market size and forecast 2024-2029 ($ million)
- Chart on Others - Year-over-year growth 2024-2029 (%)
- Data Table on Others - Year-over-year growth 2024-2029 (%)
- 9.8 Market opportunity by End-user
- Market opportunity by End-user ($ million)
- Data Table on Market opportunity by End-user ($ million)
10 Market Segmentation by Type
- 10.1 Market segments
- Chart on Type - Market share 2024-2029 (%)
- Data Table on Type - Market share 2024-2029 (%)
- 10.2 Comparison by Type
- Chart on Comparison by Type
- Data Table on Comparison by Type
- 10.3 Coastal surveillance - Market size and forecast 2024-2029
- Chart on Coastal surveillance - Market size and forecast 2024-2029 ($ million)
- Data Table on Coastal surveillance - Market size and forecast 2024-2029 ($ million)
- Chart on Coastal surveillance - Year-over-year growth 2024-2029 (%)
- Data Table on Coastal surveillance - Year-over-year growth 2024-2029 (%)
- 10.4 Port surveillance - Market size and forecast 2024-2029
- Chart on Port surveillance - Market size and forecast 2024-2029 ($ million)
- Data Table on Port surveillance - Market size and forecast 2024-2029 ($ million)
- Chart on Port surveillance - Year-over-year growth 2024-2029 (%)
- Data Table on Port surveillance - Year-over-year growth 2024-2029 (%)
- 10.5 Vessel tracking - Market size and forecast 2024-2029
- Chart on Vessel tracking - Market size and forecast 2024-2029 ($ million)
- Data Table on Vessel tracking - Market size and forecast 2024-2029 ($ million)
- Chart on Vessel tracking - Year-over-year growth 2024-2029 (%)
- Data Table on Vessel tracking - Year-over-year growth 2024-2029 (%)
- 10.6 Submarine surveillance - Market size and forecast 2024-2029
- Chart on Submarine surveillance - Market size and forecast 2024-2029 ($ million)
- Data Table on Submarine surveillance - Market size and forecast 2024-2029 ($ million)
- Chart on Submarine surveillance - Year-over-year growth 2024-2029 (%)
- Data Table on Submarine surveillance - Year-over-year growth 2024-2029 (%)
- 10.7 Market opportunity by Type
- Market opportunity by Type ($ million)
- Data Table on Market opportunity by Type ($ million)
11 Customer Landscape
- 11.1 Customer landscape overview
- Analysis of price sensitivity, lifecycle, customer purchase basket, adoption rates, and purchase criteria
12 Geographic Landscape
- 12.1 Geographic segmentation
- Chart on Market share by geography 2024-2029 (%)
- Data Table on Market share by geography 2024-2029 (%)
- 12.2 Geographic comparison
- Chart on Geographic comparison
- Data Table on Geographic comparison
- 12.3 North America - Market size and forecast 2024-2029
- Chart on North America - Market size and forecast 2024-2029 ($ million)
- Data Table on North America - Market size and forecast 2024-2029 ($ million)
- Chart on North America - Year-over-year growth 2024-2029 (%)
- Data Table on North America - Year-over-year growth 2024-2029 (%)
- 12.4 Europe - Market size and forecast 2024-2029
- Chart on Europe - Market size and forecast 2024-2029 ($ million)
- Data Table on Europe - Market size and forecast 2024-2029 ($ million)
- Chart on Europe - Year-over-year growth 2024-2029 (%)
- Data Table on Europe - Year-over-year growth 2024-2029 (%)
- 12.5 APAC - Market size and forecast 2024-2029
- Chart on APAC - Market size and forecast 2024-2029 ($ million)
- Data Table on APAC - Market size and forecast 2024-2029 ($ million)
- Chart on APAC - Year-over-year growth 2024-2029 (%)
- Data Table on APAC - Year-over-year growth 2024-2029 (%)
- 12.6 Middle East and Africa - Market size and forecast 2024-2029
- Chart on Middle East and Africa - Market size and forecast 2024-2029 ($ million)
- Data Table on Middle East and Africa - Market size and forecast 2024-2029 ($ million)
- Chart on Middle East and Africa - Year-over-year growth 2024-2029 (%)
- Data Table on Middle East and Africa - Year-over-year growth 2024-2029 (%)
- 12.7 South America - Market size and forecast 2024-2029
- Chart on South America - Market size and forecast 2024-2029 ($ million)
- Data Table on South America - Market size and forecast 2024-2029 ($ million)
- Chart on South America - Year-over-year growth 2024-2029 (%)
- Data Table on South America - Year-over-year growth 2024-2029 (%)
- 12.8 US - Market size and forecast 2024-2029
- Chart on US - Market size and forecast 2024-2029 ($ million)
- Data Table on US - Market size and forecast 2024-2029 ($ million)
- Chart on US - Year-over-year growth 2024-2029 (%)
- Data Table on US - Year-over-year growth 2024-2029 (%)
- 12.9 China - Market size and forecast 2024-2029
- Chart on China - Market size and forecast 2024-2029 ($ million)
- Data Table on China - Market size and forecast 2024-2029 ($ million)
- Chart on China - Year-over-year growth 2024-2029 (%)
- Data Table on China - Year-over-year growth 2024-2029 (%)
- 12.10 Germany - Market size and forecast 2024-2029
- Chart on Germany - Market size and forecast 2024-2029 ($ million)
- Data Table on Germany - Market size and forecast 2024-2029 ($ million)
- Chart on Germany - Year-over-year growth 2024-2029 (%)
- Data Table on Germany - Year-over-year growth 2024-2029 (%)
- 12.11 UK - Market size and forecast 2024-2029
- Chart on UK - Market size and forecast 2024-2029 ($ million)
- Data Table on UK - Market size and forecast 2024-2029 ($ million)
- Chart on UK - Year-over-year growth 2024-2029 (%)
- Data Table on UK - Year-over-year growth 2024-2029 (%)
- 12.12 Canada - Market size and forecast 2024-2029
- Chart on Canada - Market size and forecast 2024-2029 ($ million)
- Data Table on Canada - Market size and forecast 2024-2029 ($ million)
- Chart on Canada - Year-over-year growth 2024-2029 (%)
- Data Table on Canada - Year-over-year growth 2024-2029 (%)
- 12.13 Japan - Market size and forecast 2024-2029
- Chart on Japan - Market size and forecast 2024-2029 ($ million)
- Data Table on Japan - Market size and forecast 2024-2029 ($ million)
- Chart on Japan - Year-over-year growth 2024-2029 (%)
- Data Table on Japan - Year-over-year growth 2024-2029 (%)
- 12.14 France - Market size and forecast 2024-2029
- Chart on France - Market size and forecast 2024-2029 ($ million)
- Data Table on France - Market size and forecast 2024-2029 ($ million)
- Chart on France - Year-over-year growth 2024-2029 (%)
- Data Table on France - Year-over-year growth 2024-2029 (%)
- 12.15 India - Market size and forecast 2024-2029
- Chart on India - Market size and forecast 2024-2029 ($ million)
- Data Table on India - Market size and forecast 2024-2029 ($ million)
- Chart on India - Year-over-year growth 2024-2029 (%)
- Data Table on India - Year-over-year growth 2024-2029 (%)
- 12.16 Italy - Market size and forecast 2024-2029
- Chart on Italy - Market size and forecast 2024-2029 ($ million)
- Data Table on Italy - Market size and forecast 2024-2029 ($ million)
- Chart on Italy - Year-over-year growth 2024-2029 (%)
- Data Table on Italy - Year-over-year growth 2024-2029 (%)
- 12.17 South Korea - Market size and forecast 2024-2029
- Chart on South Korea - Market size and forecast 2024-2029 ($ million)
- Data Table on South Korea - Market size and forecast 2024-2029 ($ million)
- Chart on South Korea - Year-over-year growth 2024-2029 (%)
- Data Table on South Korea - Year-over-year growth 2024-2029 (%)
- 12.18 Market opportunity by geography
- Market opportunity by geography ($ million)
- Data Tables on Market opportunity by geography ($ million)
13 Drivers, Challenges, and Opportunity/Restraints
- 13.3 Impact of drivers and challenges
- Impact of drivers and challenges in 2024 and 2029
- 13.4 Market opportunities/restraints
14 Competitive Landscape
- 14.2 Competitive Landscape
- Overview on criticality of inputs and factors of differentiation
- 14.3 Landscape disruption
- Overview on factors of disruption
- 14.4 Industry risks
- Impact of key risks on business
15 Competitive Analysis
- 15.2 Company ranking index
- 15.3 Market positioning of companies
- Matrix on companies position and classification
- 15.4 Airbus SE
- Airbus SE - Overview
- Airbus SE - Business segments
- Airbus SE - Key news
- Airbus SE - Key offerings
- Airbus SE - Segment focus
- SWOT
- 15.5 BAE Systems Plc
- BAE Systems Plc - Overview
- BAE Systems Plc - Business segments
- BAE Systems Plc - Key news
- BAE Systems Plc - Key offerings
- BAE Systems Plc - Segment focus
- SWOT
- 15.6 Elbit Systems Ltd.
- Elbit Systems Ltd. - Overview
- Elbit Systems Ltd. - Product / Service
- Elbit Systems Ltd. - Key news
- Elbit Systems Ltd. - Key offerings
- SWOT
- 15.7 HENSOLDT AG
- HENSOLDT AG - Overview
- HENSOLDT AG - Business segments
- HENSOLDT AG - Key news
- HENSOLDT AG - Key offerings
- HENSOLDT AG - Segment focus
- SWOT
- 15.8 Honeywell International Inc.
- Honeywell International Inc. - Overview
- Honeywell International Inc. - Business segments
- Honeywell International Inc. - Key news
- Honeywell International Inc. - Key offerings
- Honeywell International Inc. - Segment focus
- SWOT
- 15.9 Kongsberg Gruppen ASA
- Kongsberg Gruppen ASA - Overview
- Kongsberg Gruppen ASA - Business segments
- Kongsberg Gruppen ASA - Key news
- Kongsberg Gruppen ASA - Key offerings
- Kongsberg Gruppen ASA - Segment focus
- SWOT
- 15.10 L3Harris Technologies Inc.
- L3Harris Technologies Inc. - Overview
- L3Harris Technologies Inc. - Business segments
- L3Harris Technologies Inc. - Key news
- L3Harris Technologies Inc. - Key offerings
- L3Harris Technologies Inc. - Segment focus
- SWOT
- 15.11 Lockheed Martin Corp.
- Lockheed Martin Corp. - Overview
- Lockheed Martin Corp. - Business segments
- Lockheed Martin Corp. - Key news
- Lockheed Martin Corp. - Key offerings
- Lockheed Martin Corp. - Segment focus
- SWOT
- 15.12 MIND TECHNOLOGY INC.
- MIND TECHNOLOGY INC. - Overview
- MIND TECHNOLOGY INC. - Product / Service
- MIND TECHNOLOGY INC. - Key offerings
- SWOT
- 15.13 Northrop Grumman Corp.
- Northrop Grumman Corp. - Overview
- Northrop Grumman Corp. - Business segments
- Northrop Grumman Corp. - Key news
- Northrop Grumman Corp. - Key offerings
- Northrop Grumman Corp. - Segment focus
- SWOT
- 15.14 RTX Corp.
- RTX Corp. - Overview
- RTX Corp. - Business segments
- RTX Corp. - Key news
- RTX Corp. - Key offerings
- RTX Corp. - Segment focus
- SWOT
- 15.15 Saab AB
- Saab AB - Overview
- Saab AB - Business segments
- Saab AB - Key news
- Saab AB - Key offerings
- Saab AB - Segment focus
- SWOT
- 15.16 Safran SA
- Safran SA - Overview
- Safran SA - Business segments
- Safran SA - Key news
- Safran SA - Key offerings
- Safran SA - Segment focus
- SWOT
- 15.17 Terma AS
- Terma AS - Overview
- Terma AS - Product / Service
- Terma AS - Key offerings
- SWOT
- 15.18 Thales Group
- Thales Group - Overview
- Thales Group - Business segments
- Thales Group - Key news
- Thales Group - Key offerings
- Thales Group - Segment focus
- SWOT
16 Appendix
- 16.2 Inclusions and exclusions checklist
- Inclusions checklist
- Exclusions checklist
- 16.3 Currency conversion rates for US$
- Currency conversion rates for US$
- 16.4 Research methodology
- 16.7 Validation techniques employed for market sizing
- Validation techniques employed for market sizing
- 16.9 360 degree market analysis
- 360 degree market analysis
- 16.10 List of abbreviations