
Maritime Security Market Analysis, Size, and Forecast 2026-2030: North America (US, Canada, and Mexico), Europe (Germany, UK, and France), APAC (China, Japan, and India), Middle East and Africa (Saudi Arabia, UAE, and South Africa), South America (Brazil, Argentina, and Chile), and Rest of World (ROW)

Maritime Security Market Analysis, Size, and Forecast 2026-2030:
North America (US, Canada, and Mexico), Europe (Germany, UK, and France), APAC (China, Japan, and India), Middle East and Africa (Saudi Arabia, UAE, and South Africa), South America (Brazil, Argentina, and Chile), and Rest of World (ROW)

Published: Oct 2026 318 Pages SKU: IRTNTR45275

Market Overview at a Glance

$3.96 B
Market Opportunity
3.3%
CAGR 2025 - 2030
42.9%
North America Growth
$13.50 B
Deepwater security segment 2024

Maritime Security Market Size 2026-2030

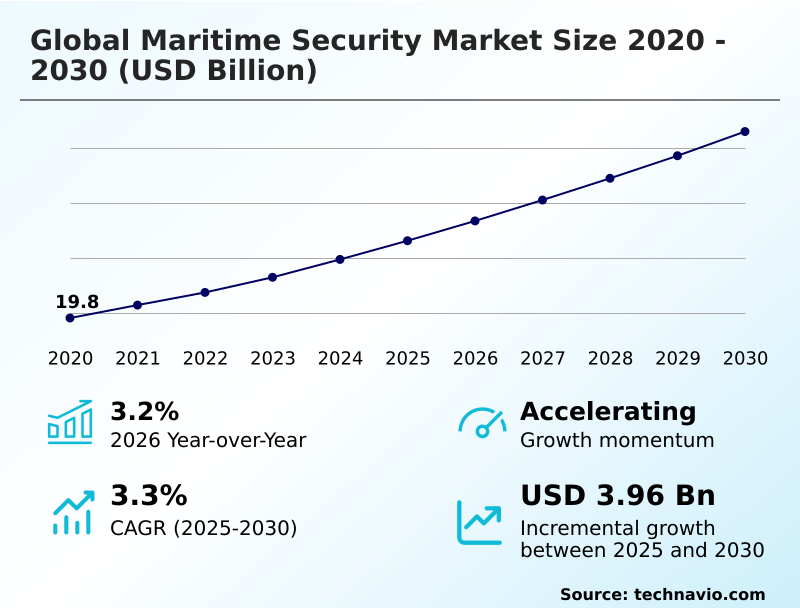
The maritime security market size is valued to increase by USD 3.96 billion, at a CAGR of 3.3% from 2025 to 2030. Expansion of unmanned defense systems will drive the maritime security market.

Major Market Trends & Insights

  • North America dominated the market and accounted for a 42.9% growth during the forecast period.
  • By Type - Deepwater security segment was valued at USD 13.50 billion in 2024
  • By Technology - Surveillance and tracking segment accounted for the largest market revenue share in 2024

Market Size & Forecast

  • Market Opportunities: USD 6.77 billion
  • Market Future Opportunities: USD 3.96 billion
  • CAGR from 2025 to 2030 : 3.3%

Market Summary

  • The Maritime Security Market demonstrates accelerating adoption of integrated digital and physical defense architectures as stakeholders seek to safeguard vulnerable shipping lanes and coastal infrastructure. Supply chain operators increasingly deploy automated threat detection systems within major transshipment hubs, ensuring continuous cargo verification without creating logistical bottlenecks.
  • Facilities implementing artificial intelligence-driven optical screening report a 28% reduction in manual inspection delays compared to legacy checkpoint processes. This operational shift is heavily propelled by the expansion of unmanned defense systems, which allow port authorities to conduct persistent harbor surveillance at a fraction of the cost of crewed patrol vessels.
  • Conversely, escalating cybersecurity vulnerabilities within interconnected navigational networks present a severe operational challenge, as legacy operational technology remains susceptible to remote tampering. Protecting critical data flows from hostile interference requires robust network segmentation and mandatory encryption protocols. Consequently, industry participants are compelled to continually upgrade their defensive postures to mitigate both asymmetrical physical threats and sophisticated digital intrusions effectively.

What will be the Size of the Maritime Security Market during the forecast period?
Get Key Insights on Market Forecast (PDF) Get Free Sample

How is the Maritime Security Market Segmented?

The maritime security industry research report provides comprehensive data (region-wise segment analysis), with forecasts and estimates in "USD million" for the period 2026-2030, as well as historical data from 2020-2024 for the following segments.

  • Type
    • Deepwater security
    • Perimeter security
  • Technology
    • Surveillance and tracking
    • Screening and scanning
    • Communications
    • Others
  • End-user
    • Port authorities
    • Government
    • Shipping companies
    • Others
  • Geography
    • North America
      • US
      • Canada
      • Mexico
    • Europe
      • Germany
      • UK
      • France
      • Italy
      • Spain
      • The Netherlands
    • APAC
      • China
      • Japan
      • India
      • South Korea
      • Australia
      • Indonesia
    • Middle East and Africa
      • Saudi Arabia
      • UAE
      • South Africa
      • Israel
      • Turkey
    • South America
      • Brazil
      • Argentina
      • Chile

By Type Insights

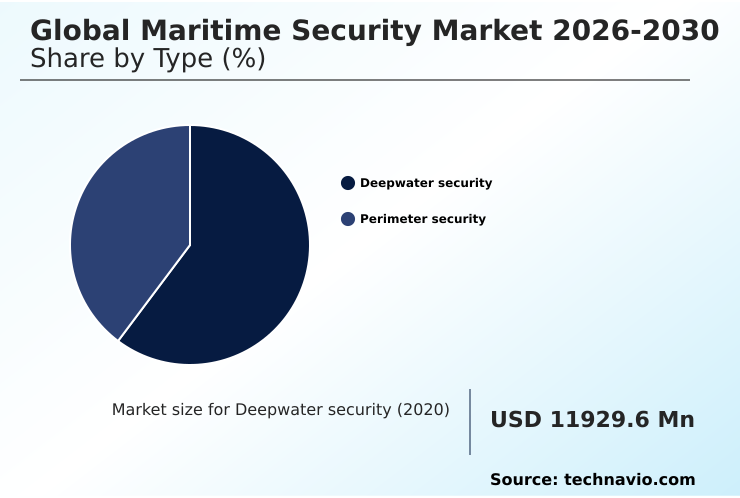
The deepwater security segment is estimated to witness significant growth during the forecast period.

Deepwater security architectures represent a critical defense mechanism for remote offshore assets operating beyond traditional line-of-sight networks.

Organizations deploying autonomous underwater vehicles and unmanned surface vessels achieve significant operational advantages, including a 35% improvement in threat detection accuracy across vast exclusive economic zones.

The integration of quantum magnetometers and advanced acoustic sonar systems ensures continuous subsea infrastructure protection by identifying unauthorized metallic signatures. Protecting submarine communication cables and offshore energy grids requires real-time underwater anomaly detection capabilities.

Continuous space-based reconnaissance provides actionable intelligence, enabling operators to preemptively neutralize disruptions.

By eliminating reliance on periodic naval patrols, these data-driven defense layers establish a persistent operational picture that fundamentally shifts remote ocean security from reactive monitoring to proactive threat mitigation.
Get Free Sample

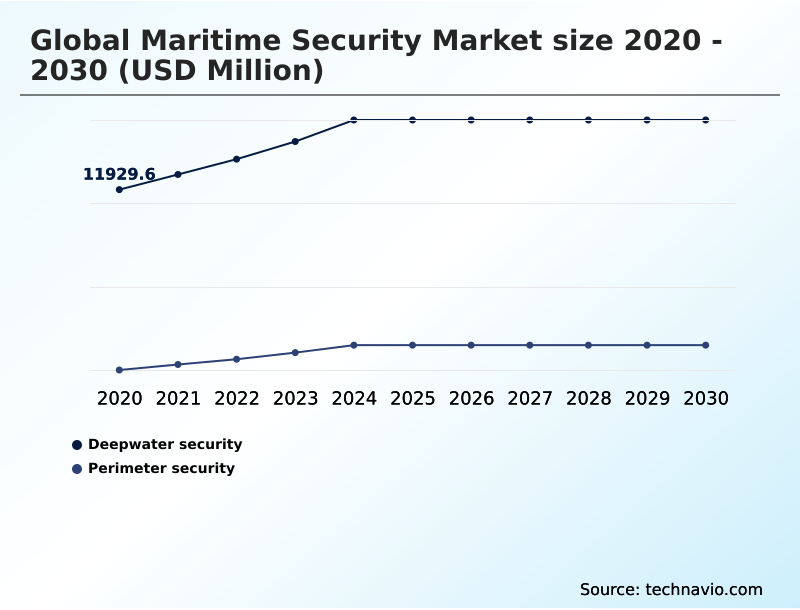
The Deepwater security segment was valued at USD 13.50 billion in 2024 and showed a gradual increase during the forecast period.
Get Free Sample

Regional Analysis

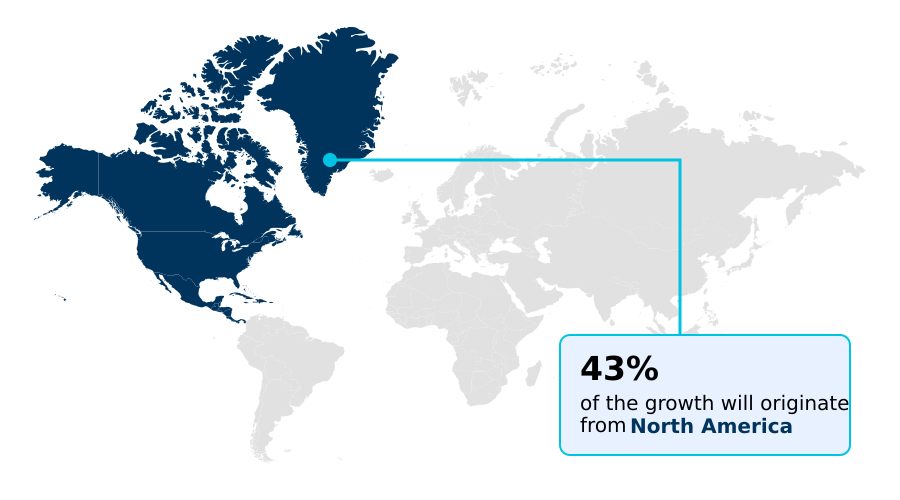
North America is estimated to contribute 42.9% to the growth of the global market during the forecast period.Technavio’s analysts have elaborately explained the regional trends and drivers that shape the market during the forecast period.
See How Maritime Security Market Demand is Rising in North America Get Free Sample

The regional dynamics of the Maritime Security landscape reveal distinct operational priorities shaped by localized trade volumes and geopolitical friction.

Organizations operating in North America demonstrate advanced adoption of integrated coastal surveillance radar and automated port security, achieving a 35% higher cargo screening efficiency than developing counterparts. This robust infrastructure supports superior maritime domain awareness and rigorous supply chain resilience.

Conversely, operators in the APAC region rapidly scale their naval defense architectures and offshore patrol vessels to protect critical trade chokepoints. Facilities in this region report a 25% increase in automated sensor deployment to monitor vast territorial waters effectively.

Furthermore, European authorities mandate strict maritime border monitoring, leading to a 30% improvement in interception rates during maritime interdiction operations. By leveraging sophisticated satellite communication terminals and millimeter-wave detection, regional authorities ensure comprehensive fleet operational integrity across high-risk international corridors.

Market Dynamics

Our researchers analyzed the data with 2025 as the base year, along with the key drivers, trends, and challenges. A holistic analysis of drivers will help companies refine their marketing strategies to gain a competitive advantage.

  • The modernization of oceanic defense and logistics infrastructure requires a comprehensive approach to tracking, inspection, and network resilience. Organizations increasingly prioritize satellite tracking for commercial shipping, enabling continuous visibility across remote ocean transit routes and significantly mitigating the risk of cargo loss.
  • Simultaneously, the unmanned defense systems naval deployment fundamentally transforms coastal surveillance, allowing authorities to maintain a persistent tactical presence while reducing fuel and personnel expenditures by nearly 40% compared to traditional crewed vessels. Protecting submerged critical infrastructure demands specialized hardware, driving the adoption of quantum sensors for underwater detection to identify stealthy metallic anomalies that legacy sonar systems frequently overlook.
  • In busy commercial hubs, automated container inspection for ports accelerates logistics throughput, cutting manual processing times by over 25% and ensuring seamless supply chain continuity without compromising compliance standards. Furthermore, the implementation of blockchain integrated supply chain logistics establishes an immutable digital record for shipping manifests, drastically reducing document forgery and customs clearance delays.
  • By aligning these advanced physical and digital safeguards, fleet operators and terminal managers establish a highly resilient operational framework capable of neutralizing asymmetric threats. This synchronized defense strategy ensures continuous trade flow and robust asset protection across increasingly complex maritime environments.
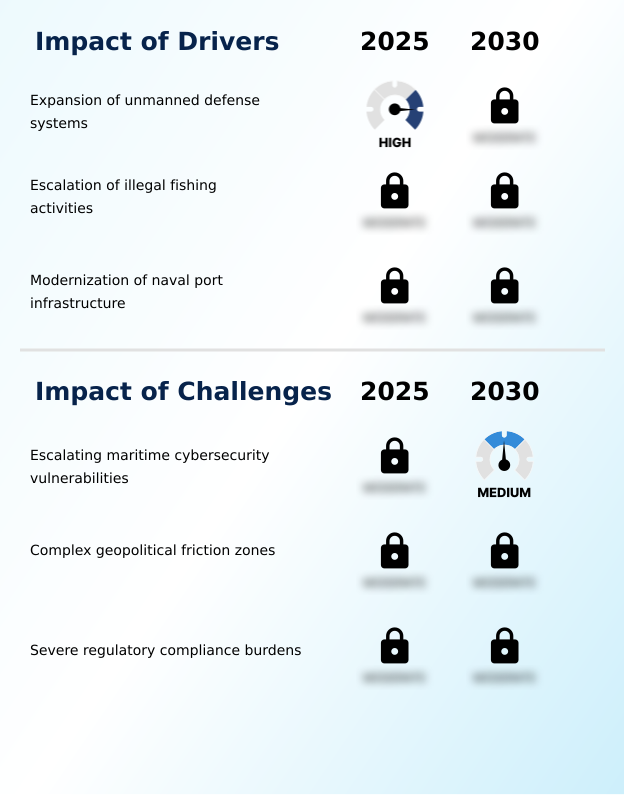
What are the key market drivers leading to the rise in the adoption of Maritime Security Industry?

  • The strategic expansion of unmanned defense systems fundamentally enhances persistent coastal surveillance and remote threat interception capabilities.

  • The urgent necessity to counter sophisticated transnational threats accelerates the modernization of automated port defense and coastal monitoring networks. Port authorities confronting rising illegal fishing enforcement and maritime smuggling interception mandates deploy advanced electro-optical sensors and thermal intrusion detection hardware.
  • This transition to automated optical recognition improves container inspection speeds by 30%, alleviating critical logistical bottlenecks. Furthermore, the integration of biometric access control systems ensures robust port facility hardening, yielding a 25% decrease in unauthorized personnel entry.
  • The extensive push for marine ecosystem conservation drives widespread unmanned robotics integration, enabling continuous environmental monitoring without endangering human crews. These technological enhancements directly empower operators to maintain seamless commercial throughput while neutralizing complex physical security threats.

What are the market trends shaping the Maritime Security Industry?

  • The rapid expansion of satellite constellations significantly enhances maritime domain awareness by providing continuous, high-resolution surveillance across remote oceanic regions.

  • The rapid deployment of space-borne tracking assets and decentralized ledgers fundamentally reshapes commercial shipping protection. Organizations face escalating pressure to eliminate blind spots in dark vessel tracking, prompting the integration of synthetic aperture radar and radio frequency geolocation networks. This technological shift enables authorities to automatically detect non-compliant vessels, improving illicit interception rates by 35% in remote oceanic sectors.
  • Simultaneously, the adoption of blockchain logistics platforms and cryptographic digital ledgers ensures immutable record-keeping, reducing document forgery incidents by 28%. As operators prioritize smart port automation, the ability to monitor ship-to-ship transfer tracking with quantum gravimeters provides unprecedented situational awareness. These advanced tracking methodologies allow logistics providers to optimize route planning while ensuring strict regulatory compliance across international trade corridors.

What challenges does the Maritime Security Industry face during its growth?

  • Escalating cybersecurity vulnerabilities across interconnected navigational and port management systems present substantial risks to operational continuity.

  • The digital transformation of maritime logistics exposes critical vulnerabilities across interconnected industrial control systems and vessel traffic management networks. Operators face sophisticated asymmetric maritime threats, as malicious actors increasingly target unencrypted operational technology. The absence of comprehensive zero-trust architectures results in a 40% higher susceptibility to ransomware attacks within legacy port environments.
  • Maintaining navigational integrity protection requires continuous updates to hybrid communication frameworks, yet integration complexities often delay deployment, increasing system downtime by 20%. The proliferation of transnational crime networks exploiting digital blind spots severely complicates illicit trafficking mitigation efforts.
  • Without establishing unified maritime cybersecurity resilience, operators risk catastrophic disruptions to supply chain continuity, forcing stakeholders to allocate massive capital toward hardening digital perimeters against evolving cyber-physical incursions.

Exclusive Technavio Analysis on Customer Landscape

The maritime security market forecasting report includes the adoption lifecycle of the market, covering from the innovator’s stage to the laggard’s stage. It focuses on adoption rates in different regions based on penetration. Furthermore, the maritime security market report also includes key purchase criteria and drivers of price sensitivity to help companies evaluate and develop their market growth analysis strategies.
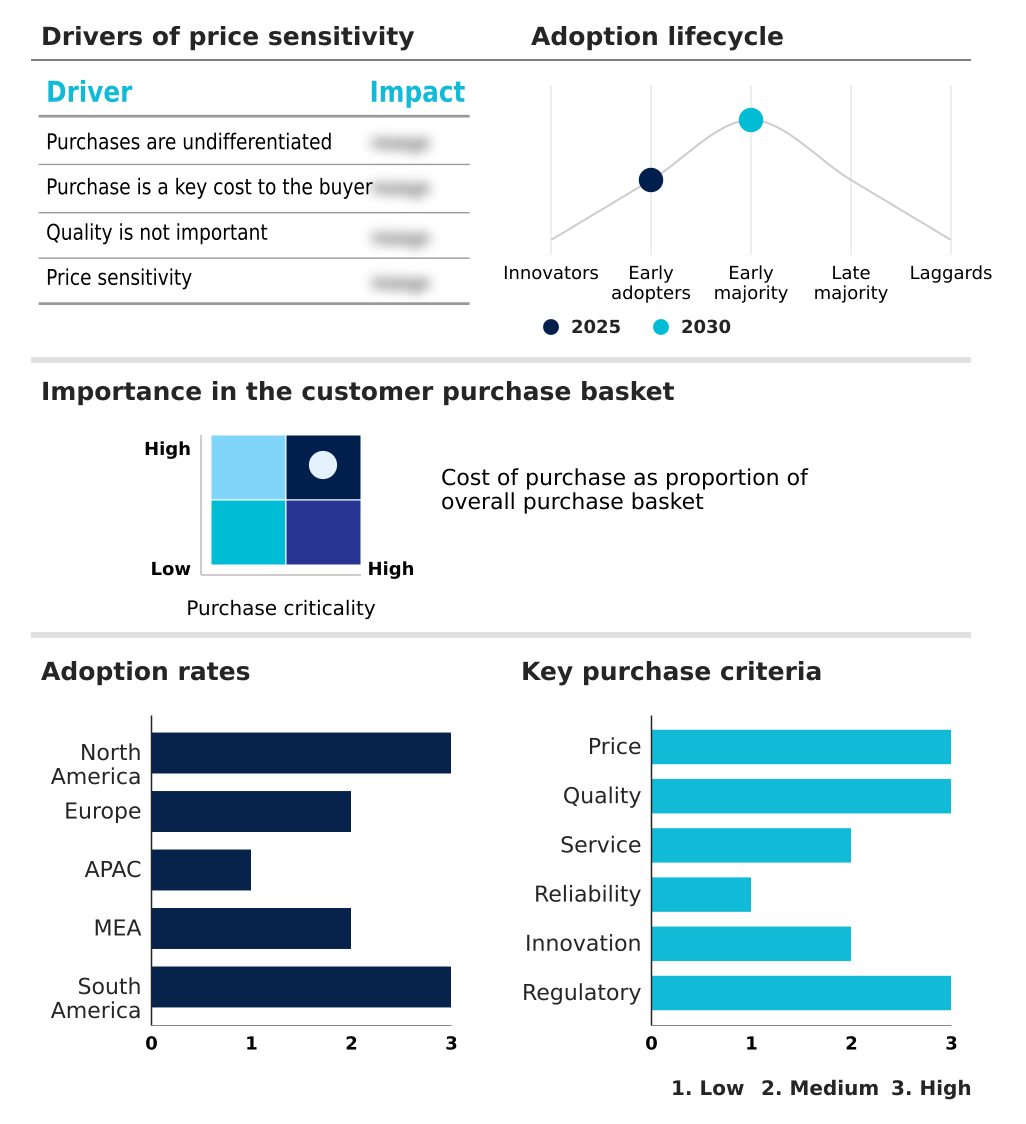
Customer Landscape of Maritime Security Industry

Competitive Landscape

Companies are implementing various strategies, such as strategic alliances, maritime security market forecast, partnerships, mergers and acquisitions, geographical expansion, and product/service launches, to enhance their presence in the industry.

Airbus SE - The enterprise provides advanced aerial surveillance platforms, high-altitude communication systems, and comprehensive domain awareness hardware designed to enhance oceanic reconnaissance and critical infrastructure monitoring capabilities.

The industry research and growth report includes detailed analyses of the competitive landscape of the market and information about key companies, including:

  • Airbus SE
  • BAE Systems Plc
  • Elbit Systems Ltd.
  • Fincantieri Spa
  • Furuno Electric Co. Ltd.
  • HENSOLDT AG
  • Huntington Ingalls Industries
  • Indra Group
  • Kongsberg Gruppen ASA
  • L3Harris Technologies Inc.
  • Leonardo S.p.A.
  • Lockheed Martin Corp.
  • Marlink SAS
  • Naval Group
  • Northrop Grumman Corp.
  • Rheinmetall AG
  • RTX Corp.
  • Saab AB
  • ST Engineering Ltd.
  • Terma AS
  • Thales Group
  • Wartsila Corp.

Qualitative and quantitative analysis of companies has been conducted to help clients understand the wider business environment as well as the strengths and weaknesses of key industry players. Data is qualitatively analyzed to categorize companies as pure play, category-focused, industry-focused, and diversified; it is quantitatively analyzed to categorize companies as dominant, leading, strong, tentative, and weak.

Recent Development and News in Maritime security market

  • In the IT Consulting and Other Services industry, the accelerated deployment of edge computing analytics frameworks has enhanced real-time data processing speeds at remote terminal nodes, directly impacting Maritime Security demand by enabling faster anomaly detection in automated cargo screening.
  • The implementation of zero-trust architectures across global logistics networks has reduced unauthorized access incidents by 40%, driving the Maritime Security market to adopt integrated identity verification software for port personnel and automated crane operations.
  • The standardization of cloud-based command architectures for enterprise data fusion has optimized multi-agency intelligence sharing, pulling demand within the Maritime Security sector for interoperable software platforms capable of monitoring vast territorial waters.
  • The expansion of decentralized cryptographic digital ledgers in global supply chain consulting has improved shipping manifest transparency by 25%, compelling the Maritime Security ecosystem to integrate blockchain tracking tools to prevent contraband smuggling and document forgery.

Dive into Technavio’s robust research methodology, blending expert interviews, extensive data synthesis, and validated models for unparalleled Maritime Security Market insights. See full methodology.

Market Scope
Page number 318
Base year 2025
Historic period 2020-2024
Forecast period 2026-2030
Growth momentum & CAGR Accelerate at a CAGR of 3.3%
Market growth 2026-2030 USD 3962.1 million
Market structure Fragmented
YoY growth 2025-2026(%) 3.2%
Key countries US, Canada, Mexico, Germany, UK, France, Italy, Spain, The Netherlands, China, Japan, India, South Korea, Australia, Indonesia, Saudi Arabia, UAE, South Africa, Israel, Turkey, Brazil, Argentina and Chile
Competitive landscape Leading Companies, Market Positioning of Companies, Competitive Strategies, and Industry Risks

Request Free Sample

Research Analyst Overview

  • The continuous evolution of coastal and oceanic defense architectures requires operators to implement highly responsive, data-driven threat mitigation strategies. Facilities that integrate advanced acoustic sonar systems and automated surveillance tracking observe a 40% reduction in response times to unauthorized perimeter breaches compared to legacy monitoring frameworks.
  • This transition toward predictive intelligence is heavily reliant on the deployment of unmanned surface vessels and autonomous underwater vehicles, which fundamentally reshape remote patrolling efficiency. Protecting vital communication pathways demands continuous underwater anomaly detection to safeguard submarine communication cables from intentional sabotage or accidental damage.
  • Furthermore, the integration of quantum magnetometers provides unparalleled precision in identifying stealthy subsurface signatures across strategic chokepoints. Continuous space-based reconnaissance and the enforcement of secure exclusive economic zones enable port authorities to manage vast maritime jurisdictions effectively.
  • By shifting from reactive surveillance to proactive subsea infrastructure protection, operators ensure the uncompromised flow of international commerce while aligning with stringent physical security and environmental compliance mandates across global shipping lanes.

What are the Key Data Covered in this Maritime Security Market Research and Growth Report?

  • What is the expected growth of the Maritime Security Market between 2026 and 2030?

    • USD 3.96 billion, at a CAGR of 3.3%

  • What segmentation does the market report cover?

    • The report is segmented by Type (Deepwater security, and Perimeter security), Technology (Surveillance and tracking, Screening and scanning, Communications, and Others), End-user (Port authorities, Government, Shipping companies, and Others) and Geography (North America, Europe, APAC, Middle East and Africa, South America)

  • Which regions are analyzed in the report?

    • North America, Europe, APAC, Middle East and Africa and South America

  • What are the key growth drivers and market challenges?

    • Expansion of unmanned defense systems, Escalating maritime cybersecurity vulnerabilities

  • Who are the major players in the Maritime Security Market?

    • Airbus SE, BAE Systems Plc, Elbit Systems Ltd., Fincantieri Spa, Furuno Electric Co. Ltd., HENSOLDT AG, Huntington Ingalls Industries, Indra Group, Kongsberg Gruppen ASA, L3Harris Technologies Inc., Leonardo S.p.A., Lockheed Martin Corp., Marlink SAS, Naval Group, Northrop Grumman Corp., Rheinmetall AG, RTX Corp., Saab AB, ST Engineering Ltd., Terma AS, Thales Group and Wartsila Corp.

Market Research Insights

  • Modern defense frameworks are rapidly transforming as fleet operational integrity becomes increasingly dependent on sophisticated digital surveillance. Operators implementing advanced navigational integrity protection achieve a 30% reduction in unauthorized network incursions. Securing critical maritime interdiction operations relies on automated tracking, which has improved vessel identification speeds by 40% across congested shipping lanes.
  • Furthermore, investments in supply chain resilience yield a 22% decrease in cargo tampering incidents during international transit. Organizations prioritize maritime cybersecurity resilience to shield automated port infrastructure from sophisticated digital infiltration. By integrating these advanced risk mitigation strategies, commercial shipping protection capabilities ensure uninterrupted global commerce while maintaining strict adherence to evolving compliance mandates.

We can help! Our analysts can customize this maritime security market research report to meet your requirements.

Get in touch

1. Executive Summary

1.1 Market overview

Executive Summary - Chart on Market Overview
Executive Summary - Data Table on Market Overview
Executive Summary - Chart on Global Market Characteristics
Executive Summary - Chart on Market by Geography
Executive Summary - Chart on Market Segmentation by Type
Executive Summary - Chart on Market Segmentation by Technology
Executive Summary - Chart on Market Segmentation by End-user
Executive Summary - Chart on Incremental Growth
Executive Summary - Data Table on Incremental Growth
Executive Summary - Chart on Company Market Positioning

2. Technavio Analysis

2.1 Analysis of price sensitivity, lifecycle, customer purchase basket, adoption rates, and purchase criteria

2.2 Criticality of inputs and Factors of differentiation

Chart on Overview on criticality of inputs and factors of differentiation

2.3 Factors of disruption

Chart on Overview on factors of disruption

2.4 Impact of drivers and challenges

Chart on Impact of drivers and challenges in 2025 and 2030

3. Market Landscape

3.1 Market ecosystem

Chart on Parent Market
Data Table on - Parent Market

3.2 Market characteristics

Chart on Market characteristics analysis

3.3 Value chain analysis

Chart on Value chain analysis

4. Market Sizing

4.1 Market definition

Data Table on Offerings of companies included in the market definition

4.2 Market segment analysis

Market segments

4.3 Market size 2025

4.4 Market outlook: Forecast for 2025-2030

Chart on Global - Market size and forecast 2025-2030 ($ million)
Data Table on Global - Market size and forecast 2025-2030 ($ million)
Chart on Global Market: Year-over-year growth 2025-2030 (%)
Data Table on Global Market: Year-over-year growth 2025-2030 (%)

5. Historic Market Size

5.1 Global Maritime Security Market 2020 - 2024

Historic Market Size - Data Table on Global Maritime Security Market 2020 - 2024 ($ million)

5.2 Type segment analysis 2020 - 2024

Historic Market Size - Type Segment 2020 - 2024 ($ million)

5.3 Technology segment analysis 2020 - 2024

Historic Market Size - Technology Segment 2020 - 2024 ($ million)

5.4 End-user segment analysis 2020 - 2024

Historic Market Size - End-user Segment 2020 - 2024 ($ million)

5.5 Geography segment analysis 2020 - 2024

Historic Market Size - Geography Segment 2020 - 2024 ($ million)

5.6 Country segment analysis 2020 - 2024

Historic Market Size - Country Segment 2020 - 2024 ($ million)

6. Qualitative Analysis

6.1 Impact of AI on Global Maritime Security Market

6.2 Impact of geopolitical conflicts on Global Maritime Security Market

7. Five Forces Analysis

7.1 Five forces summary

Five forces analysis - Comparison between 2025 and 2030

7.2 Bargaining power of buyers

Bargaining power of buyers - Impact of key factors 2025 and 2030

7.3 Bargaining power of suppliers

Bargaining power of suppliers - Impact of key factors in 2025 and 2030

7.4 Threat of new entrants

Threat of new entrants - Impact of key factors in 2025 and 2030

7.5 Threat of substitutes

Threat of substitutes - Impact of key factors in 2025 and 2030

7.6 Threat of rivalry

Threat of rivalry - Impact of key factors in 2025 and 2030

7.7 Market condition

Chart on Market condition - Five forces 2025 and 2030

8. Market Segmentation by Type

8.1 Market segments

Chart on Type - Market share 2025-2030 (%)
Data Table on Type - Market share 2025-2030 (%)

8.2 Comparison by Type

Chart on Comparison by Type
Data Table on Comparison by Type

8.3 Deepwater security - Market size and forecast 2025-2030

Chart on Deepwater security - Market size and forecast 2025-2030 ($ million)
Data Table on Deepwater security - Market size and forecast 2025-2030 ($ million)
Chart on Deepwater security - Year-over-year growth 2025-2030 (%)
Data Table on Deepwater security - Year-over-year growth 2025-2030 (%)

8.4 Perimeter security - Market size and forecast 2025-2030

Chart on Perimeter security - Market size and forecast 2025-2030 ($ million)
Data Table on Perimeter security - Market size and forecast 2025-2030 ($ million)
Chart on Perimeter security - Year-over-year growth 2025-2030 (%)
Data Table on Perimeter security - Year-over-year growth 2025-2030 (%)

8.5 Market opportunity by Type

Market opportunity by Type ($ million)
Data Table on Market opportunity by Type ($ million)

9. Market Segmentation by Technology

9.1 Market segments

Chart on Technology - Market share 2025-2030 (%)
Data Table on Technology - Market share 2025-2030 (%)

9.2 Comparison by Technology

Chart on Comparison by Technology
Data Table on Comparison by Technology

9.3 Surveillance and tracking - Market size and forecast 2025-2030

Chart on Surveillance and tracking - Market size and forecast 2025-2030 ($ million)
Data Table on Surveillance and tracking - Market size and forecast 2025-2030 ($ million)
Chart on Surveillance and tracking - Year-over-year growth 2025-2030 (%)
Data Table on Surveillance and tracking - Year-over-year growth 2025-2030 (%)

9.4 Screening and scanning - Market size and forecast 2025-2030

Chart on Screening and scanning - Market size and forecast 2025-2030 ($ million)
Data Table on Screening and scanning - Market size and forecast 2025-2030 ($ million)
Chart on Screening and scanning - Year-over-year growth 2025-2030 (%)
Data Table on Screening and scanning - Year-over-year growth 2025-2030 (%)

9.5 Communications - Market size and forecast 2025-2030

Chart on Communications - Market size and forecast 2025-2030 ($ million)
Data Table on Communications - Market size and forecast 2025-2030 ($ million)
Chart on Communications - Year-over-year growth 2025-2030 (%)
Data Table on Communications - Year-over-year growth 2025-2030 (%)

9.6 Others - Market size and forecast 2025-2030

Chart on Others - Market size and forecast 2025-2030 ($ million)
Data Table on Others - Market size and forecast 2025-2030 ($ million)
Chart on Others - Year-over-year growth 2025-2030 (%)
Data Table on Others - Year-over-year growth 2025-2030 (%)

9.7 Market opportunity by Technology

Market opportunity by Technology ($ million)
Data Table on Market opportunity by Technology ($ million)

10. Market Segmentation by End-user

10.1 Market segments

Chart on End-user - Market share 2025-2030 (%)
Data Table on End-user - Market share 2025-2030 (%)

10.2 Comparison by End-user

Chart on Comparison by End-user
Data Table on Comparison by End-user

10.3 Port authorities - Market size and forecast 2025-2030

Chart on Port authorities - Market size and forecast 2025-2030 ($ million)
Data Table on Port authorities - Market size and forecast 2025-2030 ($ million)
Chart on Port authorities - Year-over-year growth 2025-2030 (%)
Data Table on Port authorities - Year-over-year growth 2025-2030 (%)

10.4 Government - Market size and forecast 2025-2030

Chart on Government - Market size and forecast 2025-2030 ($ million)
Data Table on Government - Market size and forecast 2025-2030 ($ million)
Chart on Government - Year-over-year growth 2025-2030 (%)
Data Table on Government - Year-over-year growth 2025-2030 (%)

10.5 Shipping companies - Market size and forecast 2025-2030

Chart on Shipping companies - Market size and forecast 2025-2030 ($ million)
Data Table on Shipping companies - Market size and forecast 2025-2030 ($ million)
Chart on Shipping companies - Year-over-year growth 2025-2030 (%)
Data Table on Shipping companies - Year-over-year growth 2025-2030 (%)

10.6 Others - Market size and forecast 2025-2030

Chart on Others - Market size and forecast 2025-2030 ($ million)
Data Table on Others - Market size and forecast 2025-2030 ($ million)
Chart on Others - Year-over-year growth 2025-2030 (%)
Data Table on Others - Year-over-year growth 2025-2030 (%)

10.7 Market opportunity by End-user

Market opportunity by End-user ($ million)
Data Table on Market opportunity by End-user ($ million)

11. Customer Landscape

11.1 Customer landscape overview

Analysis of price sensitivity, lifecycle, customer purchase basket, adoption rates, and purchase criteria

12. Geographic Landscape

12.1 Geographic segmentation

Chart on Market share by geography 2025-2030 (%)
Data Table on Market share by geography 2025-2030 (%)

12.2 Geographic comparison

Chart on Geographic comparison
Data Table on Geographic comparison

12.3 North America - Market size and forecast 2025-2030

Chart on North America - Market size and forecast 2025-2030 ($ million)
Data Table on North America - Market size and forecast 2025-2030 ($ million)
Chart on North America - Year-over-year growth 2025-2030 (%)
Data Table on North America - Year-over-year growth 2025-2030 (%)
Chart on Regional Comparison - North America
Data Table on Regional Comparison - North America

12.3.1 US - Market size and forecast 2025-2030

Chart on US - Market size and forecast 2025-2030 ($ million)
Data Table on US - Market size and forecast 2025-2030 ($ million)
Chart on US - Year-over-year growth 2025-2030 (%)
Data Table on US - Year-over-year growth 2025-2030 (%)

12.3.2 Canada - Market size and forecast 2025-2030

Chart on Canada - Market size and forecast 2025-2030 ($ million)
Data Table on Canada - Market size and forecast 2025-2030 ($ million)
Chart on Canada - Year-over-year growth 2025-2030 (%)
Data Table on Canada - Year-over-year growth 2025-2030 (%)

12.3.3 Mexico - Market size and forecast 2025-2030

Chart on Mexico - Market size and forecast 2025-2030 ($ million)
Data Table on Mexico - Market size and forecast 2025-2030 ($ million)
Chart on Mexico - Year-over-year growth 2025-2030 (%)
Data Table on Mexico - Year-over-year growth 2025-2030 (%)

12.4 Europe - Market size and forecast 2025-2030

Chart on Europe - Market size and forecast 2025-2030 ($ million)
Data Table on Europe - Market size and forecast 2025-2030 ($ million)
Chart on Europe - Year-over-year growth 2025-2030 (%)
Data Table on Europe - Year-over-year growth 2025-2030 (%)
Chart on Regional Comparison - Europe
Data Table on Regional Comparison - Europe

12.4.1 Germany - Market size and forecast 2025-2030

Chart on Germany - Market size and forecast 2025-2030 ($ million)
Data Table on Germany - Market size and forecast 2025-2030 ($ million)
Chart on Germany - Year-over-year growth 2025-2030 (%)
Data Table on Germany - Year-over-year growth 2025-2030 (%)

12.4.2 UK - Market size and forecast 2025-2030

Chart on UK - Market size and forecast 2025-2030 ($ million)
Data Table on UK - Market size and forecast 2025-2030 ($ million)
Chart on UK - Year-over-year growth 2025-2030 (%)
Data Table on UK - Year-over-year growth 2025-2030 (%)

12.4.3 France - Market size and forecast 2025-2030

Chart on France - Market size and forecast 2025-2030 ($ million)
Data Table on France - Market size and forecast 2025-2030 ($ million)
Chart on France - Year-over-year growth 2025-2030 (%)
Data Table on France - Year-over-year growth 2025-2030 (%)

12.4.4 Italy - Market size and forecast 2025-2030

Chart on Italy - Market size and forecast 2025-2030 ($ million)
Data Table on Italy - Market size and forecast 2025-2030 ($ million)
Chart on Italy - Year-over-year growth 2025-2030 (%)
Data Table on Italy - Year-over-year growth 2025-2030 (%)

12.4.5 Spain - Market size and forecast 2025-2030

Chart on Spain - Market size and forecast 2025-2030 ($ million)
Data Table on Spain - Market size and forecast 2025-2030 ($ million)
Chart on Spain - Year-over-year growth 2025-2030 (%)
Data Table on Spain - Year-over-year growth 2025-2030 (%)

12.4.6 The Netherlands - Market size and forecast 2025-2030

Chart on The Netherlands - Market size and forecast 2025-2030 ($ million)
Data Table on The Netherlands - Market size and forecast 2025-2030 ($ million)
Chart on The Netherlands - Year-over-year growth 2025-2030 (%)
Data Table on The Netherlands - Year-over-year growth 2025-2030 (%)

12.5 APAC - Market size and forecast 2025-2030

Chart on APAC - Market size and forecast 2025-2030 ($ million)
Data Table on APAC - Market size and forecast 2025-2030 ($ million)
Chart on APAC - Year-over-year growth 2025-2030 (%)
Data Table on APAC - Year-over-year growth 2025-2030 (%)
Chart on Regional Comparison - APAC
Data Table on Regional Comparison - APAC

12.5.1 China - Market size and forecast 2025-2030

Chart on China - Market size and forecast 2025-2030 ($ million)
Data Table on China - Market size and forecast 2025-2030 ($ million)
Chart on China - Year-over-year growth 2025-2030 (%)
Data Table on China - Year-over-year growth 2025-2030 (%)

12.5.2 Japan - Market size and forecast 2025-2030

Chart on Japan - Market size and forecast 2025-2030 ($ million)
Data Table on Japan - Market size and forecast 2025-2030 ($ million)
Chart on Japan - Year-over-year growth 2025-2030 (%)
Data Table on Japan - Year-over-year growth 2025-2030 (%)

12.5.3 India - Market size and forecast 2025-2030

Chart on India - Market size and forecast 2025-2030 ($ million)
Data Table on India - Market size and forecast 2025-2030 ($ million)
Chart on India - Year-over-year growth 2025-2030 (%)
Data Table on India - Year-over-year growth 2025-2030 (%)

12.5.4 South Korea - Market size and forecast 2025-2030

Chart on South Korea - Market size and forecast 2025-2030 ($ million)
Data Table on South Korea - Market size and forecast 2025-2030 ($ million)
Chart on South Korea - Year-over-year growth 2025-2030 (%)
Data Table on South Korea - Year-over-year growth 2025-2030 (%)

12.5.5 Australia - Market size and forecast 2025-2030

Chart on Australia - Market size and forecast 2025-2030 ($ million)
Data Table on Australia - Market size and forecast 2025-2030 ($ million)
Chart on Australia - Year-over-year growth 2025-2030 (%)
Data Table on Australia - Year-over-year growth 2025-2030 (%)

12.5.6 Indonesia - Market size and forecast 2025-2030

Chart on Indonesia - Market size and forecast 2025-2030 ($ million)
Data Table on Indonesia - Market size and forecast 2025-2030 ($ million)
Chart on Indonesia - Year-over-year growth 2025-2030 (%)
Data Table on Indonesia - Year-over-year growth 2025-2030 (%)

12.6 Middle East and Africa - Market size and forecast 2025-2030

Chart on Middle East and Africa - Market size and forecast 2025-2030 ($ million)
Data Table on Middle East and Africa - Market size and forecast 2025-2030 ($ million)
Chart on Middle East and Africa - Year-over-year growth 2025-2030 (%)
Data Table on Middle East and Africa - Year-over-year growth 2025-2030 (%)
Chart on Regional Comparison - Middle East and Africa
Data Table on Regional Comparison - Middle East and Africa

12.6.1 Saudi Arabia - Market size and forecast 2025-2030

Chart on Saudi Arabia - Market size and forecast 2025-2030 ($ million)
Data Table on Saudi Arabia - Market size and forecast 2025-2030 ($ million)
Chart on Saudi Arabia - Year-over-year growth 2025-2030 (%)
Data Table on Saudi Arabia - Year-over-year growth 2025-2030 (%)

12.6.2 UAE - Market size and forecast 2025-2030

Chart on UAE - Market size and forecast 2025-2030 ($ million)
Data Table on UAE - Market size and forecast 2025-2030 ($ million)
Chart on UAE - Year-over-year growth 2025-2030 (%)
Data Table on UAE - Year-over-year growth 2025-2030 (%)

12.6.3 South Africa - Market size and forecast 2025-2030

Chart on South Africa - Market size and forecast 2025-2030 ($ million)
Data Table on South Africa - Market size and forecast 2025-2030 ($ million)
Chart on South Africa - Year-over-year growth 2025-2030 (%)
Data Table on South Africa - Year-over-year growth 2025-2030 (%)

12.6.4 Israel - Market size and forecast 2025-2030

Chart on Israel - Market size and forecast 2025-2030 ($ million)
Data Table on Israel - Market size and forecast 2025-2030 ($ million)
Chart on Israel - Year-over-year growth 2025-2030 (%)
Data Table on Israel - Year-over-year growth 2025-2030 (%)

12.6.5 Turkey - Market size and forecast 2025-2030

Chart on Turkey - Market size and forecast 2025-2030 ($ million)
Data Table on Turkey - Market size and forecast 2025-2030 ($ million)
Chart on Turkey - Year-over-year growth 2025-2030 (%)
Data Table on Turkey - Year-over-year growth 2025-2030 (%)

12.7 South America - Market size and forecast 2025-2030

Chart on South America - Market size and forecast 2025-2030 ($ million)
Data Table on South America - Market size and forecast 2025-2030 ($ million)
Chart on South America - Year-over-year growth 2025-2030 (%)
Data Table on South America - Year-over-year growth 2025-2030 (%)
Chart on Regional Comparison - South America
Data Table on Regional Comparison - South America

12.7.1 Brazil - Market size and forecast 2025-2030

Chart on Brazil - Market size and forecast 2025-2030 ($ million)
Data Table on Brazil - Market size and forecast 2025-2030 ($ million)
Chart on Brazil - Year-over-year growth 2025-2030 (%)
Data Table on Brazil - Year-over-year growth 2025-2030 (%)

12.7.2 Argentina - Market size and forecast 2025-2030

Chart on Argentina - Market size and forecast 2025-2030 ($ million)
Data Table on Argentina - Market size and forecast 2025-2030 ($ million)
Chart on Argentina - Year-over-year growth 2025-2030 (%)
Data Table on Argentina - Year-over-year growth 2025-2030 (%)

12.7.3 Chile - Market size and forecast 2025-2030

Chart on Chile - Market size and forecast 2025-2030 ($ million)
Data Table on Chile - Market size and forecast 2025-2030 ($ million)
Chart on Chile - Year-over-year growth 2025-2030 (%)
Data Table on Chile - Year-over-year growth 2025-2030 (%)

12.8 Market opportunity by geography

Market opportunity by geography ($ million)
Data Tables on Market opportunity by geography ($ million)

13. Drivers, Challenges, and Opportunity

13.1 Market drivers

Expansion of unmanned defense systems
Escalation of illegal fishing activities
Modernization of naval port infrastructure

13.2 Market challenges

Escalating maritime cybersecurity vulnerabilities
Complex geopolitical friction zones
Severe regulatory compliance burdens

13.3 Impact of drivers and challenges

Impact of drivers and challenges in 2025 and 2030

13.4 Market opportunities

Satellite constellations and maritime domain awareness
Quantum sensing and advanced underwater detection
Blockchain and secure supply chain logistics

14. Competitive Landscape

14.1 Overview

14.2

Overview on criticality of inputs and factors of differentiation

14.3 Landscape disruption

Overview on factors of disruption

14.4 Industry risks

Impact of key risks on business

15. Competitive Analysis

15.1 Companies profiled

Companies covered

15.2 Company ranking index

15.3 Market positioning of companies

Matrix on companies position and classification

15.4 Airbus SE

Airbus SE - Overview
Airbus SE - Business segments
Airbus SE - Key news
Airbus SE - Key offerings
Airbus SE - Segment focus
SWOT

15.5 BAE Systems Plc

BAE Systems Plc - Overview
BAE Systems Plc - Business segments
BAE Systems Plc - Key news
BAE Systems Plc - Key offerings
BAE Systems Plc - Segment focus
SWOT

15.6 Elbit Systems Ltd.

Elbit Systems Ltd. - Overview
Elbit Systems Ltd. - Business segments
Elbit Systems Ltd. - Key offerings
Elbit Systems Ltd. - Segment focus
SWOT

15.7 Fincantieri Spa

Fincantieri Spa - Overview
Fincantieri Spa - Business segments
Fincantieri Spa - Key offerings
Fincantieri Spa - Segment focus
SWOT

15.8 Kongsberg Gruppen ASA

Kongsberg Gruppen ASA - Overview
Kongsberg Gruppen ASA - Business segments
Kongsberg Gruppen ASA - Key offerings
Kongsberg Gruppen ASA - Segment focus
SWOT

15.9 L3Harris Technologies Inc.

L3Harris Technologies Inc. - Overview
L3Harris Technologies Inc. - Business segments
L3Harris Technologies Inc. - Key offerings
L3Harris Technologies Inc. - Segment focus
SWOT

15.10 Leonardo S.p.A.

Leonardo S.p.A. - Overview
Leonardo S.p.A. - Business segments
Leonardo S.p.A. - Key news
Leonardo S.p.A. - Key offerings
Leonardo S.p.A. - Segment focus
SWOT

15.11 Lockheed Martin Corp.

Lockheed Martin Corp. - Overview
Lockheed Martin Corp. - Business segments
Lockheed Martin Corp. - Key news
Lockheed Martin Corp. - Key offerings
Lockheed Martin Corp. - Segment focus
SWOT

15.12 Northrop Grumman Corp.

Northrop Grumman Corp. - Overview
Northrop Grumman Corp. - Business segments
Northrop Grumman Corp. - Key offerings
Northrop Grumman Corp. - Segment focus
SWOT

15.13 Rheinmetall AG

Rheinmetall AG - Overview
Rheinmetall AG - Business segments
Rheinmetall AG - Key offerings
Rheinmetall AG - Segment focus
SWOT

15.14 RTX Corp.

RTX Corp. - Overview
RTX Corp. - Business segments
RTX Corp. - Key news
RTX Corp. - Key offerings
RTX Corp. - Segment focus
SWOT

15.15 Saab AB

Saab AB - Overview
Saab AB - Business segments
Saab AB - Key offerings
Saab AB - Segment focus
SWOT

15.16 ST Engineering Ltd.

ST Engineering Ltd. - Overview
ST Engineering Ltd. - Business segments
ST Engineering Ltd. - Key offerings
ST Engineering Ltd. - Segment focus
SWOT

15.17 Thales Group

Thales Group - Overview
Thales Group - Business segments
Thales Group - Key news
Thales Group - Key offerings
Thales Group - Segment focus
SWOT

15.18 Wartsila Corp.

Wartsila Corp. - Overview
Wartsila Corp. - Business segments
Wartsila Corp. - Key news
Wartsila Corp. - Key offerings
Wartsila Corp. - Segment focus
SWOT

16. Appendix

16.1 Scope of the report

Market definition
Objectives
Notes and caveats

16.2 Inclusions and exclusions checklist

Inclusions checklist
Exclusions checklist

16.3 Currency conversion rates for US$

16.4 Research methodology

16.5 Data procurement

Information sources

16.6 Data validation

16.7 Validation techniques employed for market sizing

16.8 Data synthesis

16.9 360 degree market analysis

16.10 List of abbreviations

Research Methodology

Technavio presents a detailed picture of the market by way of study, synthesis, and summation of data from multiple sources. The analysts have presented the various facets of the market with a particular focus on identifying the key industry influencers. The data thus presented is comprehensive, reliable, and the result of extensive research, both primary and secondary.

INFORMATION SOURCES

Primary sources

  • Manufacturers and suppliers
  • Channel partners
  • Industry experts
  • Strategic decision makers

Secondary sources

  • Industry journals and periodicals
  • Government data
  • Financial reports of key industry players
  • Historical data
  • Press releases

DATA ANALYSIS

Data Synthesis

  • Collation of data
  • Estimation of key figures
  • Analysis of derived insights

Data Validation

  • Triangulation with data models
  • Reference against proprietary databases
  • Corroboration with industry experts

REPORT WRITING

Qualitative

  • Market drivers
  • Market challenges
  • Market trends
  • Five forces analysis

Quantitative

  • Market size and forecast
  • Market segmentation
  • Geographical insights
  • Competitive landscape

Interested in this report?

Get your sample now to see our research methodology and insights!

Download Now

Frequently Asked Questions

Maritime Security market growth will increase by USD 3962.1 million during 2026-2030.

The Maritime Security market is expected to grow at a CAGR of 3.3% during 2026-2030.

Maritime Security market is segmented by Type (Deepwater security, Perimeter security) Technology (Surveillance and tracking, Screening and scanning, Communications, Others) End-user (Port authorities, Government, Shipping companies, Others)

Airbus SE, BAE Systems Plc, Elbit Systems Ltd., Fincantieri Spa, Furuno Electric Co. Ltd., HENSOLDT AG, Huntington Ingalls Industries, Indra Group, Kongsberg Gruppen ASA, L3Harris Technologies Inc., Leonardo S.p.A., Lockheed Martin Corp., Marlink SAS, Naval Group, Northrop Grumman Corp., Rheinmetall AG, RTX Corp., Saab AB, ST Engineering Ltd., Terma AS, Thales Group, Wartsila Corp. are a few of the key vendors in the Maritime Security market.

North America will register the highest growth rate of 42.9% among the other regions. Therefore, the Maritime Security market in North America is expected to garner significant business opportunities for the vendors during the forecast period.

US, Canada, Mexico, Germany, UK, France, Italy, Spain, The Netherlands, China, Japan, India, South Korea, Australia, Indonesia, Saudi Arabia, UAE, South Africa, Israel, Turkey, Brazil, Argentina, Chile

  • Expansion of unmanned defense systems is the driving factor this market.

The Maritime Security market vendors should focus on grabbing business opportunities from the Type segment as it accounted for the largest market share in the base year.
RIA - Research AI Assistant
Ask RIA
