
Maternity Intimate Wear Market Size 2024-2028
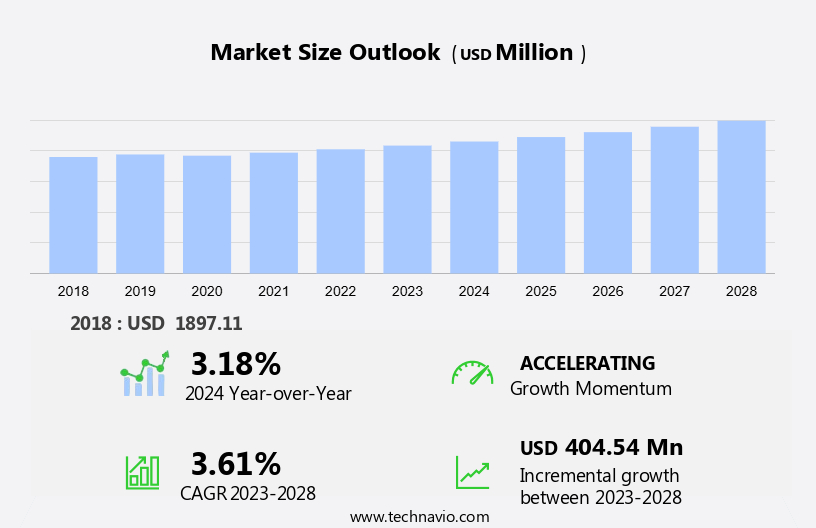
- The global maternity intimate wear market size is estimated to grow by USD 404.54 million between 2023 and 2028
- The market is accelerating at a compound annual growth rate of 3.61%.
The market trends and analysis report thoroughly examines factors driving growth, particularly the rising demand for maternity intimate wear in emerging markets. A notable trend is the customization of maternity intimate products, catering to personalized needs. However, the market's progress is constrained by the limited lifecycle of these products. These dynamics collectively shape the market landscape, highlighting both opportunities and challenges in meeting the evolving demands of maternity wear consumers. The focus on emerging markets and customization reflects a shift toward catering to specific consumer needs, while the short product lifecycle remains a significant hurdle. Overall, these factors underscore the complex environment in which the maternity intimate wear market operates.
To learn more about this report, View Sample PDF
Key Major Companies
Companies are implementing various market growth and forecasting strategies by analyzing factors such as strategic alliances, partnerships, mergers and acquisitions, geographical expansion, and product or service launches to enhance their presence in the market.
Anita Dr - The company offers maternity intimate wear such as Babybelt microfibre deep sand, Essential hipster briefs desert, and Rebelt panty after pregnancy desert.
The market report also includes detailed analyses of the competitive landscape of the market and information about 20 market companies, including Helbig GmbH, BLANQI, Boob Design AB, Bravado Designs Europe, Cache Coeur, Cake Maternity, Hennes and Mauritz AB, Hotmilk Lingerie, Kindred Bravely, La Lingerie, MAJAMAS EARTH, Mamsy, Maternity IP Holdings, Nine and Co. BV, Reitmans Canada Ltd, Ripe Maternity, Seraphine Ltd., The Dairy Fairy Inc, Victorias Secret and Co., and Yummy Maternity.
Qualitative and quantitative analysis of market research and growth, market growth and trends of companies has been conducted to help clients understand the wider business environment as well as the strengths and weaknesses of key market players. Data is qualitatively analyzed to categorize companies as pure play, category-focused, industry-focused, and diversified. Furthermore, market growth and forecasting it is also quantitatively analyzed to categorize companies as dominant, leading, strong, tentative, and weak.
Market Dynamics
The market is being driven by the increasing demand for convenient and comfortable products catering to pregnancies. With the availability of a wide variety of options, including maternity undergarments made from stretchy, lightweight fabrics like elastane and spandex, expectant mothers are finding more choices both online and offline. Trends in the fashion industry are also influencing the design of intimate wear, with innovations such as jersey knits and stylish tops and dresses. However, challenges persist in sourcing raw materials and maintaining physical stores amidst the dominance of online retail channels in this segment. The Online Children's and Maternity Apparel Market refers to the business sector where retailers sell clothing items over the internet for children and pregnant women.
Key Market Drivers
Growing demand for maternity intimate wear from emerging markets is notably driving market growth. The demand is rising, especially in developing countries such as India and China, owing to increasing awareness about the importance of using motherhood intimate wear and growing disposable income. The high number of fashion-conscious customers and the wide availability of products are increasing the demand for intimate wear across the world. Several intimate wear products are meant to adapt to changing postpartum bodies. Prenatal wear products such as support bras and briefs and postnatal wear products such as nursing bras, sleep bras, and nursing pads are available with zippers and double panels on both sides for nursing.
However, the use of such products ensures convenience for pregnant and nursing women. Consciousness about physical appearance in countries such as India and China has increased the demand for a variety of nursing wear products, such as bras, shapewear, nursing pads, and comfortable underwear. The focus on appearance and brand consciousness has increased the demand for international and domestic intimate wear in different countries. All these factors, including the apparel industry, birth rates, expectant mothers, comfortable and stylish clothing options, specialized garments, and other trends, are expected to drive the growth of the market during the forecast period.
Significant Market Trends
Customization of maternity intimate products is an emerging trend shaping market growth. Nowadays, women prefer customized wear products based on their needs. In addition to catering to various needs, customization of products tends to increase customer loyalty. In the current scenario, brands are aware that personalization and customization create value for customers. Customization contributes to an increase in sales and keeps customers satisfied. This promotes customer loyalty and word-of-mouth recommendations, which, in turn, increases the revenue and profit margins for manufacturers. Also, it aids in gathering better customer insights in terms of consumer trends and buying habits.
Furthermore, the increasing trend of motherhood photoshoots is increasing the need for customization or personalization of motherhood clothing, including intimate wear, which increases the sales volume. Also, personalized, intimate wear offers greater comfort to mothers owing to the good fit and choice of material, according to the user's requirements. This, in turn, is expected to drive the growth of the market during the forecast period.
Major Market Challenges
The limited lifecycle of maternity intimate wear is a significant challenge hindering the market growth. As the duration of pregnancy spans nine months, followed by a postnatal period of a few weeks, expecting mothers use such wear only for a few months. Therefore, intimate wear such as inner garments and support apparel like shapewear that is sold by established brands are quite expensive as they are specifically used by women only during their pregnancy and for postpartum support.
Moreover, price-sensitive customers find it difficult to purchase wear such as shapewear and support apparel such as belly bands and support belts as they perceive them as lifestyle products. Furthermore, due to the limited period during which motherhood intimate wear can be used, customers consider the high expenditure on them as an unjustified investment. Therefore, customers do not find it worth buying premium intimate wear during pregnancy, which might prove to be a price challenge and limit the market during the forecast period.
Get a detailed analysis of drivers, trends, and challenges Request Free PDF Sample!
Market Segmentation And Region
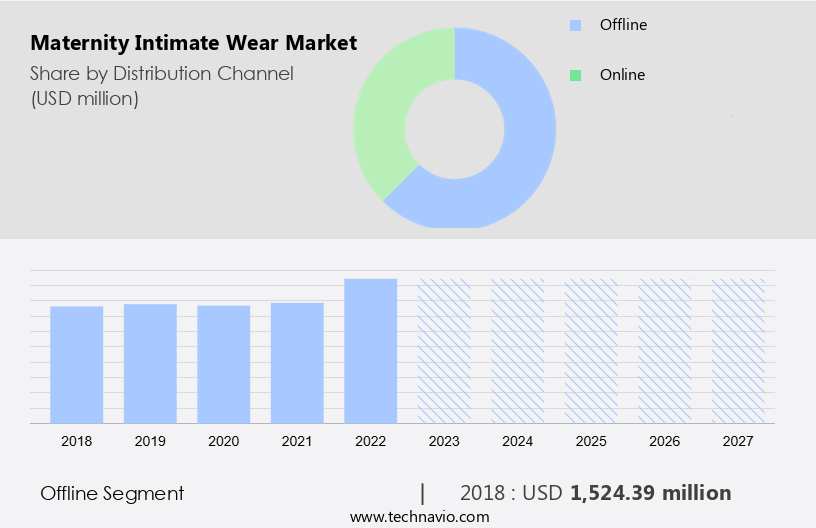
By Distribution Channel Analysis
The offline segment is estimated to witness significant growth during the forecast period. Offline stores allow customers to see the products in person and assess quality. They also provide the required product information from retailers. Retail stores enable customers to purchase products immediately. The offline segment was the largest and was valued at USD 1.52 billion in 2018. Despite holding a major share of the market, the offline segment is estimated to grow slowly, owing to the popularity of online stores. As some vendors are small or moderate in size, their geographic reach is limited to the country of their operations. Hence, their offline distribution network is limited to specific geographies, which reduces their pool of target customers. Therefore, vendors are trying to increase their market share by operating primarily through online stores and their websites. The wide presence and popularity of these stores are expected to increase the sales. These retail outlets often employ sales professionals who can explain the products and the advantages of different fabrics, which is expected to increase sales. Therefore, the segment is expected to grow during the forecast period.
To gain further insights on the market contribution of various segments Request a PDF Sample
By Product Analysis
Based on the product, the market has been segmented into bras, panties and others. The bras?segment will account for the largest share of this segment.?
Regional Analysis
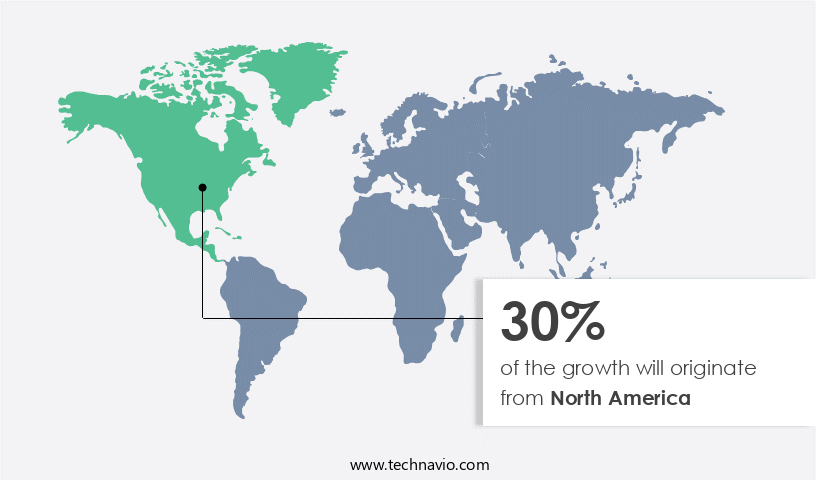
North America is estimated to contribute 30% during the forecast period.
For more insights on the market share of various regions Request PDF Sample now!
Technavio's analysts have provided extensive insight into the market forecasting, detailing the regional trends and drivers influencing the market's trajectory throughout the forecast period. In 2023, Europe held the largest share of the market, owing to the presence of multiple vendors that had access to various distribution channels. Despite small vendors lacking access to well-defined distribution networks, the rising penetration of the Internet and e-commerce websites is increasing sales. The popularity is increasing in the region because of the advertisements placed by vendors on social networking platforms. Besides, the online sales of intimate wear are also increasing in the region, owing to the availability of an extensive range of brands, easy delivery, and the convenience of online shopping.
In addition, the demand is increasing in Europe, owing to the rising number of pregnant working women and awareness about the availability of fashionable maternity apparel. The demand is mainly generated from developed countries, such as the UK, Germany, and France, owing to high disposable income and a significant number of fashion-conscious people. The celebrity endorsement of brands, such as Seraphine, also drives the growth of the market. Such endorsements attract fashion-conscious customers. All these factors are expected to increase sales in the region, which is expected to drive the growth of the market during the forecast period.
Market Analyst Overview
In the market, pregnancy trackers are becoming increasingly popular tools for expectant mothers to monitor their health and the development of their baby. Breastfeeding mothers seek comfortable and supportive options like maternity/nursing bras and maternity briefs. For added convenience, camisoles are designed to accommodate changing body shapes. Both offline distribution channel and online distribution channel offer a wide range of convenient product varieties including tops, tunics, and maxi dresses crafted from comfortable materials like cotton, nylon, and polyester. With advances and innovative tactics, the market caters to the diverse needs of expectant and nursing mothers with style and functionality. The maternity wear market represents a significant and growing sector within the global fashion industry.
Additionally, in the market, expectant and new mothers have a plethora of options to choose from, thanks to the influence of social media and the rise of e-commerce sales. These platforms offer a wide array of color, type, and material options, including those made from sustainable fabrics to cater to diverse body types and styles. With a focus on sustainable and eco-friendly practices, manufacturers are investing in advanced fabric technology to enhance comfort and support. From tops, tunics, maxi dresses to maternity bras and maternity underwear, brands are addressing the evolving needs of women at every stage of maternity clothing. Additionally, specialized items like maternity belts, flowy blouse, maternity blazer, and maternity cardigan ensure both style and functionality. With input from doctors and considerations for post-pregnancy and children, the market continues to innovate and adapt to meet the needs of mothers worldwide. The Maternity Support Products Market refers to the industry dedicated to providing expectant and new mothers with essential items that facilitate a comfortable and healthy pregnancy and postpartum experience.
|
Market Scope |
|
|
Report Coverage |
Details |
|
Page number |
120 |
|
Base year |
2023 |
|
Forecast period |
2024-2028 |
|
Growth momentum & CAGR |
Accelerate at a CAGR of 3.61% |
|
Market Growth 2024-2028 |
USD 404.54 million |
|
Market structure |
Fragmented |
|
YoY growth (%) |
3.18 |
|
Regional analysis |
Europe, North America, APAC, South America, and Middle East and Africa |
|
Performing market contribution |
North America at 30% |
|
Key consumer countries |
US, China, India, Germany, and UK |
|
Competitive landscape |
Leading companies, Competitive Strategies, Consumer engagement scope |
|
Key companies profiled |
Anita Dr. Helbig GmbH, BLANQI, Boob Design AB, Bravado Designs Europe, Cache Coeur, Cake Maternity, Hennes and Mauritz AB, Hotmilk Lingerie, Kindred Bravely, La Lingerie, MAJAMAS EARTH, Mamsy, Maternity IP Holdings, Nine and Co. BV, Reitmans Canada Ltd, Ripe Maternity, Seraphine Ltd., The Dairy Fairy Inc, Victorias Secret and Co., and Yummy Maternity |
|
Market dynamics |
Parent market growth analysis, Market growth inducers and obstacles, Fast-growing and slow-growing segment analysis, COVID-19 impact and recovery analysis and future consumer dynamics, Market condition analysis for the forecast period |
|
Customization purview |
If our report has not included the data that you are looking for, you can reach out to our analysts and get segments customized. |
What are the Key Data Covered in this Market Research Report?
- CAGR of the market forecast during the forecast period
- Detailed information on factors that will drive the growth of the market between 2024 and 2028
- Precise estimation of the market size and its contribution of the market in focus to the parent market
- Accurate predictions about upcoming trends and changes in consumer behavior
- Growth of the market across Europe, North America, APAC, South America, and Middle East and Africa
- Thorough market analysis and report of the market’s competitive landscape and detailed information about companies
- Comprehensive analysis of factors that will challenge the growth of market companies
We can help! Our analysts can customize this market research report to meet your requirements. Get in touch
 RIA -
RIA - 
