Meal Vouchers And Employee Benefit Solutions Market Analysis, Size, and Forecast 2025-2029: Europe (France, Germany, Italy, Spain, UK), South America (Brazil), APAC (China, India, Japan, South Korea), North America (Canada), and Middle East and Africa (UAE)

Meal Vouchers And Employee Benefit Solutions Market Analysis, Size, and Forecast 2025-2029:
Europe (France, Germany, Italy, Spain, UK), South America (Brazil), APAC (China, India, Japan, South Korea), North America (Canada), and Middle East and Africa (UAE)

Published: Jan 2025 196 Pages SKU: IRTNTR43013

Market Overview at a Glance

$21.32 B
Market Opportunity
4.3%
CAGR
4.1
YoY growth 2024-2025(%)

Meal Vouchers And Employee Benefit Solutions Market Size 2025-2029

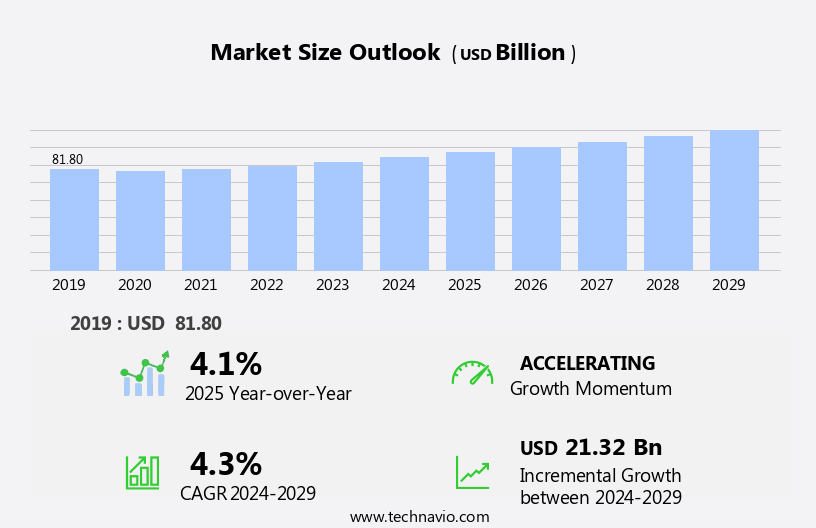
The meal vouchers and employee benefit solutions market size is forecast to increase by USD 21.32 billion at a CAGR of 4.3% between 2024 and 2029.

  • The market is experiencing significant growth, driven primarily by the tax benefits associated with meal vouchers and the shift toward digital solutions. Employers are increasingly recognizing the cost savings and employee morale boost that come with offering meal vouchers and other benefits as part of compensation packages. In fact, according to various industry reports, the global meal voucher market is projected to reach a substantial value by 2025, growing at a steady pace. However, this market is not without its challenges. Data privacy and security are paramount concerns in the digital age, and companies must ensure that sensitive employee information is protected.
  • Additionally, the implementation of digital meal voucher and benefit solutions requires significant investment in technology and infrastructure. Despite these challenges, the opportunities for growth are substantial. Companies that can effectively navigate these issues and offer innovative, user-friendly solutions will be well-positioned to capitalize on the market's expanding demand. Employers seeking to attract and retain top talent, while also controlling costs, will continue to turn to meal vouchers and employee benefit solutions as a key component of their compensation strategies.

What will be the Size of the Meal Vouchers And Employee Benefit Solutions Market during the forecast period?

Meal Vouchers And Employee Benefit Solutions Market Size

 Request Free Sample

  • The market encompasses a range of offerings designed to enhance financial and health well-being for employees. Meal vouchers, meal coupons, travel vouchers, and gift coupons serve as essential components of employee compensation packages, fostering workplace productivity and team engagement. Beyond meal solutions, this market includes offerings for health and wellness, retirement plans, flexible work arrangements, and financial benefits. Businesses, enterprises, government agencies, educational institutions, and various organizations recognize the importance of employee satisfaction, productivity, retention, morale, and positive work culture. As workforce demographics evolve, so too do the demands for comprehensive employee benefit solutions. These offerings contribute to competitive advantages, supportive government policies, and tax incentives, all while promoting corporate social responsibility.
  • The market continues to expand, with a growing emphasis on health and wellness initiatives. As businesses strive to attract and retain top talent, the demand for innovative and inclusive employee benefit packages remains high. The market's overall size and direction reflect this ongoing trend, with continued growth expected in the coming years.

How is this Meal Vouchers And Employee Benefit Solutions Industry segmented?

The meal vouchers and employee benefit solutions industry research report provides comprehensive data (region-wise segment analysis), with forecasts and estimates in "USD billion" for the period 2025-2029, as well as historical data from 2019-2023 for the following segments.

  • Type
    • Meal vouchers
    • Employee benefits
  • Product
    • Non-cash voucher
    • Cash voucher
  • Enterprise Size
    • Large
    • Medium
    • Large
    • Medium
  • Industry
    • Manufacturing
    • Healthcare
    • IT and Telecom
    • BFSI
    • Retail
    • Transportation and Logistics
    • Others
    • Manufacturing
    • Healthcare
    • IT and Telecom
    • BFSI
    • Retail
    • Transportation and Logistics
    • Others
  • Deployment
    • Physical
    • Digital
  • Geography
    • Europe
      • France
      • Germany
      • Italy
      • Spain
      • UK
    • South America
      • Brazil
    • APAC
      • China
      • India
      • Japan
      • South Korea
    • North America
      • US
      • Canada
    • Middle East and Africa
      • UAE

By Type Insights

The meal vouchers segment is estimated to witness significant growth during the forecast period.

The meal vouchers segment remains a substantial component of the market in 2024. This market growth is attributed to tax incentives offered under various tax regimes, such as in India, where meal vouchers worth USD0.585 or less per meal are exempt from tax. Meal vouchers serve as an essential element of employee compensation structures, with tax benefits determined by the respective country's laws. In India, these vouchers are regulated by the Reserve Bank of India (RBI) under the Prepaid Payments Instruments Act. companies like Sodexo and Edenred distribute and administer these vouchers, charging a commission from employers for their services.

Meal vouchers contribute to employee financial well-being and workplace productivity by addressing team engagement and work-life balance. Additionally, they impact consumption patterns and production patterns, as employees can make informed choices regarding their meals based on their dietary preferences and partner restaurants or food delivery services. Employee benefits solutions encompass meal vouchers, health and wellness programs, retirement plans, flexible work arrangements, financial benefits, and more. These solutions foster positive work cultures, boost morale, and serve as competitive advantages for businesses, enterprises, government agencies, educational institutions, and multinational companies (MNCs). Market dynamics include geopolitical influences, natural disasters, climate change, economic impact, trade policies, social concerns, demographic changes, supplier power, and buyer power.

Digital technologies, such as mobile applications, online platforms, and integrated benefit platforms, are transforming the delivery and management of these solutions. Advanced analytics and reporting capabilities enable businesses to monitor employee engagement, productivity, and retention rates. Financial wellness programs offer budgeting tools, healthcare coverage, paid time off, and insurance options to support employee well-being. Social media campaigns, content marketing, and tax incentives further enhance the market's growth.

Meal Vouchers And Employee Benefit Solutions Market Size

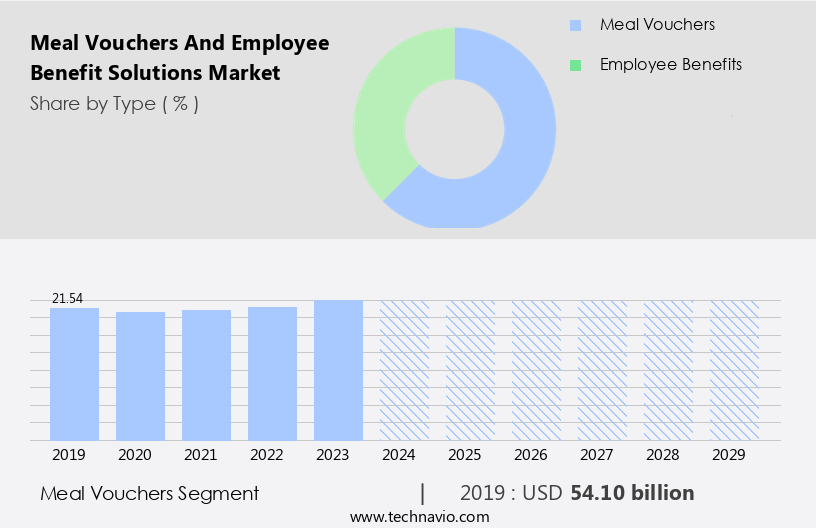
Get a glance at the market report of share of various segments Request Free Sample

The Meal vouchers segment was valued at USD 54.10 billion in 2019 and showed a gradual increase during the forecast period.
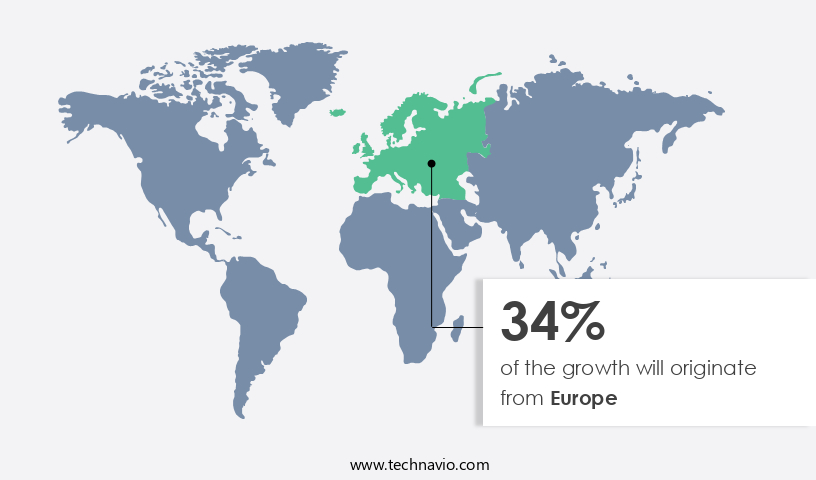
Regional Analysis

Europe is estimated to contribute 34% to the growth of the global market during the forecast period.Technavio’s analysts have elaborately explained the regional trends and drivers that shape the market during the forecast period.

Meal Vouchers And Employee Benefit Solutions Market Share by Geography

For more insights on the market size of various regions, Request Free Sample

The market is experiencing growth in the region, driven by shifting consumption patterns and the increasing preference for digital payment methods. Tax incentives associated with meal vouchers serve as a significant market driver. Some countries are implementing new regulations, such as Italy, which increased the electronic meal voucher limit from €7 to €11.30 per day from January 1, 2024. These changes impact the usage of meal vouchers, contributing to market expansion. Additionally, workforce demographics, health and wellness concerns, and financial benefits are influencing businesses, enterprises, government agencies, educational institutions, and multinational companies (MNCs) to prioritize employee satisfaction, productivity, retention, morale, and positive work culture.

Employee engagement, work-life balance, and corporate social responsibility are essential components of this market, with digital technologies, such as mobile applications, online platforms, and integrated benefit platforms, playing a crucial role. Financial wellness solutions, including budgeting tools, healthcare coverage, paid time off, and insurance options, are also gaining traction. Social media campaigns, content marketing, and tax incentives further enhance the market's appeal. Market dynamics include geopolitical influences, natural disasters, climate change, economic impact, trade policies, and demographic changes, as well as supplier and buyer power. Employee wellness, dietary preferences, partner restaurants, food delivery services, and digital meal vouchers are essential considerations for businesses seeking to optimize their employee benefit solutions.

Market Dynamics

Our researchers analyzed the data with 2024 as the base year, along with the key drivers, trends, and challenges. A holistic analysis of drivers will help companies refine their marketing strategies to gain a competitive advantage.

What are the key market drivers leading to the rise in the adoption of Meal Vouchers And Employee Benefit Solutions Industry?

  • Tax benefits of meal vouchers is the key driver of the market. 

  • Meal vouchers and employee benefit solutions have gained significance in the global business landscape, offering tax advantages to companies, organizations, and employers. In several countries, providing meal vouchers, food coupons, or prepaid meal cards as part of an employee's salary structure exempts the employer from tax liability. For instance, the Workers' Food Program (PAT) was introduced in Brazil in 1976, enabling companies to pay for their employees' food provisions in exchange for tax relief. Similarly, in India, the number of meal vouchers an employee uses is not considered part of their taxable salary. The Income Tax Department of the Indian government grants tax benefits for free food and beverages offered to employees.
  • These benefits not only help employers reduce their tax burden but also enhance employee morale and productivity. Employers can explore meal voucher and employee benefit solutions as a strategic tool to optimize their tax liabilities while providing valuable perks to their workforce.

What are the market trends shaping the Meal Vouchers And Employee Benefit Solutions Industry?

  • Shift toward digital meal vouchers and employee benefit solutions is the upcoming market trend. 

  • The market is witnessing significant growth due to the increasing internet penetration rate in developing economies and the widespread adoption of mobile internet and smartphones. This digital transformation is driving a shift towards digital wallets and payment methods, with numerous retailers and companies now accepting payments through these modes. The European Commission, for instance, is investing in ultra-fast networks to enhance internet infrastructure, aiming to provide high-speed internet coverage to all its citizens by 2025 and gigabit connectivity by 2030.
  • This initiative, along with the growing trend of automation and digitization among companies like Sodexo Group and Edenred, is enabling personalized services for clients and employees. The market is expected to continue growing as more organizations embrace digital solutions for their meal voucher and employee benefit programs.

What challenges does the Meal Vouchers And Employee Benefit Solutions Industry face during its growth?

  • Data privacy and security issues is a key challenge affecting the industry growth. 

  • In today's digital business landscape, meal voucher and employee benefit solutions have become essential tools for organizations to attract and retain talent. These solutions offer numerous advantages, such as streamlined administration, increased efficiency, and improved employee morale. However, with the growing adoption of technology comes the risk of data breaches. companies providing meal voucher and employee benefit services often collect and store personal information of employees and business partners. While many companies employ commercially available security technologies to protect this data, any vulnerability in their servers or mobile apps could lead to privacy concerns and potential reputational damage.
  • In this era of digitization, data has become a crucial asset, and its protection is paramount. For instance, Edenred offers various payment options, including Apple Pay, Google Pay, SAMSUNG Pay, and its proprietary solutions, to its beneficiaries for making payments online. Businesses must carefully evaluate the security measures implemented by their meal voucher and employee benefit solution providers to mitigate the risk of data breaches and safeguard their reputation.

Exclusive Customer Landscape

The meal vouchers and employee benefit solutions market forecasting report includes the adoption lifecycle of the market, covering from the innovator’s stage to the laggard’s stage. It focuses on adoption rates in different regions based on penetration. Furthermore, the meal vouchers and employee benefit solutions market report also includes key purchase criteria and drivers of price sensitivity to help companies evaluate and develop their market growth analysis strategies.
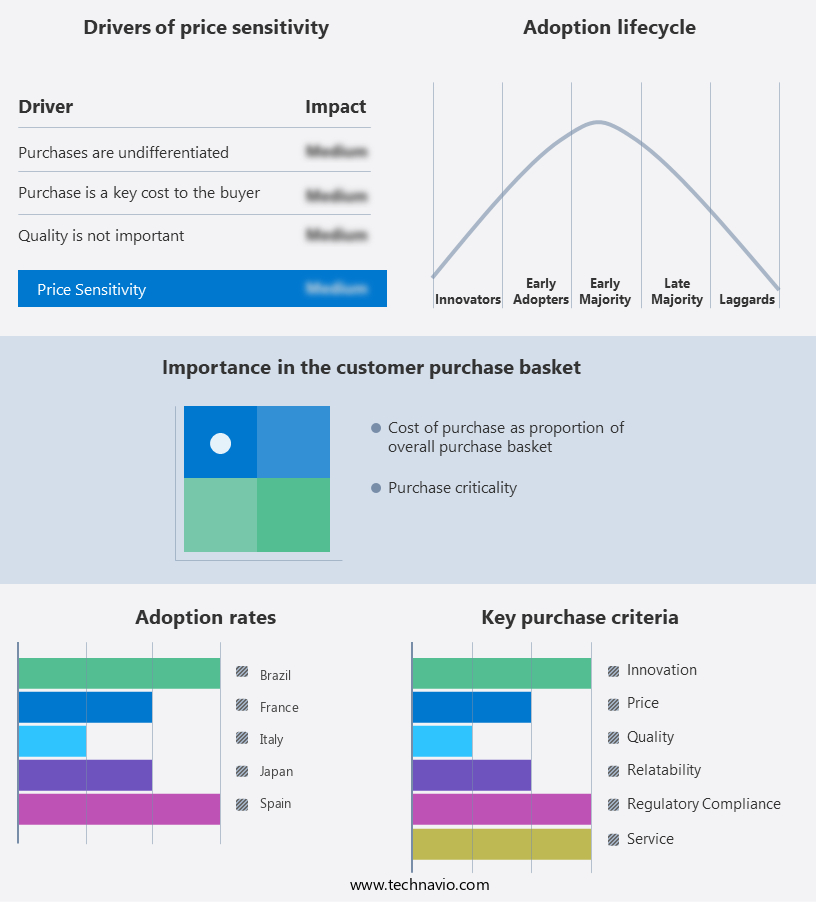
Meal Vouchers And Employee Benefit Solutions Market Share by Geography

 Customer Landscape

Key Companies & Market Insights

Companies are implementing various strategies, such as strategic alliances, meal vouchers and employee benefit solutions market forecast, partnerships, mergers and acquisitions, geographical expansion, and product/service launches, to enhance their presence in the industry.

Alelo - The company provides meal vouchers and extensive employee benefit solutions, including transportation benefits and more, under the Alelo Benefit program. This comprehensive offering enhances workforce well-being and productivity.

The industry research and growth report includes detailed analyses of the competitive landscape of the market and information about key companies, including:

  • Alelo
  • Alera Group Inc.
  • Axis Bank Ltd.
  • Certify Inc.
  • Circula GmbH
  • CIRFOOD s.c.
  • Edenred SE
  • Electrum Fintech Solutions Pvt. Ltd.
  • Empyrean Benefits Solutions Inc.
  • Hrmony GmbH
  • ICICI Bank Ltd.
  • Monizze NV SA
  • PIB Group Ltd.
  • Set Corporate Services Inc.
  • Sodexo SA
  • SPENDIT AG
  • SWILE
  • The Up Group Ltd.
  • UniCredit SpA
  • VA Tech Ventures Pvt. Ltd.
  • VR Benefícios
  • Zaggle Prepaid Ocean Services Pvt. Ltd.

Qualitative and quantitative analysis of companies has been conducted to help clients understand the wider business environment as well as the strengths and weaknesses of key industry players. Data is qualitatively analyzed to categorize companies as pure play, category-focused, industry-focused, and diversified; it is quantitatively analyzed to categorize companies as dominant, leading, strong, tentative, and weak.

Research Analyst Overview

Meal vouchers and employee benefit solutions have emerged as essential components of modern human resource management. These offerings contribute significantly to the financial well-being and overall wellness of employees, fostering productivity, team engagement, and positive work culture. Meal vouchers, which include meal coupons, travel vouchers, and gift coupons, serve as a valuable tool for businesses to support their employees' daily needs and enhance their work-life balance. The demand for meal vouchers and employee benefit solutions is driven by various factors. Production and consumption patterns continue to evolve, necessitating flexible and adaptable benefits. Workforce demographics are changing, with an increasing focus on health and wellness, retirement plans, and financial benefits.

Furthermore, businesses are recognizing the importance of employee satisfaction, productivity, and retention in a competitive market. Professional services and enterprises, including government agencies, educational institutions, and multinational companies (MNCs), are increasingly adopting integrated benefit platforms to manage their employee benefit programs. These platforms offer advanced analytics and reporting capabilities, enabling organizations to gain insights into their workforce demographics and consumption patterns. Geopolitical influences, natural disasters, climate change, economic impact, and trade policies have created a complex business environment. Employers are responding by offering employee benefits that address social concerns and support their workforce during challenging times.

For instance, meal vouchers can help employees manage their food expenses during economic downturns or natural disasters. Digital technologies, such as mobile applications and online platforms, have transformed the way meal vouchers and employee benefits are delivered and managed. Digital meal vouchers offer convenience and flexibility, allowing employees to use them at partner restaurants, food delivery services, and other eligible merchants. The market for meal vouchers and employee benefit solutions is dynamic and competitive. Buyer power and supplier power influence the pricing and offerings in this market. Businesses must navigate these dynamics to secure the best deals and offer competitive advantages to their employees.

Marketing activities, such as social media campaigns and content marketing, play a crucial role in promoting employee benefits and enhancing brand visibility. Tax incentives and government policies also impact the adoption and implementation of meal vouchers and employee benefit solutions. In , meal vouchers and employee benefit solutions are essential components of modern human resource management. They contribute to the financial well-being and overall wellness of employees, fostering productivity, team engagement, and positive work culture. The market for these offerings is dynamic and influenced by various factors, including production and consumption patterns, workforce demographics, and geopolitical influences.

Employers must navigate these dynamics to offer competitive benefits and create a supportive work environment.

Market Scope

Report Coverage

Details

Page number

196

Base year

2024

Historic period

2019-2023

Forecast period

2025-2029

Growth momentum & CAGR

Accelerate at a CAGR of 4.3%

Market growth 2025-2029

USD 21.32 billion

Market structure

Fragmented

YoY growth 2024-2025(%)

4.1

Key countries

US, China, Japan, Germany, France, Spain, Canada, India, South Korea, France, Japan, Italy, Brazil, UAE, UK, Spain, and Rest of World (ROW)

Competitive landscape

Leading Companies, Market Positioning of Companies, Competitive Strategies, and Industry Risks

Request Free Sample

What are the Key Data Covered in this Meal Vouchers And Employee Benefit Solutions Market Research and Growth Report?

  • CAGR of the Meal Vouchers And Employee Benefit Solutions industry during the forecast period
  • Detailed information on factors that will drive the growth and forecasting between 2025 and 2029
  • Precise estimation of the size of the market and its contribution of the industry in focus to the parent market
  • Accurate predictions about upcoming growth and trends and changes in consumer behaviour
  • Growth of the market across Europe, South America, APAC, North America, and Middle East and Africa
  • Thorough analysis of the market’s competitive landscape and detailed information about companies
  • Comprehensive analysis of factors that will challenge the meal vouchers and employee benefit solutions market growth of industry companies

We can help! Our analysts can customize this meal vouchers and employee benefit solutions market research report to meet your requirements.

Get in touch


1 Executive Summary

  • 1.1 Market overview
    • Executive Summary - Chart on Market Overview
    • Executive Summary - Data Table on Market Overview
    • Executive Summary - Chart on Global Market Characteristics
    • Executive Summary - Chart on Market by Geography
    • Executive Summary - Chart on Market Segmentation by Type
    • Executive Summary - Chart on Market Segmentation by Product
    • Executive Summary - Chart on Incremental Growth
    • Executive Summary - Data Table on Incremental Growth
    • Executive Summary - Chart on Company Market Positioning

2 Technavio Analysis

  • 2.1 Analysis of price sensitivity, lifecycle, customer purchase basket, adoption rates, and purchase criteria
    • Analysis of price sensitivity, lifecycle, customer purchase basket, adoption rates, and purchase criteria
  • 2.2 Criticality of inputs and Factors of differentiation
    • Overview on criticality of inputs and factors of differentiation
  • 2.3 Factors of disruption
    • Overview on factors of disruption
  • 2.4 Impact of drivers and challenges
    • Impact of drivers and challenges in 2024 and 2029

3 Market Landscape

  • 3.1 Market ecosystem
    • Parent Market
    • Data Table on - Parent Market
  • 3.2 Market characteristics
    • Market characteristics analysis
  • 3.3 Value chain analysis
    • Value chain analysis

4 Market Sizing

  • 4.1 Market definition
    • Offerings of companies included in the market definition
  • 4.2 Market segment analysis
    • Market segments
  • 4.3 Market size 2024
    • 4.4 Market outlook: Forecast for 2024-2029
      • Chart on Global - Market size and forecast 2024-2029 ($ million)
      • Data Table on Global - Market size and forecast 2024-2029 ($ million)
      • Chart on Global Market: Year-over-year growth 2024-2029 (%)
      • Data Table on Global Market: Year-over-year growth 2024-2029 (%)

    5 Historic Market Size

    • 5.1 Global Meal Vouchers And Employee Benefit Solutions Market 2019 - 2023
      • Historic Market Size - Data Table on Global Meal Vouchers And Employee Benefit Solutions Market 2019 - 2023 ($ million)
    • 5.2 Type segment analysis 2019 - 2023
      • Historic Market Size - Type Segment 2019 - 2023 ($ million)
    • 5.3 Product segment analysis 2019 - 2023
      • Historic Market Size - Product Segment 2019 - 2023 ($ million)
    • 5.4 Geography segment analysis 2019 - 2023
      • Historic Market Size - Geography Segment 2019 - 2023 ($ million)
    • 5.5 Country segment analysis 2019 - 2023
      • Historic Market Size - Country Segment 2019 - 2023 ($ million)

    6 Qualitative Analysis

    • 6.1 The AI impact on global meal vouchers and employee benefit solutions market

      7 Five Forces Analysis

      • 7.1 Five forces summary
        • Five forces analysis - Comparison between 2024 and 2029
      • 7.2 Bargaining power of buyers
        • Bargaining power of buyers - Impact of key factors 2024 and 2029
      • 7.3 Bargaining power of suppliers
        • Bargaining power of suppliers - Impact of key factors in 2024 and 2029
      • 7.4 Threat of new entrants
        • Threat of new entrants - Impact of key factors in 2024 and 2029
      • 7.5 Threat of substitutes
        • Threat of substitutes - Impact of key factors in 2024 and 2029
      • 7.6 Threat of rivalry
        • Threat of rivalry - Impact of key factors in 2024 and 2029
      • 7.7 Market condition
        • Chart on Market condition - Five forces 2024 and 2029

      8 Market Segmentation by Type

      • 8.1 Market segments
        • Chart on Type - Market share (2024-2029) (%)
        • Data Table on Type - Market share (2024-2029) (%)
      • 8.2 Comparison by Type
        • Chart on Comparison by Type
        • Data Table on Comparison by Type
      • 8.3 Meal vouchers - Market size and forecast (2024-2029)
        • Chart on Meal vouchers - Market size and forecast (2024-2029) ($ million)
        • Data Table on Meal vouchers - Market size and forecast (2024-2029) ($ million)
        • Chart on Meal vouchers - Year-over-year growth (2024-2029) (%)
        • Data Table on Meal vouchers - Year-over-year growth (2024-2029) (%)
      • 8.4 Employee benefits - Market size and forecast (2024-2029)
        • Chart on Employee benefits - Market size and forecast (2024-2029) ($ million)
        • Data Table on Employee benefits - Market size and forecast (2024-2029) ($ million)
        • Chart on Employee benefits - Year-over-year growth (2024-2029) (%)
        • Data Table on Employee benefits - Year-over-year growth (2024-2029) (%)
      • 8.5 Market opportunity by Type
        • Market opportunity by Type ($ million)
        • Data Table on Market opportunity by Type ($ million)

      9 Market Segmentation by Product

      • 9.1 Market segments
        • Chart on Product - Market share (2024-2029) (%)
        • Data Table on Product - Market share (2024-2029) (%)
      • 9.2 Comparison by Product
        • Chart on Comparison by Product
        • Data Table on Comparison by Product
      • 9.3 Non-cash voucher - Market size and forecast (2024-2029)
        • Chart on Non-cash voucher - Market size and forecast (2024-2029) ($ million)
        • Data Table on Non-cash voucher - Market size and forecast (2024-2029) ($ million)
        • Chart on Non-cash voucher - Year-over-year growth (2024-2029) (%)
        • Data Table on Non-cash voucher - Year-over-year growth (2024-2029) (%)
      • 9.4 Cash voucher - Market size and forecast (2024-2029)
        • Chart on Cash voucher - Market size and forecast (2024-2029) ($ million)
        • Data Table on Cash voucher - Market size and forecast (2024-2029) ($ million)
        • Chart on Cash voucher - Year-over-year growth (2024-2029) (%)
        • Data Table on Cash voucher - Year-over-year growth (2024-2029) (%)
      • 9.5 Market opportunity by Product
        • Market opportunity by Product ($ million)
        • Data Table on Market opportunity by Product ($ million)

      10 Market Segmentation by Enterprise Size

      • 10.1 Market segments
        • Chart on Enterprise Size - Market share (2024-2029) (%)
        • Data Table on Enterprise Size - Market share (2024-2029) (%)
      • 10.2 Comparison by Enterprise Size
        • Chart on Comparison by Enterprise Size
        • Data Table on Comparison by Enterprise Size
      • 10.3 Large - Market size and forecast (2024-2029)
        • Chart on Large - Market size and forecast (2024-2029) ($ million)
        • Data Table on Large - Market size and forecast (2024-2029) ($ million)
        • Chart on Large - Year-over-year growth (2024-2029) (%)
        • Data Table on Large - Year-over-year growth (2024-2029) (%)
      • 10.4 Medium - Market size and forecast (2024-2029)
        • Chart on Medium - Market size and forecast (2024-2029) ($ million)
        • Data Table on Medium - Market size and forecast (2024-2029) ($ million)
        • Chart on Medium - Year-over-year growth (2024-2029) (%)
        • Data Table on Medium - Year-over-year growth (2024-2029) (%)
      • 10.5 Market opportunity by Enterprise Size
        • Market opportunity by Enterprise Size ($ million)
        • Data Table on Market opportunity by Enterprise Size ($ million)

      11 Market Segmentation by Industry

      • 11.1 Market segments
        • Chart on Industry - Market share (2024-2029) (%)
        • Data Table on Industry - Market share (2024-2029) (%)
        • Market opportunity by Industry ($ million)
        • Data Table on Market opportunity by Industry ($ million)
      • 11.2 Comparison by Industry
        • Chart on Comparison by Industry
        • Data Table on Comparison by Industry
      • 11.3 Manufacturing - Market size and forecast (2024-2029)
        • Chart on Manufacturing - Market size and forecast (2024-2029) ($ million)
        • Data Table on Manufacturing - Market size and forecast (2024-2029) ($ million)
        • Chart on Manufacturing - Year-over-year growth (2024-2029) (%)
        • Data Table on Manufacturing - Year-over-year growth (2024-2029) (%)
      • 11.4 Healthcare - Market size and forecast (2024-2029)
        • Chart on Healthcare - Market size and forecast (2024-2029) ($ million)
        • Data Table on Healthcare - Market size and forecast (2024-2029) ($ million)
        • Chart on Healthcare - Year-over-year growth (2024-2029) (%)
        • Data Table on Healthcare - Year-over-year growth (2024-2029) (%)
      • 11.5 IT and Telecom - Market size and forecast (2024-2029)
        • Chart on IT and Telecom - Market size and forecast (2024-2029) ($ million)
        • Data Table on IT and Telecom - Market size and forecast (2024-2029) ($ million)
        • Chart on IT and Telecom - Year-over-year growth (2024-2029) (%)
        • Data Table on IT and Telecom - Year-over-year growth (2024-2029) (%)
      • 11.6 BFSI - Market size and forecast (2024-2029)
        • Chart on BFSI - Market size and forecast (2024-2029) ($ million)
        • Data Table on BFSI - Market size and forecast (2024-2029) ($ million)
        • Chart on BFSI - Year-over-year growth (2024-2029) (%)
        • Data Table on BFSI - Year-over-year growth (2024-2029) (%)
      • 11.7 Retail - Market size and forecast (2024-2029)
        • Chart on Retail - Market size and forecast (2024-2029) ($ million)
        • Data Table on Retail - Market size and forecast (2024-2029) ($ million)
        • Chart on Retail - Year-over-year growth (2024-2029) (%)
        • Data Table on Retail - Year-over-year growth (2024-2029) (%)
      • 11.8 Transportation and Logistics - Market size and forecast (2024-2029)
        • Chart on Transportation and Logistics - Market size and forecast (2024-2029) ($ million)
        • Data Table on Transportation and Logistics - Market size and forecast (2024-2029) ($ million)
        • Chart on Transportation and Logistics - Year-over-year growth (2024-2029) (%)
        • Data Table on Transportation and Logistics - Year-over-year growth (2024-2029) (%)
      • 11.9 Others - Market size and forecast (2024-2029)
        • Chart on Others - Market size and forecast (2024-2029) ($ million)
        • Data Table on Others - Market size and forecast (2024-2029) ($ million)
        • Chart on Others - Year-over-year growth (2024-2029) (%)
        • Data Table on Others - Year-over-year growth (2024-2029) (%)

      12 Market Segmentation by Deployment

      • 12.1 Market segments
        • Chart on Deployment - Market share (2024-2029) (%)
        • Data Table on Deployment - Market share (2024-2029) (%)
      • 12.2 Comparison by Deployment
        • Chart on Comparison by Deployment
        • Data Table on Comparison by Deployment
      • 12.3 Physical - Market size and forecast (2024-2029)
        • Chart on Physical - Market size and forecast (2024-2029) ($ million)
        • Data Table on Physical - Market size and forecast (2024-2029) ($ million)
        • Chart on Physical - Year-over-year growth (2024-2029) (%)
        • Data Table on Physical - Year-over-year growth (2024-2029) (%)
      • 12.4 Digital - Market size and forecast (2024-2029)
        • Chart on Digital - Market size and forecast (2024-2029) ($ million)
        • Data Table on Digital - Market size and forecast (2024-2029) ($ million)
        • Chart on Digital - Year-over-year growth (2024-2029) (%)
        • Data Table on Digital - Year-over-year growth (2024-2029) (%)
      • 12.5 Market opportunity by Deployment
        • Market opportunity by Deployment ($ million)
        • Data Table on Market opportunity by Deployment ($ million)

      13 Customer Landscape

      • 13.1 Customer landscape overview
        • Analysis of price sensitivity, lifecycle, customer purchase basket, adoption rates, and purchase criteria

      14 Geographic Landscape

      • 14.1 Geographic segmentation
        • Chart on Market share by geography 2024-2029 (%)
        • Data Table on Market share by geography 2024-2029 (%)
      • 14.2 Geographic comparison
        • Chart on Geographic comparison
        • Data Table on Geographic comparison
      • 14.3 Europe - Market size and forecast 2024-2029
        • Chart on Europe - Market size and forecast 2024-2029 ($ million)
        • Data Table on Europe - Market size and forecast 2024-2029 ($ million)
        • Chart on Europe - Year-over-year growth 2024-2029 (%)
        • Data Table on Europe - Year-over-year growth 2024-2029 (%)
      • 14.4 South America - Market size and forecast 2024-2029
        • Chart on South America - Market size and forecast 2024-2029 ($ million)
        • Data Table on South America - Market size and forecast 2024-2029 ($ million)
        • Chart on South America - Year-over-year growth 2024-2029 (%)
        • Data Table on South America - Year-over-year growth 2024-2029 (%)
      • 14.5 APAC - Market size and forecast 2024-2029
        • Chart on APAC - Market size and forecast 2024-2029 ($ million)
        • Data Table on APAC - Market size and forecast 2024-2029 ($ million)
        • Chart on APAC - Year-over-year growth 2024-2029 (%)
        • Data Table on APAC - Year-over-year growth 2024-2029 (%)
      • 14.6 North America - Market size and forecast 2024-2029
        • Chart on North America - Market size and forecast 2024-2029 ($ million)
        • Data Table on North America - Market size and forecast 2024-2029 ($ million)
        • Chart on North America - Year-over-year growth 2024-2029 (%)
        • Data Table on North America - Year-over-year growth 2024-2029 (%)
      • 14.7 Middle East and Africa - Market size and forecast 2024-2029
        • Chart on Middle East and Africa - Market size and forecast 2024-2029 ($ million)
        • Data Table on Middle East and Africa - Market size and forecast 2024-2029 ($ million)
        • Chart on Middle East and Africa - Year-over-year growth 2024-2029 (%)
        • Data Table on Middle East and Africa - Year-over-year growth 2024-2029 (%)
      • 14.8 Brazil - Market size and forecast 2024-2029
        • Chart on Brazil - Market size and forecast 2024-2029 ($ million)
        • Data Table on Brazil - Market size and forecast 2024-2029 ($ million)
        • Chart on Brazil - Year-over-year growth 2024-2029 (%)
        • Data Table on Brazil - Year-over-year growth 2024-2029 (%)
      • 14.9 France - Market size and forecast 2024-2029
        • Chart on France - Market size and forecast 2024-2029 ($ million)
        • Data Table on France - Market size and forecast 2024-2029 ($ million)
        • Chart on France - Year-over-year growth 2024-2029 (%)
        • Data Table on France - Year-over-year growth 2024-2029 (%)
      • 14.10 US - Market size and forecast 2024-2029
        • Chart on US - Market size and forecast 2024-2029 ($ million)
        • Data Table on US - Market size and forecast 2024-2029 ($ million)
        • Chart on US - Year-over-year growth 2024-2029 (%)
        • Data Table on US - Year-over-year growth 2024-2029 (%)
      • 14.11 China - Market size and forecast 2024-2029
        • Chart on China - Market size and forecast 2024-2029 ($ million)
        • Data Table on China - Market size and forecast 2024-2029 ($ million)
        • Chart on China - Year-over-year growth 2024-2029 (%)
        • Data Table on China - Year-over-year growth 2024-2029 (%)
      • 14.12 India - Market size and forecast 2024-2029
        • Chart on India - Market size and forecast 2024-2029 ($ million)
        • Data Table on India - Market size and forecast 2024-2029 ($ million)
        • Chart on India - Year-over-year growth 2024-2029 (%)
        • Data Table on India - Year-over-year growth 2024-2029 (%)
      • 14.13 Italy - Market size and forecast 2024-2029
        • Chart on Italy - Market size and forecast 2024-2029 ($ million)
        • Data Table on Italy - Market size and forecast 2024-2029 ($ million)
        • Chart on Italy - Year-over-year growth 2024-2029 (%)
        • Data Table on Italy - Year-over-year growth 2024-2029 (%)
      • 14.14 Japan - Market size and forecast 2024-2029
        • Chart on Japan - Market size and forecast 2024-2029 ($ million)
        • Data Table on Japan - Market size and forecast 2024-2029 ($ million)
        • Chart on Japan - Year-over-year growth 2024-2029 (%)
        • Data Table on Japan - Year-over-year growth 2024-2029 (%)
      • 14.15 Spain - Market size and forecast 2024-2029
        • Chart on Spain - Market size and forecast 2024-2029 ($ million)
        • Data Table on Spain - Market size and forecast 2024-2029 ($ million)
        • Chart on Spain - Year-over-year growth 2024-2029 (%)
        • Data Table on Spain - Year-over-year growth 2024-2029 (%)
      • 14.16 South Korea - Market size and forecast 2024-2029
        • Chart on South Korea - Market size and forecast 2024-2029 ($ million)
        • Data Table on South Korea - Market size and forecast 2024-2029 ($ million)
        • Chart on South Korea - Year-over-year growth 2024-2029 (%)
        • Data Table on South Korea - Year-over-year growth 2024-2029 (%)
      • 14.17 Germany - Market size and forecast 2024-2029
        • Chart on Germany - Market size and forecast 2024-2029 ($ million)
        • Data Table on Germany - Market size and forecast 2024-2029 ($ million)
        • Chart on Germany - Year-over-year growth 2024-2029 (%)
        • Data Table on Germany - Year-over-year growth 2024-2029 (%)
      • 14.18 Market opportunity by geography
        • Market opportunity by geography ($ million)
        • Data Tables on Market opportunity by geography ($ million)
      • 14.19 Canada - Market size and forecast (2024-2029)
        • Chart on Canada - Market size and forecast (2024-2029) ($ million)
        • Data Table on Canada - Market size and forecast (2024-2029) ($ million)
        • Chart on Canada - Year-over-year growth (2024-2029) (%)
        • Data Table on Canada - Year-over-year growth (2024-2029) (%)
      • 14.20 UAE - Market size and forecast (2024-2029)
        • Chart on UAE - Market size and forecast (2024-2029) ($ million)
        • Data Table on UAE - Market size and forecast (2024-2029) ($ million)
        • Chart on UAE - Year-over-year growth (2024-2029) (%)
        • Data Table on UAE - Year-over-year growth (2024-2029) (%)
      • 14.21 UK - Market size and forecast (2024-2029)
        • Chart on UK - Market size and forecast (2024-2029) ($ million)
        • Data Table on UK - Market size and forecast (2024-2029) ($ million)
        • Chart on UK - Year-over-year growth (2024-2029) (%)
        • Data Table on UK - Year-over-year growth (2024-2029) (%)
      • 14.22 Rest of World (ROW) - Market size and forecast (2024-2029)
        • Chart on Rest of World (ROW) - Market size and forecast (2024-2029) ($ million)
        • Data Table on Rest of World (ROW) - Market size and forecast (2024-2029) ($ million)
        • Chart on Rest of World (ROW) - Year-over-year growth (2024-2029) (%)
        • Data Table on Rest of World (ROW) - Year-over-year growth (2024-2029) (%)

      15 Drivers, Challenges, and Opportunity/Restraints

      • 15.1 Market drivers
        • 15.2 Market challenges
          • 15.3 Impact of drivers and challenges
            • Impact of drivers and challenges in 2024 and 2029
          • 15.4 Market opportunities/restraints

            16 Competitive Landscape

            • 16.1 Overview
              • 16.2 Competitive Landscape
                • Overview on criticality of inputs and factors of differentiation
              • 16.3 Landscape disruption
                • Overview on factors of disruption
              • 16.4 Industry risks
                • Impact of key risks on business

              17 Competitive Analysis

              • 17.1 Companies profiled
                • Companies covered
              • 17.2 Market positioning of companies
                • Matrix on companies position and classification
              • 17.3 Alelo
                • Alelo - Overview
                • Alelo - Product / Service
                • Alelo - Key offerings
              • 17.4 Alera Group Inc.
                • Alera Group Inc. - Overview
                • Alera Group Inc. - Product / Service
                • Alera Group Inc. - Key offerings
              • 17.5 Axis Bank Ltd.
                • Axis Bank Ltd. - Overview
                • Axis Bank Ltd. - Product / Service
                • Axis Bank Ltd. - Key offerings
              • 17.6 Certify Inc.
                • Certify Inc. - Overview
                • Certify Inc. - Product / Service
                • Certify Inc. - Key offerings
              • 17.7 Circula GmbH
                • Circula GmbH - Overview
                • Circula GmbH - Product / Service
                • Circula GmbH - Key offerings
              • 17.8 CIRFOOD s.c.
                • CIRFOOD s.c. - Overview
                • CIRFOOD s.c. - Product / Service
                • CIRFOOD s.c. - Key offerings
              • 17.9 Edenred SE
                • Edenred SE - Overview
                • Edenred SE - Product / Service
                • Edenred SE - Key offerings
              • 17.10 Electrum Fintech Solutions Pvt. Ltd.
                • Electrum Fintech Solutions Pvt. Ltd. - Overview
                • Electrum Fintech Solutions Pvt. Ltd. - Product / Service
                • Electrum Fintech Solutions Pvt. Ltd. - Key offerings
              • 17.11 Empyrean Benefits Solutions Inc.
                • Empyrean Benefits Solutions Inc. - Overview
                • Empyrean Benefits Solutions Inc. - Product / Service
                • Empyrean Benefits Solutions Inc. - Key offerings
              • 17.12 Hrmony GmbH
                • Hrmony GmbH - Overview
                • Hrmony GmbH - Product / Service
                • Hrmony GmbH - Key offerings
              • 17.13 ICICI Bank Ltd.
                • ICICI Bank Ltd. - Overview
                • ICICI Bank Ltd. - Product / Service
                • ICICI Bank Ltd. - Key offerings
              • 17.14 Monizze NV SA
                • Monizze NV SA - Overview
                • Monizze NV SA - Product / Service
                • Monizze NV SA - Key offerings
              • 17.15 PIB Group Ltd.
                • PIB Group Ltd. - Overview
                • PIB Group Ltd. - Product / Service
                • PIB Group Ltd. - Key offerings
              • 17.16 Set Corporate Services Inc.
                • Set Corporate Services Inc. - Overview
                • Set Corporate Services Inc. - Product / Service
                • Set Corporate Services Inc. - Key offerings
              • 17.17 Sodexo SA
                • Sodexo SA - Overview
                • Sodexo SA - Product / Service
                • Sodexo SA - Key offerings
              • 17.18 SPENDIT AG
                • SPENDIT AG - Overview
                • SPENDIT AG - Product / Service
                • SPENDIT AG - Key offerings
              • 17.19 SWILE
                • SWILE - Overview
                • SWILE - Product / Service
                • SWILE - Key offerings
              • 17.20 The Up Group Ltd.
                • The Up Group Ltd. - Overview
                • The Up Group Ltd. - Product / Service
                • The Up Group Ltd. - Key offerings
              • 17.21 UniCredit SpA
                • UniCredit SpA - Overview
                • UniCredit SpA - Product / Service
                • UniCredit SpA - Key offerings
              • 17.22 VA Tech Ventures Pvt. Ltd.
                • VA Tech Ventures Pvt. Ltd. - Overview
                • VA Tech Ventures Pvt. Ltd. - Product / Service
                • VA Tech Ventures Pvt. Ltd. - Key offerings
              • 17.23 VR Benefícios
                • VR Benefícios - Overview
                • VR Benefícios - Product / Service
                • VR Benefícios - Key offerings
              • 17.24 Zaggle Prepaid Ocean Services Pvt. Ltd.
                • Zaggle Prepaid Ocean Services Pvt. Ltd. - Overview
                • Zaggle Prepaid Ocean Services Pvt. Ltd. - Product / Service
                • Zaggle Prepaid Ocean Services Pvt. Ltd. - Key offerings
              • 17.25 Alelo
                • Alelo - Overview
                • Alelo - Product / Service
                • Alelo - Key offerings
              • 17.26 Alera Group Inc.
                • Alera Group Inc. - Overview
                • Alera Group Inc. - Product / Service
                • Alera Group Inc. - Key offerings
              • 17.27 Axis Bank Ltd.
                • Axis Bank Ltd. - Overview
                • Axis Bank Ltd. - Product / Service
                • Axis Bank Ltd. - Key offerings
              • 17.28 Certify Inc.
                • Certify Inc. - Overview
                • Certify Inc. - Product / Service
                • Certify Inc. - Key offerings
              • 17.29 Circula GmbH
                • Circula GmbH - Overview
                • Circula GmbH - Product / Service
                • Circula GmbH - Key offerings
              • 17.30 CIRFOOD s.c.
                • CIRFOOD s.c. - Overview
                • CIRFOOD s.c. - Product / Service
                • CIRFOOD s.c. - Key offerings
              • 17.31 Edenred SE
                • Edenred SE - Overview
                • Edenred SE - Product / Service
                • Edenred SE - Key offerings
              • 17.32 Electrum Fintech Solutions Pvt. Ltd.
                • Electrum Fintech Solutions Pvt. Ltd. - Overview
                • Electrum Fintech Solutions Pvt. Ltd. - Product / Service
                • Electrum Fintech Solutions Pvt. Ltd. - Key offerings
              • 17.33 Empyrean Benefits Solutions Inc.
                • Empyrean Benefits Solutions Inc. - Overview
                • Empyrean Benefits Solutions Inc. - Product / Service
                • Empyrean Benefits Solutions Inc. - Key offerings
              • 17.34 Hrmony GmbH
                • Hrmony GmbH - Overview
                • Hrmony GmbH - Product / Service
                • Hrmony GmbH - Key offerings
              • 17.35 ICICI Bank Ltd.
                • ICICI Bank Ltd. - Overview
                • ICICI Bank Ltd. - Product / Service
                • ICICI Bank Ltd. - Key offerings
              • 17.36 Monizze NV SA
                • Monizze NV SA - Overview
                • Monizze NV SA - Product / Service
                • Monizze NV SA - Key offerings
              • 17.37 PayPal Holdings Inc.
                • PayPal Holdings Inc. - Overview
                • PayPal Holdings Inc. - Product / Service
                • PayPal Holdings Inc. - Key offerings
              • 17.38 PIB Group Ltd.
                • PIB Group Ltd. - Overview
                • PIB Group Ltd. - Product / Service
                • PIB Group Ltd. - Key offerings
              • 17.39 Set Corporate Services Inc.
                • Set Corporate Services Inc. - Overview
                • Set Corporate Services Inc. - Product / Service
                • Set Corporate Services Inc. - Key offerings
              • 17.40 Sodexo SA
                • Sodexo SA - Overview
                • Sodexo SA - Product / Service
                • Sodexo SA - Key offerings
              • 17.41 SPENDIT AG
                • SPENDIT AG - Overview
                • SPENDIT AG - Product / Service
                • SPENDIT AG - Key offerings
              • 17.42 SWILE
                • SWILE - Overview
                • SWILE - Product / Service
                • SWILE - Key offerings
              • 17.43 The Up Group Ltd.
                • The Up Group Ltd. - Overview
                • The Up Group Ltd. - Product / Service
                • The Up Group Ltd. - Key offerings
              • 17.44 UniCredit SpA
                • UniCredit SpA - Overview
                • UniCredit SpA - Product / Service
                • UniCredit SpA - Key offerings
              • 17.45 Unum Group
                • Unum Group - Overview
                • Unum Group - Product / Service
                • Unum Group - Key offerings
              • 17.46 VA Tech Ventures Pvt. Ltd.
                • VA Tech Ventures Pvt. Ltd. - Overview
                • VA Tech Ventures Pvt. Ltd. - Product / Service
                • VA Tech Ventures Pvt. Ltd. - Key offerings
              • 17.47 Zaggle Prepaid Ocean Services Pvt. Ltd.
                • Zaggle Prepaid Ocean Services Pvt. Ltd. - Overview
                • Zaggle Prepaid Ocean Services Pvt. Ltd. - Product / Service
                • Zaggle Prepaid Ocean Services Pvt. Ltd. - Key offerings

              18 Appendix

              • 18.1 Scope of the report
                • 18.2 Inclusions and exclusions checklist
                  • Inclusions checklist
                  • Exclusions checklist
                • 18.3 Currency conversion rates for US$
                  • Currency conversion rates for US$
                • 18.4 Research methodology
                  • Research methodology
                • 18.5 Data procurement
                  • Information sources
                • 18.6 Data validation
                  • Data validation
                • 18.7 Validation techniques employed for market sizing
                  • Validation techniques employed for market sizing
                • 18.8 Data synthesis
                  • Data synthesis
                • 18.9 360 degree market analysis
                  • 360 degree market analysis
                • 18.10 List of abbreviations
                  • List of abbreviations

                Research Methodology

                Technavio presents a detailed picture of the market by way of study, synthesis, and summation of data from multiple sources. The analysts have presented the various facets of the market with a particular focus on identifying the key industry influencers. The data thus presented is comprehensive, reliable, and the result of extensive research, both primary and secondary.

                INFORMATION SOURCES

                Primary sources

                • Manufacturers and suppliers
                • Channel partners
                • Industry experts
                • Strategic decision makers

                Secondary sources

                • Industry journals and periodicals
                • Government data
                • Financial reports of key industry players
                • Historical data
                • Press releases

                DATA ANALYSIS

                Data Synthesis

                • Collation of data
                • Estimation of key figures
                • Analysis of derived insights

                Data Validation

                • Triangulation with data models
                • Reference against proprietary databases
                • Corroboration with industry experts

                REPORT WRITING

                Qualitative

                • Market drivers
                • Market challenges
                • Market trends
                • Five forces analysis

                Quantitative

                • Market size and forecast
                • Market segmentation
                • Geographical insights
                • Competitive landscape

                Interested in this report?

                Get your sample now to see our research methodology and insights!

                Download Now

                Frequently Asked Questions

                Meal Vouchers And Employee Benefit Solutions market growth will increase by $ 21.32 bn during 2025-2029 .

                The Meal Vouchers And Employee Benefit Solutions market is expected to grow at a CAGR of 4.3% during 2025-2029 .

                Meal Vouchers And Employee Benefit Solutions market is segmented by Type( Meal vouchers, Employee benefits) Product( Non-cash voucher, Cash voucher, APAC, North America, Middle East and Africa)

                Alelo, Alera Group Inc., Axis Bank Ltd., Certify Inc., Circula GmbH, CIRFOOD s.c., Edenred SE, Electrum Fintech Solutions Pvt. Ltd., Empyrean Benefits Solutions Inc., Hrmony GmbH, ICICI Bank Ltd., Monizze NV SA, PIB Group Ltd., Set Corporate Services Inc., Sodexo SA, SPENDIT AG, SWILE, The Up Group Ltd., UniCredit SpA, VA Tech Ventures Pvt. Ltd., VR Benefícios, Zaggle Prepaid Ocean Services Pvt. Ltd. are a few of the key vendors in the Meal Vouchers And Employee Benefit Solutions market.

                Europe will register the highest growth rate of 34% among the other regions. Therefore, the Meal Vouchers And Employee Benefit Solutions market in Europe is expected to garner significant business opportunities for the vendors during the forecast period.

                US, China, Japan, Germany, France, Spain, Canada, India, South Korea, France, Japan, Italy, Brazil, UAE, UK, Spain, Rest of World (ROW)

                • Tax benefits of meal vouchersCompanies is the driving factor this market.
                • organizations is the driving factor this market.
                • or employers who provide meal vouchers is the driving factor this market.
                • food coupons is the driving factor this market.
                • or prepaid meal cards as part of employees' salary structure are exempt from tax in most countries worldwide. For example is the driving factor this market.
                • in 1976 is the driving factor this market.
                • the Federal Government of Brazil launched the Workers' Food Program (Programa de Alimentacao do Trabalhador - PAT) is the driving factor this market.
                • in which companies or employers were asked to pay for employees' food provisions in exchange for tax relief.In India is the driving factor this market.
                • the number of meal vouchers that an employee avails of is not included in the taxable salary. According to the Income Tax Department is the driving factor this market.
                • Government of India is the driving factor this market.
                • there are tax benefits for free food and beverages provided to employees.Fully-taxable: Free meals in excess of Rs. 50 ($0.77) per meal minus the amount paid by the employee shall be a taxable prerequisite.Exempt from tax: Following free meals are exempted from tax: a) Food and non-alcoholic beverages provided during working hours in remote areas or in an offshore installation; b) Tea is the driving factor this market.
                • coffee is the driving factor this market.
                • or non-alcoholic beverages and snacks during working hours are tax-free perquisites; c) food in office premises or through non-transferable paid vouchers usable only at eating joints provided by an employer is not taxable is the driving factor this market.
                • if the cost to the employer is Rs. 50 ($0.77) (or less) per meal.These benefits and tax exemption have helped the market in focus to grow exponentially in the past and is expected to drive the growth of the global meal vouchers and employee benefit solutions market during the forecast period as well. is the driving factor this market.

                The Meal Vouchers And Employee Benefit Solutions market vendors should focus on grabbing business opportunities from the Meal vouchers segment as it accounted for the largest market share in the base year.