Desalination Market Analysis, Size, and Forecast 2025-2029: North America (US and Canada), Europe (France, Germany, Italy, and UK), Middle East and Africa (Egypt, KSA, Oman, and UAE), APAC (China, India, and Japan), South America (Argentina and Brazil), and Rest of World (ROW)

Desalination Market Analysis, Size, and Forecast 2025-2029:
North America (US and Canada), Europe (France, Germany, Italy, and UK), Middle East and Africa (Egypt, KSA, Oman, and UAE), APAC (China, India, and Japan), South America (Argentina and Brazil), and Rest of World (ROW)

Published: May 2025 219 Pages SKU: IRTNTR43592

Market Overview at a Glance

$10.41 B
Market Opportunity
8.9%
CAGR
8.0
YoY growth 2024-2025(%)

Desalination Market Size 2025-2029

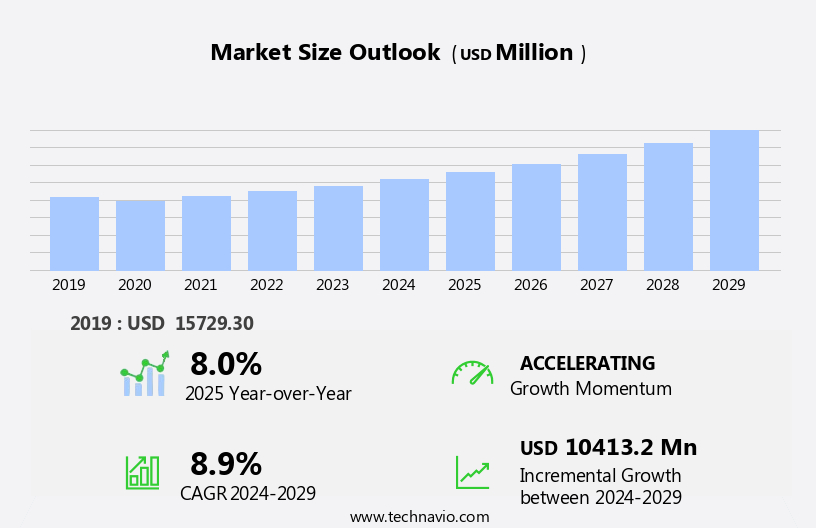
The desalination market size is forecast to increase by USD 10.41 billion, at a CAGR of 8.9% between 2024 and 2029.

  • The market is driven by the escalating population growth and subsequent surge in demand for consumable water. As water scarcity becomes a pressing issue, desalination emerges as a viable solution to meet the increasing water demands. Additionally, the integration of renewable energy sources in desalination processes is gaining traction, contributing to the market's momentum. However, the high initial investment costs associated with setting up desalination plants pose a significant challenge for market growth. Despite this hurdle, companies can capitalize on the growing demand for water and the trend towards renewable energy integration by developing cost-effective desalination technologies and collaborating with energy providers to optimize the use of renewable power sources. Also, the presence of excess salts and minerals in feedwater sources poses challenges in the desalination process.
  • By addressing these challenges, market participants can effectively navigate the competitive landscape and capitalize on the opportunities presented by the market.

What will be the Size of the Desalination Market during the forecast period?

Desalination Market Size

Explore in-depth regional segment analysis with market size data - historical 2019-2023 and forecasts 2025-2029 - in the full report.  
Request Free Sample

Desalination, a critical solution in addressing water scarcity, continues to evolve as market dynamics unfold. The desalination industry encompasses various technologies, including reverse osmosis (RO), thermal desalination, and membrane distillation, among others. Each technology presents unique advantages and challenges in terms of water quality, capital costs, and energy efficiency. Water recovery rate and salt rejection are crucial factors in evaluating desalination plants' performance. RO membranes, a common choice, filter water through semipermeable membranes, rejecting salts and impurities. Thermal desalination processes, such as vapor compression distillation and multi-effect distillation, heat seawater to produce steam, which then condenses into fresh water.

Membrane distillation separates water through temperature difference, minimizing the need for chemicals. Desalination projects face various challenges, including high capital costs, energy consumption, and environmental impact. Integrating desalination with renewable energy sources and improving energy efficiency through energy recovery devices is a significant focus. Pretreatment systems, including intake structures and cleaning agents, are essential for maintaining water quality and minimizing fouling. Desalination applications span municipal and agricultural sectors, particularly in arid regions and coastal communities, where water security is paramount. Mineral composition, total dissolved solids, and brine management are essential considerations for desalination plants. Technological advancements, such as forward osmosis, capacitive deionization, and tubular modules, offer potential solutions to optimize desalination processes and reduce costs.

Remote monitoring and process control systems enable real-time data analytics, ensuring desalination plants operate efficiently and effectively. The market's continuous evolution reflects the industry's commitment to addressing water scarcity and ensuring water security.

How is this Desalination Industry segmented?

The desalination industry research report provides comprehensive data (region-wise segment analysis), with forecasts and estimates in "USD million" for the period 2025-2029, as well as historical data from 2019-2023 for the following segments.

  • Technology
    • Membrane
    • Thermal
  • Application
    • Municipal
    • Industrial
    • Others
  • Source
    • Seawater
    • Brackish water
  • Plant Type
    • Large Scale
    • Medium Scale
    • Small Scale
    • Mobile/Containerized
  • Component
    • Pumps
    • Membranes
    • Energy Recovery Devices
    • Pre-treatment Systems
    • Post-treatment Systems
  • Geography
    • North America
      • US
      • Canada
    • Europe
      • France
      • Germany
      • Italy
      • UK
    • Middle East and Africa
      • Egypt
      • KSA
      • Oman
      • UAE
    • APAC
      • China
      • India
      • Japan
    • South America
      • Argentina
      • Brazil
    • Rest of World (ROW)

By Technology Insights

The membrane segment is estimated to witness significant growth during the forecast period.

The market is driven by the increasing water scarcity in coastal communities and arid regions. Membrane technology, a significant segment of this market, dominates with its ability to provide high water purity and suitability for areas with water stress and limited energy resources. Reverse osmosis (RO), a popular membrane technique, is widely used due to its high salt rejection rate and energy efficiency. Data analytics plays a crucial role in optimizing operational costs by predicting maintenance requirements and improving process control. Desalination capacity expansion through desalination projects is on the rise, with thermal desalination and multi-stage flash distillation being common techniques.

Energy consumption is a concern, but energy recovery devices and advances in membrane technology are mitigating this issue. Brine management, including brine discharge and brine management systems, is another challenge. Desalination plants employ various intake structures, including seawater intake and intake structures with pretreatment systems, to maintain water quality. Mineral composition and total dissolved solids are critical factors in desalination technology, with desalination chemicals used to address mineral imbalances. Capacitive deionization and forward osmosis are emerging techniques offering energy efficiency and drought resilience. Capital costs remain a significant barrier, but advancements in membrane distillation and vapor compression distillation are reducing costs.

Environmental impact is a concern, with focus on reducing the use of cleaning agents and high-pressure pumps. Agricultural applications are also expanding the market scope.

Desalination Market Size

Request Free Sample

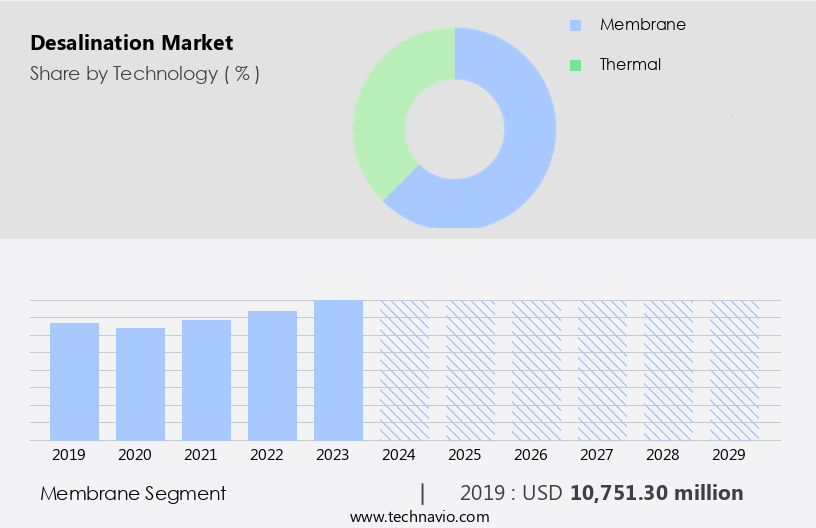
The Membrane segment was valued at USD 10.75 billion in 2019 and showed a gradual increase during the forecast period.
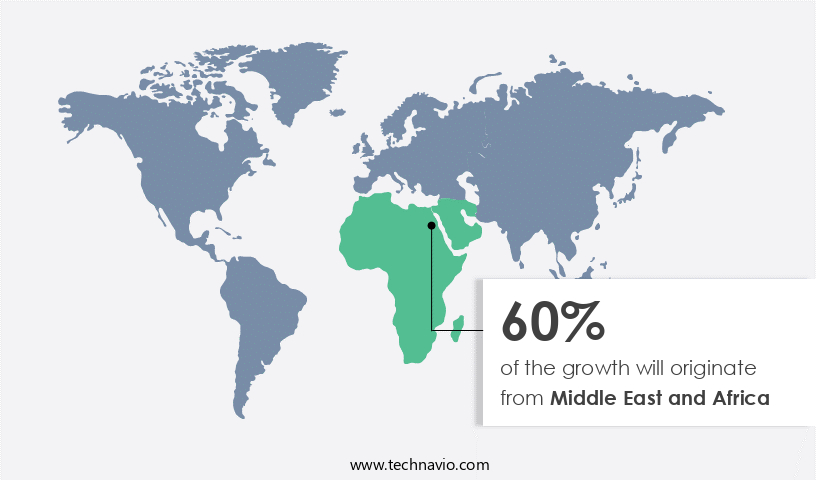
Regional Analysis

Middle East and Africa is estimated to contribute 60% to the growth of the global market during the forecast period.Technavio's analysts have elaborately explained the regional trends and drivers that shape the market during the forecast period.

Desalination Market Share by Geography

 Request Free Sample

The market is witnessing significant growth, particularly in regions with water scarcity, such as the Middle East and Africa. Desalination technologies, including reverse osmosis, vapor compression distillation, multi-effect distillation, and thermal desalination, are increasingly being adopted to address the challenge of insufficient freshwater resources. Reverse osmosis membranes play a crucial role in this process by filtering out total dissolved solids and salt, ensuring water purity. Desalination plants employ various intake structures and pretreatment systems to maintain water quality and minimize environmental impact. Operational costs, energy efficiency, and brine management are critical factors influencing the market. Energy recovery devices and thermal desalination techniques help reduce energy consumption.

Capacitive deionization and electrodialysis reversal are emerging technologies that offer energy savings and improved water recovery rates. Desalination projects are being implemented in municipal applications, agricultural areas, and coastal communities to ensure water security and drought resilience. Data analytics and process control enable remote monitoring and optimization of desalination plants. Desalination chemicals, such as cleaning agents and desalination membrane cleaning solutions, are essential for maintaining plant efficiency and performance. The market for desalination technology is expected to continue growing due to the increasing demand for clean water and the availability of advanced desalination solutions. Despite the benefits, desalination faces challenges, including high capital costs, environmental concerns, and the need for effective brine management.

As desalination capacity increases, it is essential to address these challenges and ensure sustainable desalination practices. The market is expected to remain dynamic, with ongoing research and innovation in desalination membranes, desalination technology, and desalination chemicals.

Market Dynamics

The Global Desalination Market is expanding rapidly, driven by the increasing need for fresh water amidst growing water scarcity solutions. Desalination technologies, particularly Reverse Osmosis (RO) desalination plants utilizing advanced desalination membranes, are crucial for converting seawater desalination and brackish water desalination into potable resources. These plants serve vital municipal water supply and industrial water treatment (desalination) needs. Innovations in renewable energy integration (desalination) and energy recovery devices (ERDs) are enhancing efficiency and sustainability. The Middle East & Africa Desalination Market holds the largest share, while the Asia Pacific Desalination Market is the fastest-growing. Leading desalination plant operators and desalination equipment manufacturers are continually innovating in membrane filtration systems (desalination) and thermal desalination technology. Managing brine management solutions and developing portable desalination units are also significant aspects of the evolving global desalination market trends.

Our researchers analyzed the data with 2024 as the base year, along with the key drivers, trends, and challenges. A holistic analysis of drivers will help companies refine their marketing strategies to gain a competitive advantage.

What are the key market drivers leading to the rise in the adoption of Desalination Industry?

  • The primary drivers of the market are the escalating population growth and the subsequent rise in demand for consumable water. 
  • The market is experiencing significant growth due to the increasing global population and the resulting demand for safe, consumable water. By 2050, the global population is projected to reach 9.73 billion, and only half of that number had access to safe water as of 2022. Freshwater reserves are unevenly distributed, making desalination an essential solution for meeting the world's water needs. Despite the abundance of water in nature, much of it is not potable due to contaminants such as industrial waste, pollutants, and pathogens. Desalination technologies, including forward osmosis, multi-stage flash distillation, and membrane filtration, are effective in removing these contaminants, making seawater a viable source of safe water.
  • Energy efficiency is a critical consideration in desalination projects, with energy recovery devices and intake structures designed to minimize energy usage. Salt rejection is also a crucial factor, with advanced technologies such as reverse osmosis membranes and multi-effect distillation achieving high salt rejection rates. Environmental impact is a significant concern in the desalination industry, and efforts are being made to minimize it through the use of renewable energy sources, such as solar and wind, and the implementation of closed-loop systems. Remote monitoring and automation technologies are also being employed to optimize plant performance and reduce operational costs.
  • Overall, the market is driven by the urgent need to provide safe, consumable water to a growing global population, and advancements in technology are making desalination increasingly energy-efficient, cost-effective, and environmentally sustainable.

What are the market trends shaping the Desalination Industry?

  • The increasing adoption of renewable power sources is a significant market trend. This shift towards sustainable energy solutions is a professional and informed response to the growing demand for environmentally friendly and cost-effective energy solutions.
  • Desalination technology is a critical solution to address water scarcity issues, especially in regions experiencing droughts. However, the energy-intensive nature of desalination processes contributes significantly to their high costs. To mitigate this challenge, key players are focusing on establishing desalination plants powered by renewable energy sources. The global energy demand is escalating due to expanding manufacturing sectors, population growth, and rapid industrialization and urbanization. Renewable energy, such as solar and wind, offers a viable solution to reduce desalination's energy consumption.
  • Capacitive deionization, high-pressure pumps, tubular modules, and spiral wound modules are some desalination technologies that can operate efficiently with renewable energy. Brine management and the use of cleaning agents are essential considerations for the successful implementation of renewable energy in desalination plants. By adopting renewable energy sources, desalination plants can contribute to energy savings and promote drought resilience for agricultural applications.

What challenges does the Desalination Industry face during its growth?

  • The significant initial investment costs associated with desalination plant establishment represent a major challenge impeding the industry's growth. 
  • Desalination, a critical solution for water security in arid regions and coastal communities, remains an essential yet costly water treatment process. Capital costs for desalination plants remain substantial due to the complex technologies involved, such as thermal desalination and membrane distillation. These processes require significant energy consumption, with seawater desalination accounting for over 50% of the total operating cost. Energy sources, plant capacity, and water recovery rates are significant factors influencing the cost of desalination. Desalination chemicals are also essential for effective pretreatment systems, which address mineral composition and ensure water quality.
  • The energy-intensive nature of desalination necessitates a focus on energy efficiency and cost reduction strategies. Despite these challenges, desalination plays a crucial role in securing water resources in various regions. Electrodialysis reversal and other advanced desalination technologies continue to evolve, offering potential for cost savings and increased efficiency.

Exclusive Customer Landscape

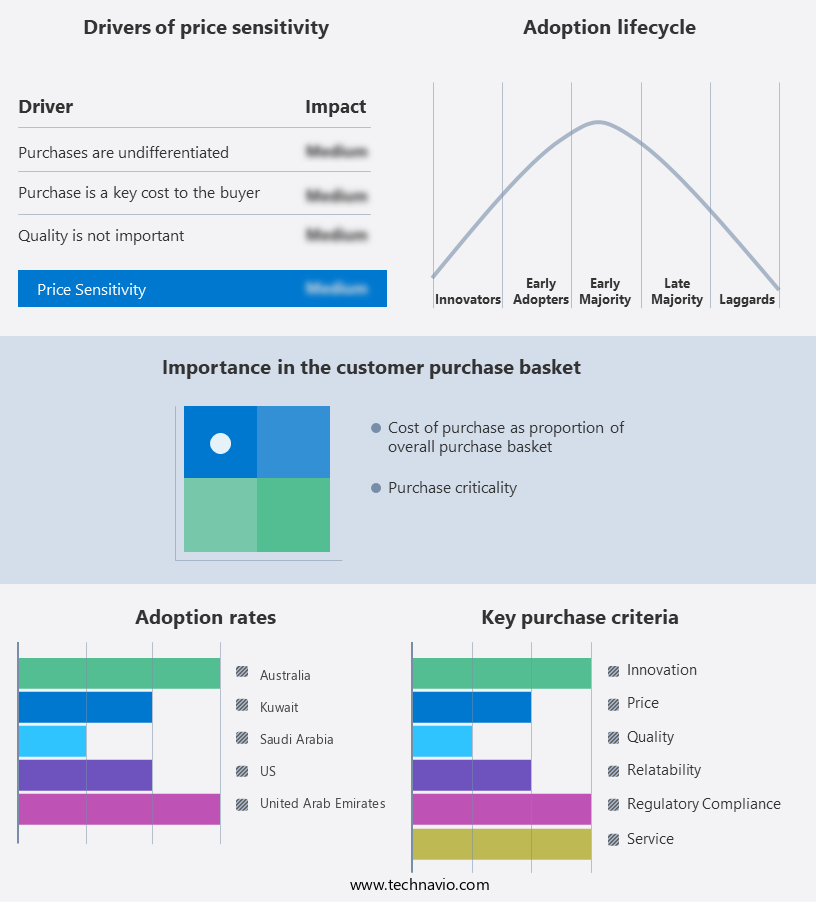
The desalination market forecasting report includes the adoption lifecycle of the market, covering from the innovator's stage to the laggard's stage. It focuses on adoption rates in different regions based on penetration. Furthermore, the desalination market report also includes key purchase criteria and drivers of price sensitivity to help companies evaluate and develop their market growth analysis strategies.

Desalination Market Share by Geography

 Customer Landscape

Key Companies & Market Insights

Companies are implementing various strategies, such as strategic alliances, desalination market forecast, partnerships, mergers and acquisitions, geographical expansion, and product/service launches, to enhance their presence in the industry.

The industry research and growth report includes detailed analyses of the competitive landscape of the market and information about key companies, including:

  • Acciona SA
  • Asahi Kasei Corp.
  • Bechtel Corp.
  • Biwater Holdings Ltd.
  • Consolidated Water Co. Ltd.
  • Doosan Corp.
  • DuPont de Nemours Inc.
  • Ferrovial SA
  • IDE Water Technologies
  • Kurita Water Industries Ltd
  • Mitsubishi Heavy Industries Ltd.
  • Osmoflo
  • Poseidon Water LLC
  • ProMinent GmbH
  • RAI Amsterdam Aquatech
  • TEMAK SA
  • Toyobo Co. Ltd.
  • Veolia Environnement SA
  • Webuild

Qualitative and quantitative analysis of companies has been conducted to help clients understand the wider business environment as well as the strengths and weaknesses of key industry players. Data is qualitatively analyzed to categorize companies as pure play, category-focused, industry-focused, and diversified; it is quantitatively analyzed to categorize companies as dominant, leading, strong, tentative, and weak.

Recent Development and News in Desalination Market

  • In January 2024, IDE Technologies, a leading desalination technology provider, announced the successful commissioning of the world's largest reverse osmosis desalination plant in Israel, with a capacity of 250 million gallons per day (MGD) (IDE Technologies Press Release, 2024). This marked a significant advancement in large-scale desalination capabilities.
  • In March 2024, Veolia Water Technologies and Mitsubishi Heavy Industries (MHI) formed a strategic partnership to jointly develop and commercialize innovative desalination technologies, combining Veolia's expertise in water treatment and MHI's engineering capabilities (Veolia Water Technologies Press Release, 2024).
  • In May 2024, the Abu Dhabi National Oil Company (ADNOC) and the Abu Dhabi Water & Electricity Authority (ADWEA) signed a Memorandum of Understanding (MoU) to collaborate on desalination projects, aiming to increase the emirate's water self-sufficiency and reduce reliance on fossil fuels for water production (ADNOC Press Release, 2024).
  • In April 2025, the Saudi Arabian desalination company, Marafiq, raised USD500 million in a bond issuance to fund the expansion of its desalination capacity, highlighting the growing investor interest in the sector (Bloomberg, 2025).

Research Analyst Overview

  • The market is driven by the increasing demand for high-quality water treatment solutions, particularly in regions with water scarcity issues. Material science advancements continue to improve permeate quality, enabling more efficient water treatment processes. Pretreatment optimization and osmotic pressure management are key areas of focus for desalination plant operators, requiring skill development and regulatory compliance. Renewable energy integration and hybrid desalination systems are gaining traction, reducing reliance on traditional energy sources and improving system efficiency. Public acceptance is a critical factor in market growth, necessitating effective communication and transparency regarding water reuse, greywater treatment, and water rights. Economic analysis, lifecycle assessment, and financial modeling are essential tools for desalination plant developers, ensuring optimal system performance and long-term profitability.
  • Energy recovery technologies, such as pump efficiency and hydraulic pressure optimization, play a significant role in reducing energy consumption and costs. Regulatory compliance, water allocation, and process engineering are crucial aspects of desalination plant operation, requiring ongoing system optimization and membrane cleaning cycles. Membrane life and chemical dosage management are essential for maintaining membrane performance and minimizing rejection rates. Pressure vessels, energy storage, and wastewater reclamation are integral components of desalination systems, requiring careful management and maintenance. Water pricing and social impact are also important considerations, as desalination projects can have significant economic and societal implications.

Dive into Technavio's robust research methodology, blending expert interviews, extensive data synthesis, and validated models for unparalleled Desalination Market insights. See full methodology.

Market Scope

Report Coverage

Details

Page number

219

Base year

2024

Historic period

2019-2023

Forecast period

2025-2029

Growth momentum & CAGR

Accelerate at a CAGR of 8.9%

Market growth 2025-2029

USD 10413.2 million

Market structure

Fragmented

YoY growth 2024-2025(%)

8.0

Key countries

Saudi Arabia, US, Canada, Germany, UK, Italy, France, China, India, Japan, Brazil, Egypt, UAE, Oman, Argentina, KSA, UAE, Brazil, and Rest of World (ROW)

Competitive landscape

Leading Companies, Market Positioning of Companies, Competitive Strategies, and Industry Risks

Request Free Sample

What are the Key Data Covered in this Desalination Market Research and Growth Report?

  • CAGR of the Desalination industry during the forecast period
  • Detailed information on factors that will drive the growth and forecasting between 2025 and 2029
  • Precise estimation of the size of the market and its contribution of the industry in focus to the parent market
  • Accurate predictions about upcoming growth and trends and changes in consumer behaviour
  • Growth of the market across Middle East and Africa, APAC, North America, Europe, and South America
  • Thorough analysis of the market's competitive landscape and detailed information about companies
  • Comprehensive analysis of factors that will challenge the desalination market growth of industry companies

We can help! Our analysts can customize this desalination market research report to meet your requirements.

Get in touch

1 Executive Summary

  • 1.1 Market overview
    • Executive Summary - Chart on Market Overview
    • Executive Summary - Data Table on Market Overview
    • Executive Summary - Chart on Global Market Characteristics
    • Executive Summary - Chart on Market by Geography
    • Executive Summary - Chart on Market Segmentation by Technology
    • Executive Summary - Chart on Market Segmentation by Application
    • Executive Summary - Chart on Market Segmentation by Source
    • Executive Summary - Chart on Incremental Growth
    • Executive Summary - Data Table on Incremental Growth
    • Executive Summary - Chart on Company Market Positioning

2 Technavio Analysis

  • 2.1 Analysis of price sensitivity, lifecycle, customer purchase basket, adoption rates, and purchase criteria
    • Analysis of price sensitivity, lifecycle, customer purchase basket, adoption rates, and purchase criteria
  • 2.2 Criticality of inputs and Factors of differentiation
    • Overview on criticality of inputs and factors of differentiation
  • 2.3 Factors of disruption
    • Overview on factors of disruption
  • 2.4 Impact of drivers and challenges
    • Impact of drivers and challenges in 2024 and 2029

3 Market Landscape

  • 3.1 Market ecosystem
    • Parent Market
    • Data Table on - Parent Market
  • 3.2 Market characteristics
    • Market characteristics analysis
  • 3.3 Value chain analysis
    • Value chain analysis

4 Market Sizing

  • 4.1 Market definition
    • Offerings of companies included in the market definition
  • 4.2 Market segment analysis
    • Market segments
  • 4.3 Market size 2024
    • 4.4 Market outlook: Forecast for 2024-2029
      • Chart on Global - Market size and forecast 2024-2029 ($ million)
      • Data Table on Global - Market size and forecast 2024-2029 ($ million)
      • Chart on Global Market: Year-over-year growth 2024-2029 (%)
      • Data Table on Global Market: Year-over-year growth 2024-2029 (%)

    5 Historic Market Size

    • 5.1 Global Desalination Market 2019 - 2023
      • Historic Market Size - Data Table on Global Desalination Market 2019 - 2023 ($ million)
    • 5.2 Technology segment analysis 2019 - 2023
      • Historic Market Size - Technology Segment 2019 - 2023 ($ million)
    • 5.3 Application segment analysis 2019 - 2023
      • Historic Market Size - Application Segment 2019 - 2023 ($ million)
    • 5.4 Source segment analysis 2019 - 2023
      • Historic Market Size - Source Segment 2019 - 2023 ($ million)
    • 5.5 Geography segment analysis 2019 - 2023
      • Historic Market Size - Geography Segment 2019 - 2023 ($ million)
    • 5.6 Country segment analysis 2019 - 2023
      • Historic Market Size - Country Segment 2019 - 2023 ($ million)

    6 Qualitative Analysis

    • 6.1 The impact of AI in global desalination market

      7 Five Forces Analysis

      • 7.1 Five forces summary
        • Five forces analysis - Comparison between 2024 and 2029
      • 7.2 Bargaining power of buyers
        • Bargaining power of buyers - Impact of key factors 2024 and 2029
      • 7.3 Bargaining power of suppliers
        • Bargaining power of suppliers - Impact of key factors in 2024 and 2029
      • 7.4 Threat of new entrants
        • Threat of new entrants - Impact of key factors in 2024 and 2029
      • 7.5 Threat of substitutes
        • Threat of substitutes - Impact of key factors in 2024 and 2029
      • 7.6 Threat of rivalry
        • Threat of rivalry - Impact of key factors in 2024 and 2029
      • 7.7 Market condition
        • Chart on Market condition - Five forces 2024 and 2029

      8 Market Segmentation by Technology

      • 8.1 Market segments
        • Chart on Technology - Market share (2024-2029) (%)
        • Data Table on Technology - Market share (2024-2029) (%)
      • 8.2 Comparison by Technology
        • Chart on Comparison by Technology
        • Data Table on Comparison by Technology
      • 8.3 Membrane - Market size and forecast (2024-2029)
        • Chart on Membrane - Market size and forecast (2024-2029) ($ million)
        • Data Table on Membrane - Market size and forecast (2024-2029) ($ million)
        • Chart on Membrane - Year-over-year growth (2024-2029) (%)
        • Data Table on Membrane - Year-over-year growth (2024-2029) (%)
      • 8.4 Thermal - Market size and forecast (2024-2029)
        • Chart on Thermal - Market size and forecast (2024-2029) ($ million)
        • Data Table on Thermal - Market size and forecast (2024-2029) ($ million)
        • Chart on Thermal - Year-over-year growth (2024-2029) (%)
        • Data Table on Thermal - Year-over-year growth (2024-2029) (%)
      • 8.5 Market opportunity by Technology
        • Market opportunity by Technology ($ million)
        • Data Table on Market opportunity by Technology ($ million)

      9 Market Segmentation by Application

      • 9.1 Market segments
        • Chart on Application - Market share (2024-2029) (%)
        • Data Table on Application - Market share (2024-2029) (%)
      • 9.2 Comparison by Application
        • Chart on Comparison by Application
        • Data Table on Comparison by Application
      • 9.3 Municipal - Market size and forecast (2024-2029)
        • Chart on Municipal - Market size and forecast (2024-2029) ($ million)
        • Data Table on Municipal - Market size and forecast (2024-2029) ($ million)
        • Chart on Municipal - Year-over-year growth (2024-2029) (%)
        • Data Table on Municipal - Year-over-year growth (2024-2029) (%)
      • 9.4 Industrial - Market size and forecast (2024-2029)
        • Chart on Industrial - Market size and forecast (2024-2029) ($ million)
        • Data Table on Industrial - Market size and forecast (2024-2029) ($ million)
        • Chart on Industrial - Year-over-year growth (2024-2029) (%)
        • Data Table on Industrial - Year-over-year growth (2024-2029) (%)
      • 9.5 Others - Market size and forecast (2024-2029)
        • Chart on Others - Market size and forecast (2024-2029) ($ million)
        • Data Table on Others - Market size and forecast (2024-2029) ($ million)
        • Chart on Others - Year-over-year growth (2024-2029) (%)
        • Data Table on Others - Year-over-year growth (2024-2029) (%)
      • 9.6 Market opportunity by Application
        • Market opportunity by Application ($ million)
        • Data Table on Market opportunity by Application ($ million)

      10 Market Segmentation by Source

      • 10.1 Market segments
        • Chart on Source - Market share (2024-2029) (%)
        • Data Table on Source - Market share (2024-2029) (%)
      • 10.2 Comparison by Source
        • Chart on Comparison by Source
        • Data Table on Comparison by Source
      • 10.3 Seawater - Market size and forecast (2024-2029)
        • Chart on Seawater - Market size and forecast (2024-2029) ($ million)
        • Data Table on Seawater - Market size and forecast (2024-2029) ($ million)
        • Chart on Seawater - Year-over-year growth (2024-2029) (%)
        • Data Table on Seawater - Year-over-year growth (2024-2029) (%)
      • 10.4 Brackish water - Market size and forecast (2024-2029)
        • Chart on Brackish water - Market size and forecast (2024-2029) ($ million)
        • Data Table on Brackish water - Market size and forecast (2024-2029) ($ million)
        • Chart on Brackish water - Year-over-year growth (2024-2029) (%)
        • Data Table on Brackish water - Year-over-year growth (2024-2029) (%)
      • 10.5 Market opportunity by Source
        • Market opportunity by Source ($ million)
        • Data Table on Market opportunity by Source ($ million)

      11 Market Segmentation by Plant Type

      • 11.1 Market segments
        • Chart on Plant Type - Market share (2024-2029) (%)
        • Data Table on Plant Type - Market share (2024-2029) (%)
      • 11.2 Comparison by Plant Type
        • Chart on Comparison by Plant Type
        • Data Table on Comparison by Plant Type
      • 11.3 Large Scale - Market size and forecast (2024-2029)
        • Chart on Large Scale - Market size and forecast (2024-2029) ($ million)
        • Data Table on Large Scale - Market size and forecast (2024-2029) ($ million)
        • Chart on Large Scale - Year-over-year growth (2024-2029) (%)
        • Data Table on Large Scale - Year-over-year growth (2024-2029) (%)
      • 11.4 Medium Scale - Market size and forecast (2024-2029)
        • Chart on Medium Scale - Market size and forecast (2024-2029) ($ million)
        • Data Table on Medium Scale - Market size and forecast (2024-2029) ($ million)
        • Chart on Medium Scale - Year-over-year growth (2024-2029) (%)
        • Data Table on Medium Scale - Year-over-year growth (2024-2029) (%)
      • 11.5 Small Scale - Market size and forecast (2024-2029)
        • Chart on Small Scale - Market size and forecast (2024-2029) ($ million)
        • Data Table on Small Scale - Market size and forecast (2024-2029) ($ million)
        • Chart on Small Scale - Year-over-year growth (2024-2029) (%)
        • Data Table on Small Scale - Year-over-year growth (2024-2029) (%)
      • 11.6 Mobile/Containerized - Market size and forecast (2024-2029)
        • Chart on Mobile/Containerized - Market size and forecast (2024-2029) ($ million)
        • Data Table on Mobile/Containerized - Market size and forecast (2024-2029) ($ million)
        • Chart on Mobile/Containerized - Year-over-year growth (2024-2029) (%)
        • Data Table on Mobile/Containerized - Year-over-year growth (2024-2029) (%)
      • 11.7 Market opportunity by Plant Type
        • Market opportunity by Plant Type ($ million)
        • Data Table on Market opportunity by Plant Type ($ million)

      12 Market Segmentation by Component

      • 12.1 Market segments
        • Chart on Component - Market share (2024-2029) (%)
        • Data Table on Component - Market share (2024-2029) (%)
      • 12.2 Comparison by Component
        • Chart on Comparison by Component
        • Data Table on Comparison by Component
      • 12.3 Pumps - Market size and forecast (2024-2029)
        • Chart on Pumps - Market size and forecast (2024-2029) ($ million)
        • Data Table on Pumps - Market size and forecast (2024-2029) ($ million)
        • Chart on Pumps - Year-over-year growth (2024-2029) (%)
        • Data Table on Pumps - Year-over-year growth (2024-2029) (%)
      • 12.4 Membranes - Market size and forecast (2024-2029)
        • Chart on Membranes - Market size and forecast (2024-2029) ($ million)
        • Data Table on Membranes - Market size and forecast (2024-2029) ($ million)
        • Chart on Membranes - Year-over-year growth (2024-2029) (%)
        • Data Table on Membranes - Year-over-year growth (2024-2029) (%)
      • 12.5 Energy Recovery Devices - Market size and forecast (2024-2029)
        • Chart on Energy Recovery Devices - Market size and forecast (2024-2029) ($ million)
        • Data Table on Energy Recovery Devices - Market size and forecast (2024-2029) ($ million)
        • Chart on Energy Recovery Devices - Year-over-year growth (2024-2029) (%)
        • Data Table on Energy Recovery Devices - Year-over-year growth (2024-2029) (%)
      • 12.6 Pre-treatment Systems - Market size and forecast (2024-2029)
        • Chart on Pre-treatment Systems - Market size and forecast (2024-2029) ($ million)
        • Data Table on Pre-treatment Systems - Market size and forecast (2024-2029) ($ million)
        • Chart on Pre-treatment Systems - Year-over-year growth (2024-2029) (%)
        • Data Table on Pre-treatment Systems - Year-over-year growth (2024-2029) (%)
      • 12.7 Post-treatment Systems - Market size and forecast (2024-2029)
        • Chart on Post-treatment Systems - Market size and forecast (2024-2029) ($ million)
        • Data Table on Post-treatment Systems - Market size and forecast (2024-2029) ($ million)
        • Chart on Post-treatment Systems - Year-over-year growth (2024-2029) (%)
        • Data Table on Post-treatment Systems - Year-over-year growth (2024-2029) (%)
      • 12.8 Market opportunity by Component
        • Market opportunity by Component ($ million)
        • Data Table on Market opportunity by Component ($ million)

      13 Customer Landscape

      • 13.1 Customer landscape overview
        • Analysis of price sensitivity, lifecycle, customer purchase basket, adoption rates, and purchase criteria

      14 Geographic Landscape

      • 14.1 Geographic segmentation
        • Chart on Market share by geography 2024-2029 (%)
        • Data Table on Market share by geography 2024-2029 (%)
      • 14.2 Geographic comparison
        • Chart on Geographic comparison
        • Data Table on Geographic comparison
      • 14.3 Middle East and Africa - Market size and forecast 2024-2029
        • Chart on Middle East and Africa - Market size and forecast 2024-2029 ($ million)
        • Data Table on Middle East and Africa - Market size and forecast 2024-2029 ($ million)
        • Chart on Middle East and Africa - Year-over-year growth 2024-2029 (%)
        • Data Table on Middle East and Africa - Year-over-year growth 2024-2029 (%)
      • 14.4 APAC - Market size and forecast 2024-2029
        • Chart on APAC - Market size and forecast 2024-2029 ($ million)
        • Data Table on APAC - Market size and forecast 2024-2029 ($ million)
        • Chart on APAC - Year-over-year growth 2024-2029 (%)
        • Data Table on APAC - Year-over-year growth 2024-2029 (%)
      • 14.5 North America - Market size and forecast 2024-2029
        • Chart on North America - Market size and forecast 2024-2029 ($ million)
        • Data Table on North America - Market size and forecast 2024-2029 ($ million)
        • Chart on North America - Year-over-year growth 2024-2029 (%)
        • Data Table on North America - Year-over-year growth 2024-2029 (%)
      • 14.6 Europe - Market size and forecast 2024-2029
        • Chart on Europe - Market size and forecast 2024-2029 ($ million)
        • Data Table on Europe - Market size and forecast 2024-2029 ($ million)
        • Chart on Europe - Year-over-year growth 2024-2029 (%)
        • Data Table on Europe - Year-over-year growth 2024-2029 (%)
      • 14.7 South America - Market size and forecast 2024-2029
        • Chart on South America - Market size and forecast 2024-2029 ($ million)
        • Data Table on South America - Market size and forecast 2024-2029 ($ million)
        • Chart on South America - Year-over-year growth 2024-2029 (%)
        • Data Table on South America - Year-over-year growth 2024-2029 (%)
      • 14.8 Saudi Arabia - Market size and forecast 2024-2029
        • Chart on Saudi Arabia - Market size and forecast 2024-2029 ($ million)
        • Data Table on Saudi Arabia - Market size and forecast 2024-2029 ($ million)
        • Chart on Saudi Arabia - Year-over-year growth 2024-2029 (%)
        • Data Table on Saudi Arabia - Year-over-year growth 2024-2029 (%)
      • 14.9 United Arab Emirates - Market size and forecast 2024-2029
        • Chart on United Arab Emirates - Market size and forecast 2024-2029 ($ million)
        • Data Table on United Arab Emirates - Market size and forecast 2024-2029 ($ million)
        • Chart on United Arab Emirates - Year-over-year growth 2024-2029 (%)
        • Data Table on United Arab Emirates - Year-over-year growth 2024-2029 (%)
      • 14.10 US - Market size and forecast 2024-2029
        • Chart on US - Market size and forecast 2024-2029 ($ million)
        • Data Table on US - Market size and forecast 2024-2029 ($ million)
        • Chart on US - Year-over-year growth 2024-2029 (%)
        • Data Table on US - Year-over-year growth 2024-2029 (%)
      • 14.11 South Africa - Market size and forecast 2024-2029
        • Chart on South Africa - Market size and forecast 2024-2029 ($ million)
        • Data Table on South Africa - Market size and forecast 2024-2029 ($ million)
        • Chart on South Africa - Year-over-year growth 2024-2029 (%)
        • Data Table on South Africa - Year-over-year growth 2024-2029 (%)
      • 14.12 China - Market size and forecast 2024-2029
        • Chart on China - Market size and forecast 2024-2029 ($ million)
        • Data Table on China - Market size and forecast 2024-2029 ($ million)
        • Chart on China - Year-over-year growth 2024-2029 (%)
        • Data Table on China - Year-over-year growth 2024-2029 (%)
      • 14.13 Egypt - Market size and forecast 2024-2029
        • Chart on Egypt - Market size and forecast 2024-2029 ($ million)
        • Data Table on Egypt - Market size and forecast 2024-2029 ($ million)
        • Chart on Egypt - Year-over-year growth 2024-2029 (%)
        • Data Table on Egypt - Year-over-year growth 2024-2029 (%)
      • 14.14 Japan - Market size and forecast 2024-2029
        • Chart on Japan - Market size and forecast 2024-2029 ($ million)
        • Data Table on Japan - Market size and forecast 2024-2029 ($ million)
        • Chart on Japan - Year-over-year growth 2024-2029 (%)
        • Data Table on Japan - Year-over-year growth 2024-2029 (%)
      • 14.15 Nigeria - Market size and forecast 2024-2029
        • Chart on Nigeria - Market size and forecast 2024-2029 ($ million)
        • Data Table on Nigeria - Market size and forecast 2024-2029 ($ million)
        • Chart on Nigeria - Year-over-year growth 2024-2029 (%)
        • Data Table on Nigeria - Year-over-year growth 2024-2029 (%)
      • 14.16 South Korea - Market size and forecast 2024-2029
        • Chart on South Korea - Market size and forecast 2024-2029 ($ million)
        • Data Table on South Korea - Market size and forecast 2024-2029 ($ million)
        • Chart on South Korea - Year-over-year growth 2024-2029 (%)
        • Data Table on South Korea - Year-over-year growth 2024-2029 (%)
      • 14.17 India - Market size and forecast 2024-2029
        • Chart on India - Market size and forecast 2024-2029 ($ million)
        • Data Table on India - Market size and forecast 2024-2029 ($ million)
        • Chart on India - Year-over-year growth 2024-2029 (%)
        • Data Table on India - Year-over-year growth 2024-2029 (%)
      • 14.18 Market opportunity by geography
        • Market opportunity by geography ($ million)
        • Data Tables on Market opportunity by geography ($ million)
      • 14.19 Canada - Market size and forecast (2024-2029)
        • Chart on Canada - Market size and forecast (2024-2029) ($ million)
        • Data Table on Canada - Market size and forecast (2024-2029) ($ million)
        • Chart on Canada - Year-over-year growth (2024-2029) (%)
        • Data Table on Canada - Year-over-year growth (2024-2029) (%)
      • 14.20 Germany - Market size and forecast (2024-2029)
        • Chart on Germany - Market size and forecast (2024-2029) ($ million)
        • Data Table on Germany - Market size and forecast (2024-2029) ($ million)
        • Chart on Germany - Year-over-year growth (2024-2029) (%)
        • Data Table on Germany - Year-over-year growth (2024-2029) (%)
      • 14.21 UK - Market size and forecast (2024-2029)
        • Chart on UK - Market size and forecast (2024-2029) ($ million)
        • Data Table on UK - Market size and forecast (2024-2029) ($ million)
        • Chart on UK - Year-over-year growth (2024-2029) (%)
        • Data Table on UK - Year-over-year growth (2024-2029) (%)
      • 14.22 Italy - Market size and forecast (2024-2029)
        • Chart on Italy - Market size and forecast (2024-2029) ($ million)
        • Data Table on Italy - Market size and forecast (2024-2029) ($ million)
        • Chart on Italy - Year-over-year growth (2024-2029) (%)
        • Data Table on Italy - Year-over-year growth (2024-2029) (%)
      • 14.23 France - Market size and forecast (2024-2029)
        • Chart on France - Market size and forecast (2024-2029) ($ million)
        • Data Table on France - Market size and forecast (2024-2029) ($ million)
        • Chart on France - Year-over-year growth (2024-2029) (%)
        • Data Table on France - Year-over-year growth (2024-2029) (%)
      • 14.24 Brazil - Market size and forecast (2024-2029)
        • Chart on Brazil - Market size and forecast (2024-2029) ($ million)
        • Data Table on Brazil - Market size and forecast (2024-2029) ($ million)
        • Chart on Brazil - Year-over-year growth (2024-2029) (%)
        • Data Table on Brazil - Year-over-year growth (2024-2029) (%)
      • 14.25 UAE - Market size and forecast (2024-2029)
        • Chart on UAE - Market size and forecast (2024-2029) ($ million)
        • Data Table on UAE - Market size and forecast (2024-2029) ($ million)
        • Chart on UAE - Year-over-year growth (2024-2029) (%)
        • Data Table on UAE - Year-over-year growth (2024-2029) (%)
      • 14.26 Oman - Market size and forecast (2024-2029)
        • Chart on Oman - Market size and forecast (2024-2029) ($ million)
        • Data Table on Oman - Market size and forecast (2024-2029) ($ million)
        • Chart on Oman - Year-over-year growth (2024-2029) (%)
        • Data Table on Oman - Year-over-year growth (2024-2029) (%)
      • 14.27 Argentina - Market size and forecast (2024-2029)
        • Chart on Argentina - Market size and forecast (2024-2029) ($ million)
        • Data Table on Argentina - Market size and forecast (2024-2029) ($ million)
        • Chart on Argentina - Year-over-year growth (2024-2029) (%)
        • Data Table on Argentina - Year-over-year growth (2024-2029) (%)
      • 14.28 KSA - Market size and forecast (2024-2029)
        • Chart on KSA - Market size and forecast (2024-2029) ($ million)
        • Data Table on KSA - Market size and forecast (2024-2029) ($ million)
        • Chart on KSA - Year-over-year growth (2024-2029) (%)
        • Data Table on KSA - Year-over-year growth (2024-2029) (%)
      • 14.29 Rest of World (ROW) - Market size and forecast (2024-2029)
        • Chart on Rest of World (ROW) - Market size and forecast (2024-2029) ($ million)
        • Data Table on Rest of World (ROW) - Market size and forecast (2024-2029) ($ million)
        • Chart on Rest of World (ROW) - Year-over-year growth (2024-2029) (%)
        • Data Table on Rest of World (ROW) - Year-over-year growth (2024-2029) (%)

      15 Drivers, Challenges, and Opportunity/Restraints

      • 15.1 Market drivers
        • 15.2 Market challenges
          • 15.3 Impact of drivers and challenges
            • Impact of drivers and challenges in 2024 and 2029
          • 15.4 Market opportunities/restraints

            16 Competitive Landscape

            • 16.1 Overview
              • 16.2 Competitive Landscape
                • Overview on criticality of inputs and factors of differentiation
              • 16.3 Landscape disruption
                • Overview on factors of disruption
              • 16.4 Industry risks
                • Impact of key risks on business

              17 Competitive Analysis

              • 17.1 Companies profiled
                • Companies covered
              • 17.2 Company ranking index
                • Company ranking index
              • 17.3 Market positioning of companies
                • Matrix on companies position and classification
              • 17.4 Acciona SA
                • Acciona SA - Overview
                • Acciona SA - Business segments
                • Acciona SA - Key news
                • Acciona SA - Key offerings
                • Acciona SA - Segment focus
                • SWOT
              • 17.5 Asahi Kasei Corp.
                • Asahi Kasei Corp. - Overview
                • Asahi Kasei Corp. - Business segments
                • Asahi Kasei Corp. - Key news
                • Asahi Kasei Corp. - Key offerings
                • Asahi Kasei Corp. - Segment focus
                • SWOT
              • 17.6 Bechtel Corp.
                • Bechtel Corp. - Overview
                • Bechtel Corp. - Product / Service
                • Bechtel Corp. - Key news
                • Bechtel Corp. - Key offerings
                • SWOT
              • 17.7 Biwater Holdings Ltd.
                • Biwater Holdings Ltd. - Overview
                • Biwater Holdings Ltd. - Product / Service
                • Biwater Holdings Ltd. - Key offerings
                • SWOT
              • 17.8 Consolidated Water Co. Ltd.
                • Consolidated Water Co. Ltd. - Overview
                • Consolidated Water Co. Ltd. - Business segments
                • Consolidated Water Co. Ltd. - Key offerings
                • Consolidated Water Co. Ltd. - Segment focus
                • SWOT
              • 17.9 Doosan Corp.
                • Doosan Corp. - Overview
                • Doosan Corp. - Business segments
                • Doosan Corp. - Key news
                • Doosan Corp. - Key offerings
                • Doosan Corp. - Segment focus
                • SWOT
              • 17.10 DuPont de Nemours Inc.
                • DuPont de Nemours Inc. - Overview
                • DuPont de Nemours Inc. - Business segments
                • DuPont de Nemours Inc. - Key news
                • DuPont de Nemours Inc. - Key offerings
                • DuPont de Nemours Inc. - Segment focus
                • SWOT
              • 17.11 Ferrovial SA
                • Ferrovial SA - Overview
                • Ferrovial SA - Business segments
                • Ferrovial SA - Key offerings
                • Ferrovial SA - Segment focus
                • SWOT
              • 17.12 IDE Water Technologies
                • IDE Water Technologies - Overview
                • IDE Water Technologies - Product / Service
                • IDE Water Technologies - Key offerings
                • SWOT
              • 17.13 Kurita Water Industries Ltd
                • Kurita Water Industries Ltd - Overview
                • Kurita Water Industries Ltd - Business segments
                • Kurita Water Industries Ltd - Key offerings
                • Kurita Water Industries Ltd - Segment focus
                • SWOT
              • 17.14 Mitsubishi Heavy Industries Ltd.
                • Mitsubishi Heavy Industries Ltd. - Overview
                • Mitsubishi Heavy Industries Ltd. - Business segments
                • Mitsubishi Heavy Industries Ltd. - Key news
                • Mitsubishi Heavy Industries Ltd. - Key offerings
                • Mitsubishi Heavy Industries Ltd. - Segment focus
                • SWOT
              • 17.15 Poseidon Water LLC
                • Poseidon Water LLC - Overview
                • Poseidon Water LLC - Product / Service
                • Poseidon Water LLC - Key offerings
                • SWOT
              • 17.16 RAI Amsterdam Aquatech
                • RAI Amsterdam Aquatech - Overview
                • RAI Amsterdam Aquatech - Product / Service
                • RAI Amsterdam Aquatech - Key offerings
                • SWOT
              • 17.17 Toyobo Co. Ltd.
                • Toyobo Co. Ltd. - Overview
                • Toyobo Co. Ltd. - Business segments
                • Toyobo Co. Ltd. - Key news
                • Toyobo Co. Ltd. - Key offerings
                • Toyobo Co. Ltd. - Segment focus
                • SWOT
              • 17.18 Veolia Environnement SA
                • Veolia Environnement SA - Overview
                • Veolia Environnement SA - Business segments
                • Veolia Environnement SA - Key offerings
                • Veolia Environnement SA - Segment focus
                • SWOT

              18 Appendix

              • 18.1 Scope of the report
                • 18.2 Inclusions and exclusions checklist
                  • Inclusions checklist
                  • Exclusions checklist
                • 18.3 Currency conversion rates for US$
                  • Currency conversion rates for US$
                • 18.4 Research methodology
                  • Research methodology
                • 18.5 Data procurement
                  • Information sources
                • 18.6 Data validation
                  • Data validation
                • 18.7 Validation techniques employed for market sizing
                  • Validation techniques employed for market sizing
                • 18.8 Data synthesis
                  • Data synthesis
                • 18.9 360 degree market analysis
                  • 360 degree market analysis
                • 18.10 List of abbreviations
                  • List of abbreviations

                Research Methodology

                Technavio presents a detailed picture of the market by way of study, synthesis, and summation of data from multiple sources. The analysts have presented the various facets of the market with a particular focus on identifying the key industry influencers. The data thus presented is comprehensive, reliable, and the result of extensive research, both primary and secondary.

                INFORMATION SOURCES

                Primary sources

                • Manufacturers and suppliers
                • Channel partners
                • Industry experts
                • Strategic decision makers

                Secondary sources

                • Industry journals and periodicals
                • Government data
                • Financial reports of key industry players
                • Historical data
                • Press releases

                DATA ANALYSIS

                Data Synthesis

                • Collation of data
                • Estimation of key figures
                • Analysis of derived insights

                Data Validation

                • Triangulation with data models
                • Reference against proprietary databases
                • Corroboration with industry experts

                REPORT WRITING

                Qualitative

                • Market drivers
                • Market challenges
                • Market trends
                • Five forces analysis

                Quantitative

                • Market size and forecast
                • Market segmentation
                • Geographical insights
                • Competitive landscape

                Interested in this report?

                Get your sample now to see our research methodology and insights!

                Download Now

                Frequently Asked Questions

                Desalination market growth will increase by $ 10413.2 mn during 2025-2029.

                The Desalination market is expected to grow at a CAGR of 8.9% during 2025-2029.

                Desalination market is segmented by Technology( Membrane, Thermal) Application( Municipal, Industrial, Others, Europe, South America) Source( Seawater, Brackish water, North America, Europe, South America)

                Acciona SA, Asahi Kasei Corp., Bechtel Corp., Biwater Holdings Ltd., Consolidated Water Co. Ltd., Doosan Corp., DuPont de Nemours Inc., Ferrovial SA, IDE Water Technologies, Kurita Water Industries Ltd, Mitsubishi Heavy Industries Ltd., Osmoflo, Poseidon Water LLC, ProMinent GmbH, RAI Amsterdam Aquatech, TEMAK SA, Toyobo Co. Ltd., Veolia Environnement SA, Webuild are a few of the key vendors in the Desalination market.

                Middle East and Africa will register the highest growth rate of 60% among the other regions. Therefore, the Desalination market in Middle East and Africa is expected to garner significant business opportunities for the vendors during the forecast period.

                Saudi Arabia, US, Canada, Germany, UK, Italy, France, China, India, Japan, Brazil, Egypt, UAE, Oman, Argentina, KSA, UAE, Brazil, Rest of World (ROW)

                • Increase in population and rise in demand for consumable waterThe rising global population and increasing demand for consumable water are the key factors that drive the growth of the global desalination market. By 2050 is the driving factor this market.
                • according to the World Bank Group is the driving factor this market.
                • the global population is anticipated to reach 9.73 billion is the driving factor this market.
                • and only 2.2 billion people by the first half of 2022 had access to safe consumable water. Globally is the driving factor this market.
                • freshwater reserves are unevenly distributed is the driving factor this market.
                • and of which the demand for desalination will witness an increase over the forecast period. The majority of water available in nature is not potable is the driving factor this market.
                • as it contains various contaminants such as factory waste is the driving factor this market.
                • pollutants is the driving factor this market.
                • and pathogenic bacteria and microorganisms. This scarcity of safe is the driving factor this market.
                • usable water has created the demand for water recycling is the driving factor this market.
                • thereby increasing the demand for desalination and treatment. The increasing demand for clean water is mainly due to the rise in population and dietary changes. Clean water is extensively used in the global agricultural sector. The demand for water in the industrial and energy sectors accounts for around 20% of the global demand. For other purposes is the driving factor this market.
                • such as raw materials for solvent processing is the driving factor this market.
                • steam generation is the driving factor this market.
                • and heating and cooling systems is the driving factor this market.
                • the demand accounts for around 10%. The fast-paced depletion of freshwater resources is projecting the need for stringent regulations on water consumption and its discharges. As a result of the scarcity is the driving factor this market.
                • industries and organizations are obliged to treat and recycle wastewater before discharging it. Coastal communities and cities are increasingly depending on seawater to meet their drinking water requirements is the driving factor this market.
                • while inland groundwater resources have a rising tendency to become brackish over a period of time. Urbanization is the driving factor this market.
                • which is one of the most important demographic trends is the driving factor this market.
                • also drives the demand for clean water. According to the World Bank Group is the driving factor this market.
                • the population in urban areas is expected to reach 6.3 billion by 2050 is the driving factor this market.
                • accounting for 70% of the global population. In order to meet the requirements of the surging population is the driving factor this market.
                • the amount of consumable and clean water is the driving factor this market.
                • which can be obtained through desalination is the driving factor this market.
                • should be adequate. Desalination is gaining traction as one of the imperative methods to meet the rising need for freshwater for various domestic is the driving factor this market.
                • industrial is the driving factor this market.
                • and agricultural purposes. The desalination process is mainly implemented on sources such as seawater is the driving factor this market.
                • brackish water is the driving factor this market.
                • wells is the driving factor this market.
                • surface water is the driving factor this market.
                • wastewater is the driving factor this market.
                • and industrial process water. Around 98% of the global water resources are salty is the driving factor this market.
                • and more than 60% of the desalination capacity is produced from seawater. The increasing global population is the driving factor this market.
                • coupled with rapid urbanization is the driving factor this market.
                • industrialization is the driving factor this market.
                • and pollution is the driving factor this market.
                • would trigger the demand for clean and consumable water; this would enhance the growth of the global desalination market during the forecast period. is the driving factor this market.

                The Desalination market vendors should focus on grabbing business opportunities from the Membrane segment as it accounted for the largest market share in the base year.