Bioreactors Market Analysis, Size, and Forecast 2025-2029: North America (US and Canada), Europe (France, Germany, Italy, and UK), APAC (China, India, and Japan), South America (Brazil), and Rest of World (ROW)

Bioreactors Market Analysis, Size, and Forecast 2025-2029:
North America (US and Canada), Europe (France, Germany, Italy, and UK), APAC (China, India, and Japan), South America (Brazil), and Rest of World (ROW)

Published: Aug 2025 214 Pages SKU: IRTNTR44736

Market Overview at a Glance

$3.00 B
Market Opportunity
7.3%
CAGR
6.7
YoY growth 2024-2025(%)

Bioreactors Market Size 2025-2029

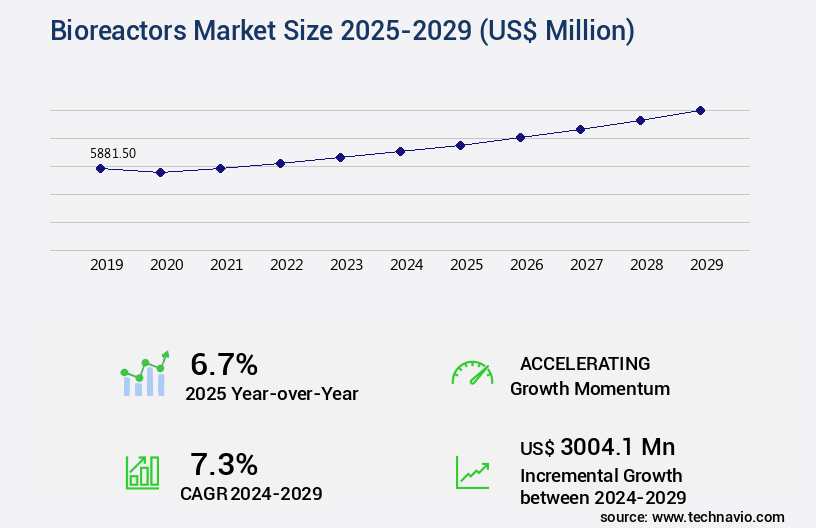
The bioreactors market size is valued to increase by USD 3 billion, at a CAGR of 7.3% from 2024 to 2029. Growing demand for single-use bioreactors will drive the bioreactors market.

Market Insights

  • Asia dominated the market and accounted for a 30% growth during the 2025-2029.
  • By End-user - Biopharmaceutical segment was valued at USD 2.56 billion in 2023
  • By Type - Automated segment accounted for the largest market revenue share in 2023

Market Size & Forecast

  • Market Opportunities: USD 71.44 million 
  • Market Future Opportunities 2024: USD 3004.10 million
  • CAGR from 2024 to 2029 : 7.3%

Market Summary

  • The market is experiencing significant growth due to the increasing demand for single-use bioreactors in various industries, including pharmaceuticals, biotechnology, and food and beverage. This trend is driven by the advantages offered by single-use bioreactors, such as reduced time-to-market, improved product quality, and cost savings. The emergence of startups and continuous technological advances by established players are further fueling market growth. One real-world business scenario illustrating the benefits of bioreactors is supply chain optimization in the pharmaceutical industry. A leading pharmaceutical company implemented a continuous bioprocessing system using single-use bioreactors, reducing the production cycle time by 30%.
  • This improvement enabled the company to meet increasing demand for its products while maintaining high product quality. However, the market also faces challenges, particularly in the area of ethical concerns related to bioprocessing of stem cells for regenerative medicine. As regulatory bodies continue to set guidelines for ethical and safe bioprocessing practices, companies must invest in research and development to ensure compliance. A comparative statistic highlighting the impact of bioreactors on operational efficiency is the uptime improvement of 18% achieved by a biotechnology company after implementing a single-use bioreactor system. This enhancement in system availability led to increased productivity and cost savings for the company.

What will be the size of the Bioreactors Market during the forecast period?

Bioreactors Market Size

Get Key Insights on Market Forecast (PDF) Request Free Sample

  • The market continues to evolve, driven by advancements in technology and increasing demand for large-scale production of biopharmaceuticals and industrial bioproducts. This growth is fueled by the need for cost reduction, process optimization, and regulatory compliance in the biotech industry. One trend shaping the market is the adoption of perfusion bioprocessing, which allows for continuous cell culture and improved product quality. This technology enables the production of complex biologics, such as monoclonal antibodies, at larger scales and with greater efficiency.
  • Additionally, the integration of data analytics and automation in bioreactor systems is enabling real-time process monitoring and optimization, leading to increased productivity and process robustness. Bioreactor sterilization and waste minimization are also key areas of focus, as the production of biopharmaceuticals requires stringent process safety measures and regulatory compliance. The use of model predictive control and process simulation tools is helping to optimize bioreactor operations, minimize waste, and ensure sterility assurance. Whether you're looking to optimize your production processes, reduce costs, or ensure regulatory compliance, I can help you make informed decisions based on the latest research and industry data.

Unpacking the Bioreactors Market Landscape

Bioreactors have emerged as a critical component in various industries, including pharmaceuticals, biotechnology, and wastewater treatment, due to their ability to optimize production processes and enhance product quality. Compared to traditional methods, bioreactors offer improved substrate utilization rates by up to 30%, leading to significant cost reductions and increased ROI. Moreover, advanced control systems, such as ph control strategies and temperature control systems, ensure consistent process conditions, aligning with GMP compliance requirements. Off-line sensors and in-line sensors enable real-time monitoring of critical parameters, allowing for timely intervention and process optimization. For instance, foam control methods and agitation and aeration techniques contribute to a 20% increase in oxygen transfer rates, crucial for microbial growth kinetics and protein purification.

Bioreactor scale-up strategies, such as airlift bioreactor technology and perfusion bioreactor design, facilitate the transition from lab-scale to industrial-scale production while maintaining product quality. Bioreactor material selection, sterilization methods, and downstream processing techniques are essential aspects of bioprocess monitoring and bioreactor cleaning validation. In summary, bioreactors offer numerous advantages, from improved substrate utilization and product yield to enhanced process control and regulatory compliance. By employing advanced technologies, such as process analytical technology, metabolite profiling, and flow cytometry analysis, businesses can optimize their fermentation processes and achieve better overall performance.

Key Market Drivers Fueling Growth

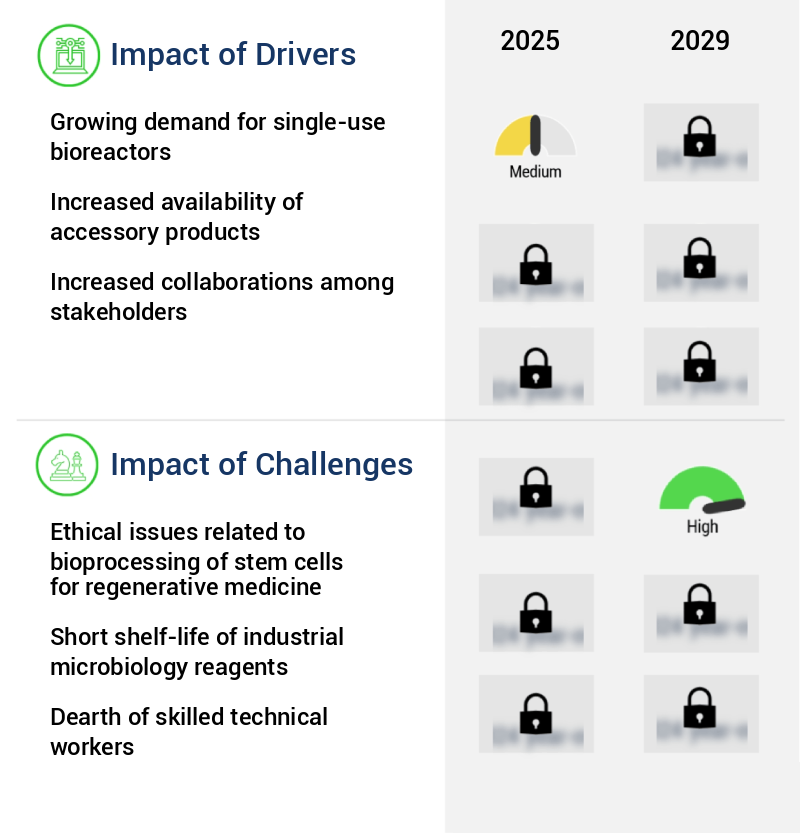
The increasing demand for single-use bioreactors serves as the primary market driver. These advanced systems offer advantages such as cost-effectiveness, ease of use, and reduced contamination risks, making them increasingly preferred over traditional stainless steel bioreactors in various industries, including pharmaceuticals, biotechnology, and food and beverage production.

  • The market is experiencing a notable expansion due to the growing adoption of single-use bioreactors. These bioreactors offer several advantages over traditional stainless steel bioreactors, including simplified setup for continuous processing. For example, the ReadyToProcess WAVE 25 Rocker from GE Healthcare features disposable cell bag chambers with internal floating filters, enabling small-scale continuous perfusion culture to be established swiftly without the complications of external perfusion devices.
  • Furthermore, a single-use bioreactor employed in fed-batch manufacturing can be effortlessly adapted to cater to the demands of continuous processing operations. This flexibility and ease of use are driving the market's evolution.

Prevailing Industry Trends & Opportunities

The emergence of startups and the continuous technological advances by existing players are shaping the upcoming market trend. 

  • The market is experiencing significant growth, presenting opportunities for emerging startups to leverage this technology in various sectors. For instance, in the healthcare industry, Ardent Cell Technologies in New York, USA, is developing a three-week bioreactor for human tissue processing. This technology involves taking fat tissue from a patient, subjecting it to a chemical bath in the bioreactor, and reintroducing it into the body to boost metabolism and aid in weight loss. Post-processing, the tissue is encased in a cartridge and shipped to the end-user company for further use in their bioreactor.
  • This growth is attributed to factors such as faster product rollouts, regulatory compliance, and cost optimization in industries like pharmaceuticals, food and beverage, and energy.

Significant Market Challenges

The ethical dilemmas surrounding the bioprocessing of stem cells for regenerative medicine represent a significant challenge to the industry's growth, necessitating rigorous adherence to ethical guidelines and regulatory frameworks to ensure the responsible application of this emerging technology. 

  • The market encompasses the production and sale of systems used to cultivate cells, tissues, and microorganisms for various applications. This market has experienced significant evolution, driven by advancements in biotechnology and the increasing demand for large-scale cell culture processes. Key applications include pharmaceuticals, biopharmaceuticals, and industrial bioprocessing. According to recent studies, The market is projected to reach a value of over USD20 billion by 2025, underpinned by the growing demand for biopharmaceuticals and the need for cost-effective and efficient production methods.
  • Ethical concerns, such as the use of animal and human cells, have been a constant focus in the market. Ensuring scientific purity, safety, and regulatory compliance are crucial factors shaping the market dynamics. 

Bioreactors Market Size

In-Depth Market Segmentation: Bioreactors Market

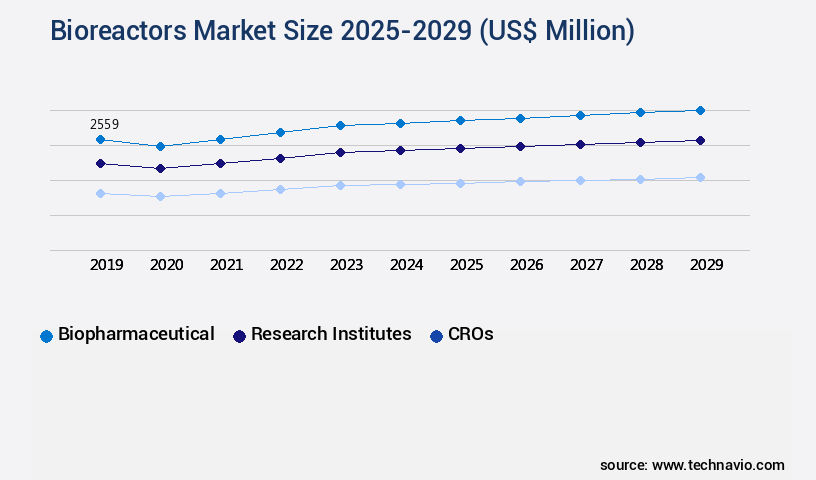
The bioreactors industry research report provides comprehensive data (region-wise segment analysis), with forecasts and estimates in "USD million" for the period 2025-2029, as well as historical data from 2019-2023 for the following segments.

  • End-user
    • Biopharmaceutical
    • Research institutes
    • CROs
  • Type
    • Automated
    • Manual
  • Application
    • Cell culture
    • Vaccine production
    • Stem-cell research
  • Geography
    • North America
      • US
      • Canada
    • Europe
      • France
      • Germany
      • Italy
      • UK
    • APAC
      • China
      • India
      • Japan
    • South America
      • Brazil
    • Rest of World (ROW)

By End-user Insights

The biopharmaceutical segment is estimated to witness significant growth during the forecast period.

The market is experiencing continuous evolution, driven primarily by the biopharmaceutical sector's increasing demand for advanced biologics, monoclonal antibodies, recombinant proteins, and cell-based therapies. Bioreactors play a pivotal role in cultivating living cells under controlled conditions, enabling scalable production of complex biologic drugs with superior purity and efficacy. A significant trend in this segment is the transition to single-use bioreactors, which provide operational flexibility, minimize contamination risks, and require lower capital investments compared to traditional stainless-steel systems. This shift is further fueled by the industry's focus on continuous bioprocessing and modular facility design, enhancing throughput and expediting new therapeutic introductions.

Key technologies shaping the market include ph control strategies, off-line sensors, process analytical technology, metabolite profiling, temperature control systems, bioreactor scale-up strategies, airlift bioreactor technology, substrate utilization rate optimization, foam control methods, microbial growth kinetics analysis, flow cytometry, protein purification, in-line sensors, photobioreactor design parameters, GMP-compliant bioreactors, wastewater treatment bioreactors, oxygen transfer rate optimization, perfusion bioreactor design, bioreactor control systems, cell culture systems, at-line sensors, immobilized cell bioreactors, bioreactor material selection, fermentation process optimization, bioreactor sterilization methods, downstream processing, bioreactor cleaning validation, bioprocess monitoring techniques, and single-use bioreactor systems. According to a recent study, the single-use bioreactor market is projected to grow at a compound annual growth rate (CAGR) of 12.5% between 2021 and 2028.

Bioreactors Market Size

Request Free Sample

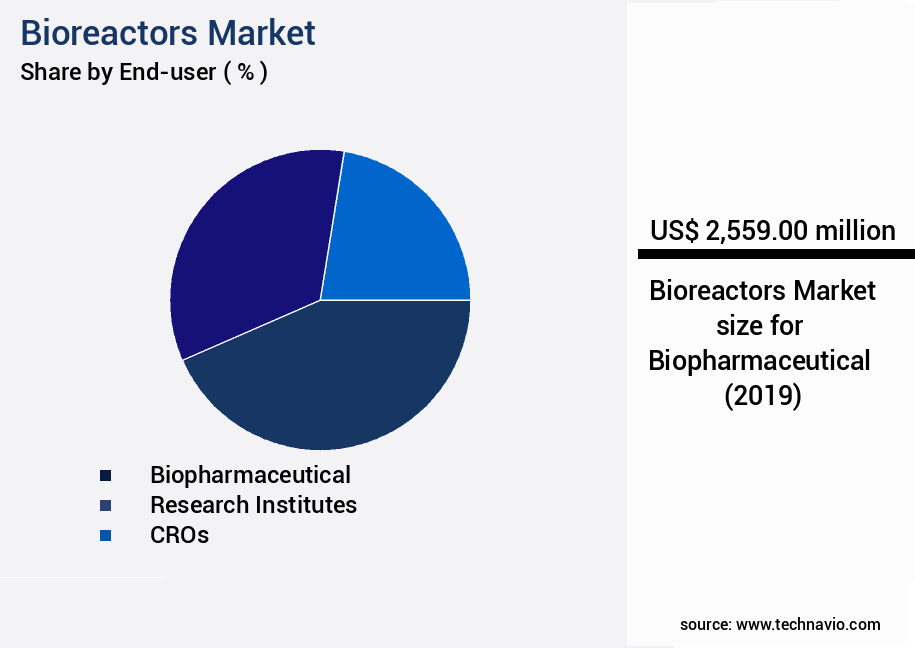
The Biopharmaceutical segment was valued at USD 2.56 billion in 2019 and showed a gradual increase during the forecast period.

Bioreactors Market Size

Request Free Sample

Regional Analysis

Asia is estimated to contribute 30% to the growth of the global market during the forecast period.Technavio's analysts have elaborately explained the regional trends and drivers that shape the market during the forecast period.

Bioreactors Market Share by Geography

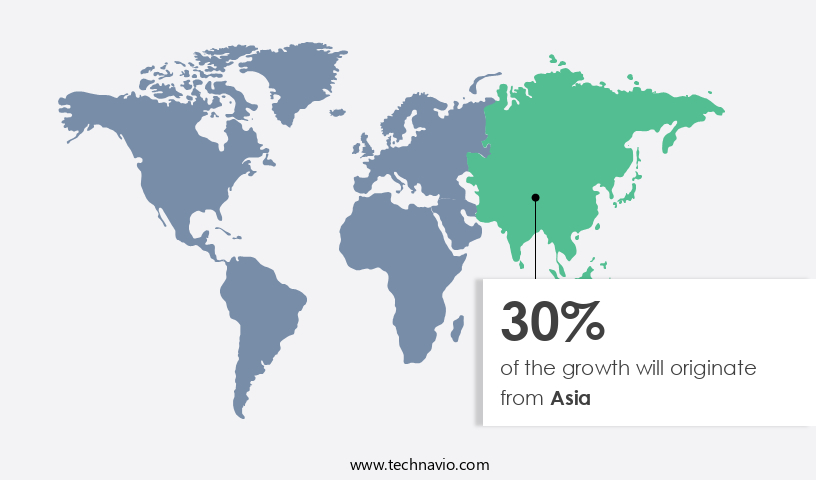
See How Bioreactors Market Demand is Rising in Asia Request Free Sample

The North American the market is poised for continuous expansion, fueled by the region's sophisticated biopharmaceutical infrastructure, stringent regulatory frameworks, and escalating demand for biologics and cell-based therapies. With a wealth of established research institutions and an extensive clinical trials pipeline, innovation and the adoption of advanced bioreactor technologies are encouraged. Government initiatives focusing on domestic manufacturing capabilities and reducing import dependence will stimulate investment in bioprocessing equipment. The emphasis on precision medicine and personalized therapeutics necessitates scalable and adaptable bioreactor systems catering to diverse production needs. Integration of automation and digital monitoring solutions into bioreactor operations enhances process efficiency, minimizes operational risks, and ensures compliance with stringent quality standards.

According to industry reports, the market in North America is projected to grow by over 7% annually, with the US accounting for more than 80% of the regional market share. This growth is driven by the US's dominant position in biopharmaceutical R&D and manufacturing.

Bioreactors Market Share by Geography

 Customer Landscape of Bioreactors Industry

Competitive Intelligence by Technavio Analysis: Leading Players in the Bioreactors Market

Companies are implementing various strategies, such as strategic alliances, bioreactors market forecast, partnerships, mergers and acquisitions, geographical expansion, and product/service launches, to enhance their presence in the industry.

3D Biotek LLC - The company specializes in advanced bioreactor technology, featuring the 3D Perfusion Bioreactor. This innovative design comprises multiple, autoclavable polycarbonate chambers, enhancing research capabilities with independent culture environments.

The industry research and growth report includes detailed analyses of the competitive landscape of the market and information about key companies, including:

  • 3D Biotek LLC
  • Automated Engineering Services Inc.
  • Bioengineering AG
  • BPC Instruments AB
  • Cell Culture Co. LLC
  • Danaher Corp.
  • Distek Inc.
  • Donaldson Co. Inc.
  • Eppendorf SE
  • Getinge AB
  • Infors AG
  • LAMBDA CZ sro
  • Merck KGaA
  • PBS Biotech Inc.
  • Pierre Guerin SA
  • Sartorius AG
  • Solida Biotech GmBH
  • Thermo Fisher Scientific Inc.
  • Zellwerk GmbH
  • ZETA

Qualitative and quantitative analysis of companies has been conducted to help clients understand the wider business environment as well as the strengths and weaknesses of key industry players. Data is qualitatively analyzed to categorize companies as pure play, category-focused, industry-focused, and diversified; it is quantitatively analyzed to categorize companies as dominant, leading, strong, tentative, and weak.

Recent Development and News in Bioreactors Market

  • In January 2025, Merck KGaA, a leading life science company, announced the launch of its new Mobius® UpFed 20 bioreactor system. This advanced single-use bioreactor is designed to enhance the production of microbial and mammalian cells, offering improved productivity and ease of use (Merck KGaA press release, 2025).
  • In March 2025, Thermo Fisher Scientific and Lonza, two major players in the bioreactor market, entered into a strategic collaboration to integrate Thermo Fisher Scientific's single-use bioreactors with Lonza's contract development and manufacturing services. This partnership aims to provide customers with a comprehensive solution for bioprocessing and commercial manufacturing (Thermo Fisher Scientific press release, 2025).
  • In May 2025, DSM, a global science-based company, completed the acquisition of Bio-Techne Corporation's Bioreactor Business. This acquisition significantly expanded DSM's presence in the bioreactor market, adding advanced technologies and a strong customer base to its portfolio (DSM press release, 2025).
  • In August 2024, the European Commission approved the use of Genzyme's new bioreactor technology for the production of its enzyme replacement therapy, Cerezyme. This approval marked a significant milestone in the adoption of large-scale, continuous bioreactor systems for the production of biopharmaceuticals (European Commission press release, 2024).

Dive into Technavio's robust research methodology, blending expert interviews, extensive data synthesis, and validated models for unparalleled Bioreactors Market insights. See full methodology.

Market Scope

Report Coverage

Details

Page number

214

Base year

2024

Historic period

2019-2023

Forecast period

2025-2029

Growth momentum & CAGR

Accelerate at a CAGR of 7.3%

Market growth 2025-2029

USD 3004.1 million

Market structure

Fragmented

YoY growth 2024-2025(%)

6.7

Key countries

US, Germany, China, UK, Brazil, Canada, France, India, Italy, and Japan

Competitive landscape

Leading Companies, Market Positioning of Companies, Competitive Strategies, and Industry Risks

Request Free Sample

Why Choose Technavio for Bioreactors Market Insights?

"Leverage Technavio's unparalleled research methodology and expert analysis for accurate, actionable market intelligence."

The market is experiencing significant growth due to the increasing demand for optimal impeller design stirred tanks that can improve oxygen transfer rates and reduce contamination risks in the production of biopharmaceuticals and industrial bioproducts. Single-use bioreactors are gaining popularity as they offer cost-effective validation and minimized risk of cross-contamination. Advanced process control strategies and high-density cell culture techniques are being employed to enhance product yield and improve process efficiency. Monitoring cell viability in real-time is crucial for ensuring regulatory compliance and maintaining optimal production conditions. Efficient downstream processing, which minimizes energy consumption and reduces waste generation, is also a key focus area for bioreactor manufacturers.

Cost-effective bioreactor operation is essential, and efforts are being made to minimize energy consumption and optimize resource utilization. Advanced bioreactor control systems and real-time process monitoring enable data-driven decision making, ensuring that production remains optimized and efficient. Improving bioreactor design continues to be a priority, with a focus on sustainable bioprocessing and microbial contamination control. The integration of automation and digitalization is also driving innovation in the market, enabling more precise and efficient production processes. As the market continues to evolve, it is important for manufacturers to stay abreast of the latest trends and technologies to remain competitive. This includes the development of advanced bioreactor designs, the integration of artificial intelligence and machine learning, and the adoption of closed systems to minimize contamination risks. By focusing on improving process efficiency, ensuring regulatory compliance, and reducing costs, the market is poised for continued growth and innovation.

What are the Key Data Covered in this Bioreactors Market Research and Growth Report?

  • What is the expected growth of the Bioreactors Market between 2025 and 2029?

    • USD 3 billion, at a CAGR of 7.3%

  • What segmentation does the market report cover?

    • The report is segmented by End-user (Biopharmaceutical, Research institutes, and CROs), Type (Automated and Manual), Application (Cell culture, Vaccine production, and Stem-cell research), and Geography (North America, Europe, Asia, and Rest of World (ROW))

  • Which regions are analyzed in the report?

    • North America, Europe, Asia, and Rest of World (ROW)

  • What are the key growth drivers and market challenges?

    • Growing demand for single-use bioreactors, Ethical issues related to bioprocessing of stem cells for regenerative medicine

  • Who are the major players in the Bioreactors Market?

    • 3D Biotek LLC, Automated Engineering Services Inc., Bioengineering AG, BPC Instruments AB, Cell Culture Co. LLC, Danaher Corp., Distek Inc., Donaldson Co. Inc., Eppendorf SE, Getinge AB, Infors AG, LAMBDA CZ sro, Merck KGaA, PBS Biotech Inc., Pierre Guerin SA, Sartorius AG, Solida Biotech GmBH, Thermo Fisher Scientific Inc., Zellwerk GmbH, and ZETA

We can help! Our analysts can customize this bioreactors market research report to meet your requirements.

Get in touch

1 Executive Summary

  • 1.1 Market overview
    • Executive Summary - Chart on Market Overview
    • Executive Summary - Data Table on Market Overview
    • Executive Summary - Chart on Global Market Characteristics
    • Executive Summary - Chart on Market by Geography
    • Executive Summary - Chart on Market Segmentation by End-user
    • Executive Summary - Chart on Market Segmentation by Type
    • Executive Summary - Chart on Market Segmentation by Application
    • Executive Summary - Chart on Incremental Growth
    • Executive Summary - Data Table on Incremental Growth
    • Executive Summary - Chart on Company Market Positioning

2 Technavio Analysis

  • 2.1 Analysis of price sensitivity, lifecycle, customer purchase basket, adoption rates, and purchase criteria
    • Analysis of price sensitivity, lifecycle, customer purchase basket, adoption rates, and purchase criteria
  • 2.2 Criticality of inputs and Factors of differentiation
    • Overview on criticality of inputs and factors of differentiation
  • 2.3 Factors of disruption
    • Overview on factors of disruption
  • 2.4 Impact of drivers and challenges
    • Impact of drivers and challenges in 2024 and 2029

3 Market Landscape

  • 3.1 Market ecosystem
    • Parent Market
    • Data Table on - Parent Market
  • 3.2 Market characteristics
    • Market characteristics analysis
  • 3.3 Value chain analysis
    • Value chain analysis

4 Market Sizing

  • 4.1 Market definition
    • Offerings of companies included in the market definition
  • 4.2 Market segment analysis
    • Market segments
  • 4.3 Market size 2024
    • 4.4 Market outlook: Forecast for 2024-2029
      • Chart on Global - Market size and forecast 2024-2029 ($ million)
      • Data Table on Global - Market size and forecast 2024-2029 ($ million)
      • Chart on Global Market: Year-over-year growth 2024-2029 (%)
      • Data Table on Global Market: Year-over-year growth 2024-2029 (%)

    5 Historic Market Size

    • 5.1 Global Bioreactors Market 2019 - 2023
      • Historic Market Size - Data Table on Global Bioreactors Market 2019 - 2023 ($ million)
    • 5.2 End-user segment analysis 2019 - 2023
      • Historic Market Size - End-user Segment 2019 - 2023 ($ million)
    • 5.3 Type segment analysis 2019 - 2023
      • Historic Market Size - Type Segment 2019 - 2023 ($ million)
    • 5.4 Application segment analysis 2019 - 2023
      • Historic Market Size - Application Segment 2019 - 2023 ($ million)
    • 5.5 Geography segment analysis 2019 - 2023
      • Historic Market Size - Geography Segment 2019 - 2023 ($ million)
    • 5.6 Country segment analysis 2019 - 2023
      • Historic Market Size - Country Segment 2019 - 2023 ($ million)

    6 Qualitative Analysis

    • 6.1 The AI impact on Global Bioreactors Market

      7 Five Forces Analysis

      • 7.1 Five forces summary
        • Five forces analysis - Comparison between 2024 and 2029
      • 7.2 Bargaining power of buyers
        • Bargaining power of buyers - Impact of key factors 2024 and 2029
      • 7.3 Bargaining power of suppliers
        • Bargaining power of suppliers - Impact of key factors in 2024 and 2029
      • 7.4 Threat of new entrants
        • Threat of new entrants - Impact of key factors in 2024 and 2029
      • 7.5 Threat of substitutes
        • Threat of substitutes - Impact of key factors in 2024 and 2029
      • 7.6 Threat of rivalry
        • Threat of rivalry - Impact of key factors in 2024 and 2029
      • 7.7 Market condition
        • Chart on Market condition - Five forces 2024 and 2029

      8 Market Segmentation by End-user

      • 8.1 Market segments
        • Chart on End-user - Market share 2024-2029 (%)
        • Data Table on End-user - Market share 2024-2029 (%)
      • 8.2 Comparison by End-user
        • Chart on Comparison by End-user
        • Data Table on Comparison by End-user
      • 8.3 Biopharmaceutical - Market size and forecast 2024-2029
        • Chart on Biopharmaceutical - Market size and forecast 2024-2029 ($ million)
        • Data Table on Biopharmaceutical - Market size and forecast 2024-2029 ($ million)
        • Chart on Biopharmaceutical - Year-over-year growth 2024-2029 (%)
        • Data Table on Biopharmaceutical - Year-over-year growth 2024-2029 (%)
      • 8.4 Research institutes - Market size and forecast 2024-2029
        • Chart on Research institutes - Market size and forecast 2024-2029 ($ million)
        • Data Table on Research institutes - Market size and forecast 2024-2029 ($ million)
        • Chart on Research institutes - Year-over-year growth 2024-2029 (%)
        • Data Table on Research institutes - Year-over-year growth 2024-2029 (%)
      • 8.5 CROs - Market size and forecast 2024-2029
        • Chart on CROs - Market size and forecast 2024-2029 ($ million)
        • Data Table on CROs - Market size and forecast 2024-2029 ($ million)
        • Chart on CROs - Year-over-year growth 2024-2029 (%)
        • Data Table on CROs - Year-over-year growth 2024-2029 (%)
      • 8.6 Market opportunity by End-user
        • Market opportunity by End-user ($ million)
        • Data Table on Market opportunity by End-user ($ million)

      9 Market Segmentation by Type

      • 9.1 Market segments
        • Chart on Type - Market share 2024-2029 (%)
        • Data Table on Type - Market share 2024-2029 (%)
      • 9.2 Comparison by Type
        • Chart on Comparison by Type
        • Data Table on Comparison by Type
      • 9.3 Automated - Market size and forecast 2024-2029
        • Chart on Automated - Market size and forecast 2024-2029 ($ million)
        • Data Table on Automated - Market size and forecast 2024-2029 ($ million)
        • Chart on Automated - Year-over-year growth 2024-2029 (%)
        • Data Table on Automated - Year-over-year growth 2024-2029 (%)
      • 9.4 Manual - Market size and forecast 2024-2029
        • Chart on Manual - Market size and forecast 2024-2029 ($ million)
        • Data Table on Manual - Market size and forecast 2024-2029 ($ million)
        • Chart on Manual - Year-over-year growth 2024-2029 (%)
        • Data Table on Manual - Year-over-year growth 2024-2029 (%)
      • 9.5 Market opportunity by Type
        • Market opportunity by Type ($ million)
        • Data Table on Market opportunity by Type ($ million)

      10 Market Segmentation by Application

      • 10.1 Market segments
        • Chart on Application - Market share 2024-2029 (%)
        • Data Table on Application - Market share 2024-2029 (%)
      • 10.2 Comparison by Application
        • Chart on Comparison by Application
        • Data Table on Comparison by Application
      • 10.3 Cell culture - Market size and forecast 2024-2029
        • Chart on Cell culture - Market size and forecast 2024-2029 ($ million)
        • Data Table on Cell culture - Market size and forecast 2024-2029 ($ million)
        • Chart on Cell culture - Year-over-year growth 2024-2029 (%)
        • Data Table on Cell culture - Year-over-year growth 2024-2029 (%)
      • 10.4 Vaccine production - Market size and forecast 2024-2029
        • Chart on Vaccine production - Market size and forecast 2024-2029 ($ million)
        • Data Table on Vaccine production - Market size and forecast 2024-2029 ($ million)
        • Chart on Vaccine production - Year-over-year growth 2024-2029 (%)
        • Data Table on Vaccine production - Year-over-year growth 2024-2029 (%)
      • 10.5 Stem-cell research - Market size and forecast 2024-2029
        • Chart on Stem-cell research - Market size and forecast 2024-2029 ($ million)
        • Data Table on Stem-cell research - Market size and forecast 2024-2029 ($ million)
        • Chart on Stem-cell research - Year-over-year growth 2024-2029 (%)
        • Data Table on Stem-cell research - Year-over-year growth 2024-2029 (%)
      • 10.6 Market opportunity by Application
        • Market opportunity by Application ($ million)
        • Data Table on Market opportunity by Application ($ million)

      11 Customer Landscape

      • 11.1 Customer landscape overview
        • Analysis of price sensitivity, lifecycle, customer purchase basket, adoption rates, and purchase criteria

      12 Geographic Landscape

      • 12.1 Geographic segmentation
        • Chart on Market share by geography 2024-2029 (%)
        • Data Table on Market share by geography 2024-2029 (%)
      • 12.2 Geographic comparison
        • Chart on Geographic comparison
        • Data Table on Geographic comparison
      • 12.3 North America - Market size and forecast 2024-2029
        • Chart on North America - Market size and forecast 2024-2029 ($ million)
        • Data Table on North America - Market size and forecast 2024-2029 ($ million)
        • Chart on North America - Year-over-year growth 2024-2029 (%)
        • Data Table on North America - Year-over-year growth 2024-2029 (%)
      • 12.4 Europe - Market size and forecast 2024-2029
        • Chart on Europe - Market size and forecast 2024-2029 ($ million)
        • Data Table on Europe - Market size and forecast 2024-2029 ($ million)
        • Chart on Europe - Year-over-year growth 2024-2029 (%)
        • Data Table on Europe - Year-over-year growth 2024-2029 (%)
      • 12.5 Asia - Market size and forecast 2024-2029
        • Chart on Asia - Market size and forecast 2024-2029 ($ million)
        • Data Table on Asia - Market size and forecast 2024-2029 ($ million)
        • Chart on Asia - Year-over-year growth 2024-2029 (%)
        • Data Table on Asia - Year-over-year growth 2024-2029 (%)
      • 12.6 Rest of World (ROW) - Market size and forecast 2024-2029
        • Chart on Rest of World (ROW) - Market size and forecast 2024-2029 ($ million)
        • Data Table on Rest of World (ROW) - Market size and forecast 2024-2029 ($ million)
        • Chart on Rest of World (ROW) - Year-over-year growth 2024-2029 (%)
        • Data Table on Rest of World (ROW) - Year-over-year growth 2024-2029 (%)
      • 12.7 US - Market size and forecast 2024-2029
        • Chart on US - Market size and forecast 2024-2029 ($ million)
        • Data Table on US - Market size and forecast 2024-2029 ($ million)
        • Chart on US - Year-over-year growth 2024-2029 (%)
        • Data Table on US - Year-over-year growth 2024-2029 (%)
      • 12.8 Germany - Market size and forecast 2024-2029
        • Chart on Germany - Market size and forecast 2024-2029 ($ million)
        • Data Table on Germany - Market size and forecast 2024-2029 ($ million)
        • Chart on Germany - Year-over-year growth 2024-2029 (%)
        • Data Table on Germany - Year-over-year growth 2024-2029 (%)
      • 12.9 China - Market size and forecast 2024-2029
        • Chart on China - Market size and forecast 2024-2029 ($ million)
        • Data Table on China - Market size and forecast 2024-2029 ($ million)
        • Chart on China - Year-over-year growth 2024-2029 (%)
        • Data Table on China - Year-over-year growth 2024-2029 (%)
      • 12.10 Brazil - Market size and forecast 2024-2029
        • Chart on Brazil - Market size and forecast 2024-2029 ($ million)
        • Data Table on Brazil - Market size and forecast 2024-2029 ($ million)
        • Chart on Brazil - Year-over-year growth 2024-2029 (%)
        • Data Table on Brazil - Year-over-year growth 2024-2029 (%)
      • 12.11 UK - Market size and forecast 2024-2029
        • Chart on UK - Market size and forecast 2024-2029 ($ million)
        • Data Table on UK - Market size and forecast 2024-2029 ($ million)
        • Chart on UK - Year-over-year growth 2024-2029 (%)
        • Data Table on UK - Year-over-year growth 2024-2029 (%)
      • 12.12 India - Market size and forecast 2024-2029
        • Chart on India - Market size and forecast 2024-2029 ($ million)
        • Data Table on India - Market size and forecast 2024-2029 ($ million)
        • Chart on India - Year-over-year growth 2024-2029 (%)
        • Data Table on India - Year-over-year growth 2024-2029 (%)
      • 12.13 Canada - Market size and forecast 2024-2029
        • Chart on Canada - Market size and forecast 2024-2029 ($ million)
        • Data Table on Canada - Market size and forecast 2024-2029 ($ million)
        • Chart on Canada - Year-over-year growth 2024-2029 (%)
        • Data Table on Canada - Year-over-year growth 2024-2029 (%)
      • 12.14 France - Market size and forecast 2024-2029
        • Chart on France - Market size and forecast 2024-2029 ($ million)
        • Data Table on France - Market size and forecast 2024-2029 ($ million)
        • Chart on France - Year-over-year growth 2024-2029 (%)
        • Data Table on France - Year-over-year growth 2024-2029 (%)
      • 12.15 Japan - Market size and forecast 2024-2029
        • Chart on Japan - Market size and forecast 2024-2029 ($ million)
        • Data Table on Japan - Market size and forecast 2024-2029 ($ million)
        • Chart on Japan - Year-over-year growth 2024-2029 (%)
        • Data Table on Japan - Year-over-year growth 2024-2029 (%)
      • 12.16 Italy - Market size and forecast 2024-2029
        • Chart on Italy - Market size and forecast 2024-2029 ($ million)
        • Data Table on Italy - Market size and forecast 2024-2029 ($ million)
        • Chart on Italy - Year-over-year growth 2024-2029 (%)
        • Data Table on Italy - Year-over-year growth 2024-2029 (%)
      • 12.17 Market opportunity by geography
        • Market opportunity by geography ($ million)
        • Data Tables on Market opportunity by geography ($ million)

      13 Drivers, Challenges, and Opportunity/Restraints

      • 13.1 Market drivers
        • 13.2 Market challenges
          • 13.3 Impact of drivers and challenges
            • Impact of drivers and challenges in 2024 and 2029
          • 13.4 Market opportunities/restraints

            14 Competitive Landscape

            • 14.1 Overview
              • 14.2 Competitive Landscape
                • Overview on criticality of inputs and factors of differentiation
              • 14.3 Landscape disruption
                • Overview on factors of disruption
              • 14.4 Industry risks
                • Impact of key risks on business

              15 Competitive Analysis

              • 15.1 Companies profiled
                • Companies covered
              • 15.2 Company ranking index
                • Company ranking index
              • 15.3 Market positioning of companies
                • Matrix on companies position and classification
              • 3D Biotek LLC
                • 3D Biotek LLC - Overview
                • 3D Biotek LLC - Product / Service
                • 3D Biotek LLC - Key offerings
                • SWOT
              • 15.5 Automated Engineering Services Inc.
                • Automated Engineering Services Inc. - Overview
                • Automated Engineering Services Inc. - Product / Service
                • Automated Engineering Services Inc. - Key offerings
                • SWOT
              • 15.6 Bioengineering AG
                • Bioengineering AG - Overview
                • Bioengineering AG - Product / Service
                • Bioengineering AG - Key offerings
                • SWOT
              • 15.7 Cell Culture Co. LLC
                • Cell Culture Co. LLC - Overview
                • Cell Culture Co. LLC - Product / Service
                • Cell Culture Co. LLC - Key offerings
                • SWOT
              • 15.8 Danaher Corp.
                • Danaher Corp. - Overview
                • Danaher Corp. - Business segments
                • Danaher Corp. - Key news
                • Danaher Corp. - Key offerings
                • Danaher Corp. - Segment focus
                • SWOT
              • 15.9 Distek Inc.
                • Distek Inc. - Overview
                • Distek Inc. - Product / Service
                • Distek Inc. - Key offerings
                • SWOT
              • 15.10 Eppendorf SE
                • Eppendorf SE - Overview
                • Eppendorf SE - Product / Service
                • Eppendorf SE - Key news
                • Eppendorf SE - Key offerings
                • SWOT
              • 15.11 Getinge AB
                • Getinge AB - Overview
                • Getinge AB - Business segments
                • Getinge AB - Key news
                • Getinge AB - Key offerings
                • Getinge AB - Segment focus
                • SWOT
              • 15.12 Infors AG
                • Infors AG - Overview
                • Infors AG - Product / Service
                • Infors AG - Key offerings
                • SWOT
              • 15.13 LAMBDA CZ sro
                • LAMBDA CZ sro - Overview
                • LAMBDA CZ sro - Product / Service
                • LAMBDA CZ sro - Key offerings
                • SWOT
              • 15.14 Merck KGaA
                • Merck KGaA - Overview
                • Merck KGaA - Business segments
                • Merck KGaA - Key news
                • Merck KGaA - Key offerings
                • Merck KGaA - Segment focus
                • SWOT
              • 15.15 PBS Biotech Inc.
                • PBS Biotech Inc. - Overview
                • PBS Biotech Inc. - Product / Service
                • PBS Biotech Inc. - Key offerings
                • SWOT
              • 15.16 Pierre Guerin SA
                • Pierre Guerin SA - Overview
                • Pierre Guerin SA - Product / Service
                • Pierre Guerin SA - Key offerings
                • SWOT
              • 15.17 Sartorius AG
                • Sartorius AG - Overview
                • Sartorius AG - Business segments
                • Sartorius AG - Key news
                • Sartorius AG - Key offerings
                • Sartorius AG - Segment focus
                • SWOT
              • 15.18 Thermo Fisher Scientific Inc.
                • Thermo Fisher Scientific Inc. - Overview
                • Thermo Fisher Scientific Inc. - Business segments
                • Thermo Fisher Scientific Inc. - Key news
                • Thermo Fisher Scientific Inc. - Key offerings
                • Thermo Fisher Scientific Inc. - Segment focus
                • SWOT

              16 Appendix

              • 16.1 Scope of the report
                • 16.2 Inclusions and exclusions checklist
                  • Inclusions checklist
                  • Exclusions checklist
                • 16.3 Currency conversion rates for US$
                  • Currency conversion rates for US$
                • 16.4 Research methodology
                  • Research methodology
                • 16.5 Data procurement
                  • Information sources
                • 16.6 Data validation
                  • Data validation
                • 16.7 Validation techniques employed for market sizing
                  • Validation techniques employed for market sizing
                • 16.8 Data synthesis
                  • Data synthesis
                • 16.9 360 degree market analysis
                  • 360 degree market analysis
                • 16.10 List of abbreviations
                  • List of abbreviations

                Research Methodology

                Technavio presents a detailed picture of the market by way of study, synthesis, and summation of data from multiple sources. The analysts have presented the various facets of the market with a particular focus on identifying the key industry influencers. The data thus presented is comprehensive, reliable, and the result of extensive research, both primary and secondary.

                INFORMATION SOURCES

                Primary sources

                • Manufacturers and suppliers
                • Channel partners
                • Industry experts
                • Strategic decision makers

                Secondary sources

                • Industry journals and periodicals
                • Government data
                • Financial reports of key industry players
                • Historical data
                • Press releases

                DATA ANALYSIS

                Data Synthesis

                • Collation of data
                • Estimation of key figures
                • Analysis of derived insights

                Data Validation

                • Triangulation with data models
                • Reference against proprietary databases
                • Corroboration with industry experts

                REPORT WRITING

                Qualitative

                • Market drivers
                • Market challenges
                • Market trends
                • Five forces analysis

                Quantitative

                • Market size and forecast
                • Market segmentation
                • Geographical insights
                • Competitive landscape

                Interested in this report?

                Get your sample now to see our research methodology and insights!

                Download Now

                Frequently Asked Questions

                Bioreactors market growth will increase by $ 3004.1 mn during 2025-2029.

                The Bioreactors market is expected to grow at a CAGR of 7.3% during 2025-2029.

                Bioreactors market is segmented by End-user( Biopharmaceutical, Research institutes, CROs) Type( Automated, Manual, Asia, ROW) Application( Cell culture, Vaccine production, Stem-cell research, Rest of World (ROW))

                3D Biotek LLC, Automated Engineering Services Inc., Bioengineering AG, BPC Instruments AB, Cell Culture Co. LLC, Danaher Corp., Distek Inc., Donaldson Co. Inc., Eppendorf SE, Getinge AB, Infors AG, LAMBDA CZ sro, Merck KGaA, PBS Biotech Inc., Pierre Guerin SA, Sartorius AG, Solida Biotech GmBH, Thermo Fisher Scientific Inc., Zellwerk GmbH, ZETA are a few of the key vendors in the Bioreactors market.

                Asia will register the highest growth rate of 30% among the other regions. Therefore, the Bioreactors market in Asia is expected to garner significant business opportunities for the vendors during the forecast period.

                US, Germany, China, UK, Brazil, Canada, France, India, Italy, Japan

                • Growing demand for single-use bioreactorsThe demand for single-use bioreactors has increased significantly in the global bioreactors market owing to their various attributes. Single-use bioreactors are simpler to use than stainless steel bioreactors because of the ease with which they can be set up for continuous processing. For instance is the driving factor this market.
                • ReadyToProcess WAVE 25 Rocker from GE Healthcare can be used with disposable cell bag chambers is the driving factor this market.
                • which are designed for perfusion with an internal floating filter is the driving factor this market.
                • thereby allowing small-scale continuous perfusion culture to be set up within minutes and without the hassle involved in connecting external perfusion devices.A single-use bioreactor that has been used in a fed-batch manufacturing process can be easily converted to fit the requirements of a continuous processing operation. While the vessel stays the same regardless of the process mode is the driving factor this market.
                • only process-specific consumable parts is the driving factor this market.
                • such as bags and tubing is the driving factor this market.
                • are disposable and can be customized for each process. On the other hand is the driving factor this market.
                • a similar change in a stainless-steel bioreactor may require an extensive re-work of the facility infrastructure and incur additional investments.Additionally is the driving factor this market.
                • a single-use bioreactor enables a reduction in maintenance costs as it does not require the same utility and piping infrastructure as a traditional stainless-steel bioreactor is the driving factor this market.
                • which also reduces the space required within the cleanroom. Hence is the driving factor this market.
                • the growing demand for single-use bioreactors is expected to boost the market sales of bioreactors in the long run. is the driving factor this market.

                The Bioreactors market vendors should focus on grabbing business opportunities from the Biopharmaceutical segment as it accounted for the largest market share in the base year.