
Mexico Telecom Market Size 2025-2029
The mexico telecom market size is forecast to increase by USD 18.1 billion, at a CAGR of 8.2% between 2024 and 2029.
- The market is experiencing significant growth and transformation, driven by advances in telecommunications technologies and the increasing adoption of mobile financial services. These trends are shaping the competitive landscape and offering new opportunities for market participants. However, the market also faces challenges, most notably the growing threat of cybersecurity breaches. Telecom companies in Mexico are investing heavily in the latest technologies, including 5G networks, the Internet of Things (IoT), and cloud computing, to enhance their offerings and meet evolving consumer demands. Simultaneously, the popularity of mobile financial services, such as mobile banking and mobile payments, is soaring, with more Mexicans turning to their smartphones for financial transactions.
- This trend is expected to continue, as financial inclusion remains a priority for the Mexican government and telecom companies. However, these opportunities come with challenges. Cybersecurity threats are a major concern for the telecom industry in Mexico, with hacking attempts and data breaches on the rise. Companies must invest in robust cybersecurity measures to protect their networks and customers' data. Failure to do so could result in reputational damage, regulatory fines, and legal action. As the market continues to evolve, companies must navigate these challenges while capitalizing on the opportunities presented by technological advances and the growing adoption of mobile financial services.
What will be the size of the Mexico Telecom Market during the forecast period?
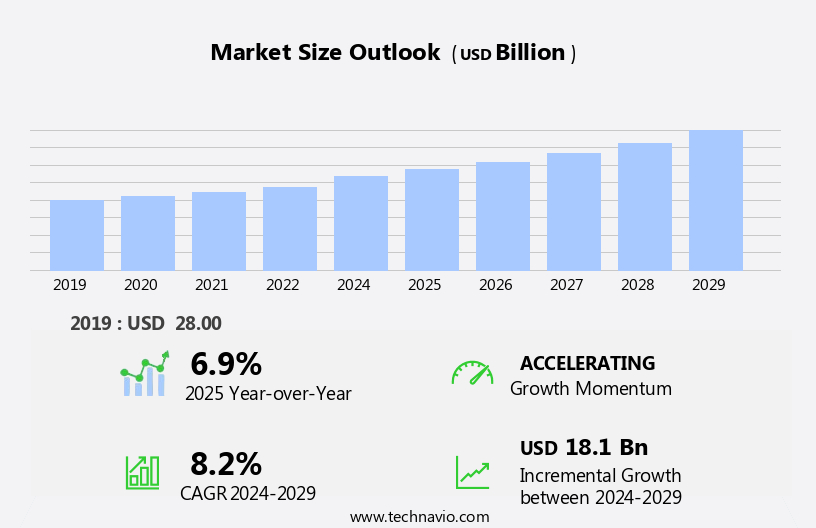
Explore in-depth regional segment analysis with market size data - historical 2019-2023 and forecasts 2025-2029 - in the full report.
Request Free Sample
- The Mexican telecom market is characterized by a dynamic and complex landscape, encompassing various aspects such as telecom consulting, network deployment, and spectrum management. Telecom outsourcing has gained traction, enabling service providers to focus on core competencies while third parties handle tasks like technical support and customer service. Network security remains a top priority, with cybersecurity threats, including DDoS attacks and data breaches, posing significant risks. Telecom operators invest in network security audits, intrusion detection, and prevention measures to safeguard their infrastructure. Spectrum management and network automation are crucial for efficient network operations. Big data and machine learning are increasingly being leveraged to optimize network performance and enhance customer experience.
- Telecom policy and network architecture are evolving, with network slicing and edge computing playing pivotal roles in shaping the future of the industry. Network troubleshooting and telecom engineering are ongoing processes to maintain network reliability. Telecom licensing and network architecture are subject to continuous changes, necessitating a proactive approach to regulatory compliance and network design. Network security and telecom fraud are persistent challenges, requiring robust cybersecurity threat landscape monitoring and stringent fraud prevention measures. Network architecture and network intrusion detection are essential components of a comprehensive security strategy. In the realm of technical support, network maintenance, and customer service, telecom consulting firms offer valuable expertise to help operators navigate the complexities of the market.
- The integration of advanced technologies, such as machine learning and network automation, is transforming the way telecom services are delivered and managed.
How is this market segmented?
The market research report provides comprehensive data (region-wise segment analysis), with forecasts and estimates in "USD billion" for the period 2025-2029, as well as historical data from 2019-2023 for the following segments.
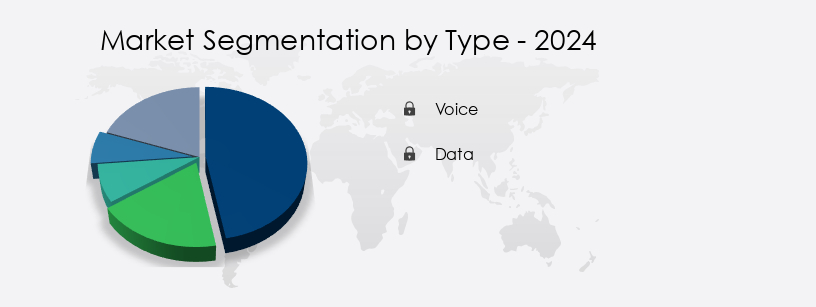
- Type
- Voice
- Data
- Application
- Commercial
- Residential
- Product Type
- Telecommunication hardware
- Telecommunication services
- Geography
- North America
- Mexico
- North America
By Type Insights
The voice segment is estimated to witness significant growth during the forecast period.
Mexico's telecom market is experiencing significant growth due to its expanding population and urbanization. With over 80% of the population residing in urban areas, there is a heightened demand for telecom services, particularly voice communication. The transition from circuit-switched networks to IP-based networks has expanded the functionality and accessibility of voice services. Furthermore, telecom startups and mobile network operators are investing in network optimization, network expansion, and network security to enhance network capacity and reliability. Satellite communications and data center services cater to remote areas and businesses requiring uninterrupted connectivity. Telecom venture capital and industry investment fuel innovation in emerging technologies, such as 5G, software-defined networking, and network virtualization.
Business intelligence and data analytics help companies make informed decisions, while network management systems and data plans cater to the diverse needs of consumers and businesses. The telecom industry trends include network interconnection, unified communications, and video conferencing, which facilitate seamless communication and collaboration. The Mexican telecommunications regulation ensures fair competition and encourages infrastructure development, including fiber optic cables and cellular base stations. The telecom workforce undergoes skills development to adapt to the evolving technology landscape. Network monitoring, performance, and resilience are crucial aspects of network management, ensuring uninterrupted services for businesses and individuals. M&A activity and telecom partnerships shape the industry landscape, while cloud computing and mobile payments offer convenience and flexibility.
Overall, Mexico's telecom market is dynamic and evolving, driven by population growth, urbanization, and technological advancements.
Get a glance at the market share of various segments Request Free Sample
The Voice segment was valued at USD 15.80 billion in 2019 and showed a gradual increase during the forecast period.
Market Dynamics
Our researchers analyzed the data with 2024 as the base year, along with the key drivers, trends, and challenges. A holistic analysis of drivers will help companies refine their marketing strategies to gain a competitive advantage.
What are the key market drivers leading to the rise in the adoption of Telecom in Mexico Industry?
- The primary catalyst fueling market growth is the continual progression of telecommunications technologies.
- The market is experiencing significant growth, driven by the deployment of advanced technologies such as 5G networks and fiber optics. Telecom operators are investing in 5G infrastructure to provide ultra-fast speeds, low latency, and increased network capacity, enabling new applications like AR, VR, autonomous vehicles, and industrial IoT. Fiber optic technology is transforming the broadband landscape, delivering high-speed internet access to urban and rural areas. This infrastructure supports bandwidth-intensive applications, ensuring reliable connectivity for video streaming, online gaming, and cloud services. Network optimization is a priority for telecom companies, with billing systems and business intelligence tools being essential for managing network capacity and workforce.
- Telecom startups are also entering the market, introducing competition and innovation. Satellite communications continue to play a role in remote areas, complementing terrestrial networks. Network security is a critical concern, with data analytics and network security solutions essential for protecting against cyber threats. Network expansion is ongoing, with cellular base stations being added to meet growing demand for connectivity. Telecom venture capital is fueling innovation and growth in the sector.
What are the market trends shaping the Telecom in Mexico Industry?
- The increasing prevalence of mobile financial services represents a significant market trend. This shift towards digital and convenient financial solutions is a mandatory development in today's professional business environment.
- The market is characterized by the growing adoption of mobile devices and the increasing popularity of mobile financial services. Mobile payments, including money transfers, bill payments, merchant payments, and mobile top-ups, have become essential for consumers, with telecom operators providing the necessary network infrastructure and mobile connectivity. This trend is particularly significant in Mexico, where a large population lacks access to traditional banking services. Mobile wallets, which enable users to store funds, make payments, and conduct transactions using their mobile phones, are increasingly popular. Moreover, the telecom industry in Mexico is investing in 5G technology to enhance network reliability and reduce network latency, providing a more immersive and harmonious user experience.
- Telecom companies are also focusing on customer experience, skills development, data center services, and innovation centers to stay competitive in the market. Telecommunications regulation plays a crucial role in shaping the market dynamics, ensuring fair competition and consumer protection. The telecom education sector is also growing, providing opportunities for individuals to develop the skills needed to succeed in the industry. Overall, the Mexican telecom market is an exciting and dynamic space, with ongoing innovation and investment driving growth and development.
What challenges does the Telecom in Mexico Industry face during its growth?
- Telecommunication industries face significant growth challenges due to the increasing threat landscape in cybersecurity. This issue, which can result in data breaches, network disruptions, and reputational damage, necessitates continuous investment in robust cybersecurity measures to safeguard critical infrastructure and customer information.
- In Mexico, the telecom industry is focused on infrastructure development, video conferencing, and broadband internet to facilitate digital transformation and network innovation. Telecom regulation plays a crucial role in shaping the market, ensuring fair competition and consumer protection. Wholesale telecom services and network interconnection are essential components of the telecom ecosystem, enabling seamless communication and data exchange between operators. Telecom infrastructure, including fiber optic cables, is undergoing significant upgrades to support the increasing demand for high-speed connectivity and advanced network management systems. Data plans are becoming more competitive, offering flexible options to cater to diverse consumer needs.
- Telecom operators are investing in research and development to enhance network security and mitigate risks, such as data breaches and cyberattacks. Malware, ransomware, phishing attacks, and social engineering tactics pose significant threats to telecom networks and systems, necessitating robust security measures and continuous monitoring. Overall, the Mexican telecom industry is evolving to meet the demands of a digitally connected society, prioritizing innovation, reliability, and security.
Exclusive Customer Landscape
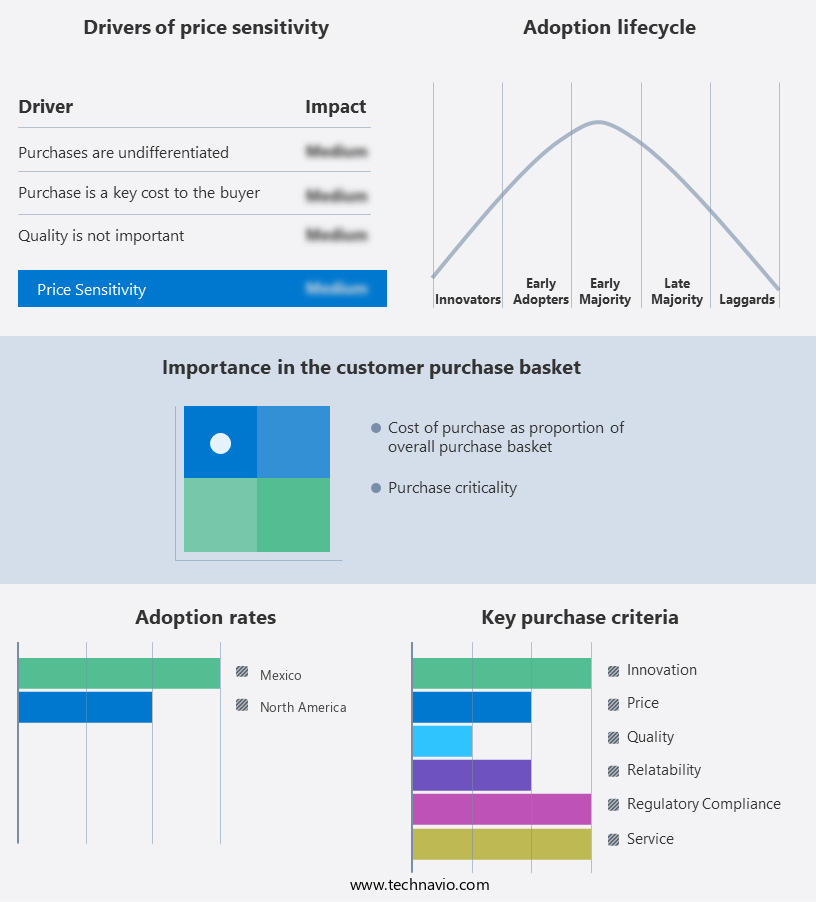
The telecom market in mexico forecasting report includes the adoption lifecycle of the market, covering from the innovator’s stage to the laggard’s stage. It focuses on adoption rates in different regions based on penetration. Furthermore, the telecom market in mexico report also includes key purchase criteria and drivers of price sensitivity to help companies evaluate and develop their market growth analysis strategies.
Customer Landscape
Key Companies & Market Insights
Companies are implementing various strategies, such as strategic alliances, telecom market in mexico forecast, partnerships, mergers and acquisitions, geographical expansion, and product/service launches, to enhance their presence in the industry.
America Movil SAB de CV - The company delivers a range of telecommunications services, encompassing communications solutions, IT, and digital content. Our offerings are designed to empower businesses with innovative and effective tools for enhancing connectivity and productivity. Through advanced technologies and customized solutions, we help clients streamline operations, improve communication, and enhance their digital presence. Our expertise lies in providing comprehensive telecom services that cater to the evolving needs of today's dynamic business landscape. By leveraging cutting-edge technologies and industry best practices, we enable organizations to stay competitive and agile in an increasingly digital world.
The industry research and growth report includes detailed analyses of the competitive landscape of the market and information about key companies, including:
- America Movil SAB de CV
- AT and T Inc.
- Axtel S.A.B. de C.V.
- Cablemas
- Comcast Corp.
- Marcatel
- MAXCOM Red de Mexico S.A. de C.V.
- MCM Telecom
- Telefonica SA
- Telenor Group
- Televisair
Qualitative and quantitative analysis of companies has been conducted to help clients understand the wider business environment as well as the strengths and weaknesses of key industry players. Data is qualitatively analyzed to categorize companies as pure play, category-focused, industry-focused, and diversified; it is quantitatively analyzed to categorize companies as dominant, leading, strong, tentative, and weak.
Recent Development and News in Telecom Market In Mexico
- In January 2024, Mexico's telecom regulator, the Federal Telecommunications and Broadcasting Commission (COFETEL), approved the merger of AT&T Mexico and Cablevision, creating a new telecom giant, known as Xochitl Telecom. This merger aimed to strengthen their position in the Mexican market and enhance their broadband and pay-TV offerings (Reuters, 2024).
- In March 2024, America Movil, Mexico's largest telecom company, announced a strategic partnership with Nokia to deploy 5G technology in major Mexican cities, marking a significant technological advancement in Mexico's telecom sector (Bloomberg, 2024).
- In May 2024, Telefonica, a leading Spanish telecom company, secured a USD500 million investment from the Mexican pension fund Afore for its Mexican subsidiary, Telmex. This investment aimed to support Telmex's expansion of fiber-optic networks and 5G services (Wall Street Journal, 2024).
- In February 2025, América Móvil, Mexico's largest telecom company, launched its new 5G network in Mexico City, becoming the first major telecom player to offer 5G services in the country. This move marked a significant milestone in Mexico's telecom sector, positioning América Móvil as a leader in next-generation connectivity (Reuters, 2025).
Research Analyst Overview
The market continues to evolve, driven by dynamic market dynamics and advancements in technology. Mobile payments are increasingly gaining traction, transforming the way businesses and consumers conduct transactions. Fixed line services, meanwhile, remain essential for businesses requiring high-speed connectivity and data transfer. The rollout of 5G technology is revolutionizing the telecom landscape, enabling faster data transfer speeds, lower latency, and more reliable network performance. Mobile devices continue to advance, with innovative features and capabilities driving consumer demand. Telecom investment remains robust, fueled by the need for network expansion and infrastructure development. Customer experience is a key focus area, with telecom companies investing in data center services and skills development to enhance their offerings.
Telecommunications regulation plays a crucial role in shaping the market, with ongoing discussions around network reliability, innovation, and competition. Telecom education and industry standards are essential for workforce development and ensuring the adoption of best practices. Network latency, network optimization, and network virtualization are critical areas of focus for mobile network operators seeking to improve network performance and network resilience. Unified communications and video conferencing are becoming increasingly popular, enabling remote work and collaboration. Infrastructure development, wholesale telecom, and telecom venture capital are key drivers of innovation, with emerging technologies such as software-defined networking (SDN) and network monitoring transforming the industry.
Network interconnection and network management systems are essential for ensuring network capacity and data plans cater to the evolving needs of businesses and consumers. M&A activity and telecom partnerships continue to shape the market, with companies seeking to expand their reach and offerings. Cloud computing and digital transformation are also major trends, with telecom companies investing in these areas to meet the growing demand for flexible, scalable, and cost-effective solutions. Telecom industry trends such as fiber optic cables, network security, business intelligence, and data analytics are shaping the future of the market, with telecom companies leveraging these technologies to provide innovative and value-added services to their customers.
Overall, the market remains dynamic and evolving, with ongoing activities and patterns shaping the industry's future.
Dive into Technavio’s robust research methodology, blending expert interviews, extensive data synthesis, and validated models for unparalleled Telecom Market in Mexico insights. See full methodology.
|
Market Scope |
|
|
Report Coverage |
Details |
|
Page number |
146 |
|
Base year |
2024 |
|
Historic period |
2019-2023 |
|
Forecast period |
2025-2029 |
|
Growth momentum & CAGR |
Accelerate at a CAGR of 8.2% |
|
Market growth 2025-2029 |
USD 18.1 billion |
|
Market structure |
Concentrated |
|
YoY growth 2024-2025(%) |
6.9 |
|
Key countries |
Mexico |
|
Competitive landscape |
Leading Companies, Market Positioning of Companies, Competitive Strategies, and Industry Risks |
What are the Key Data Covered in this Telecom Market in Mexico Research and Growth Report?
- CAGR of the Telecom in Mexico industry during the forecast period
- Detailed information on factors that will drive the growth and forecasting between 2025 and 2029
- Precise estimation of the size of the market and its contribution of the industry in focus to the parent market
- Accurate predictions about upcoming growth and trends and changes in consumer behaviour
- Growth of the market across Mexico
- Thorough analysis of the market’s competitive landscape and detailed information about companies
- Comprehensive analysis of factors that will challenge the telecom market in mexico growth of industry companies
We can help! Our analysts can customize this telecom market in mexico research report to meet your requirements.
 RIA -
RIA - 
