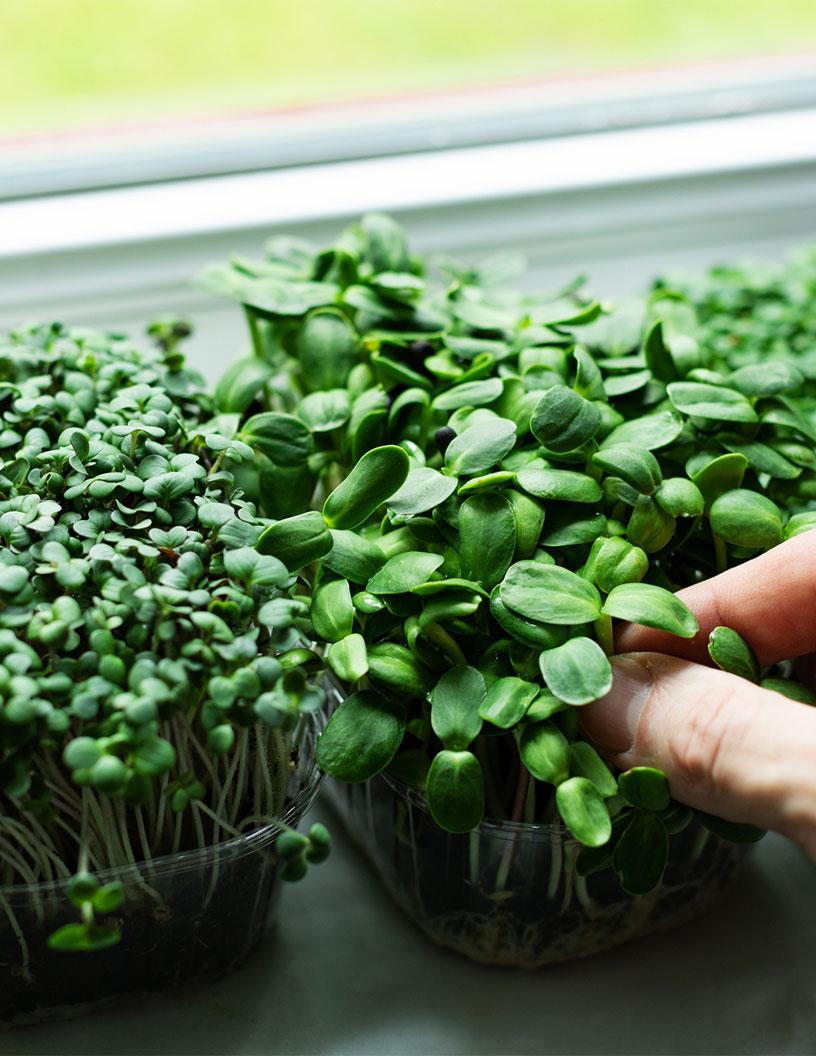
Microgreens Market Size 2025-2029
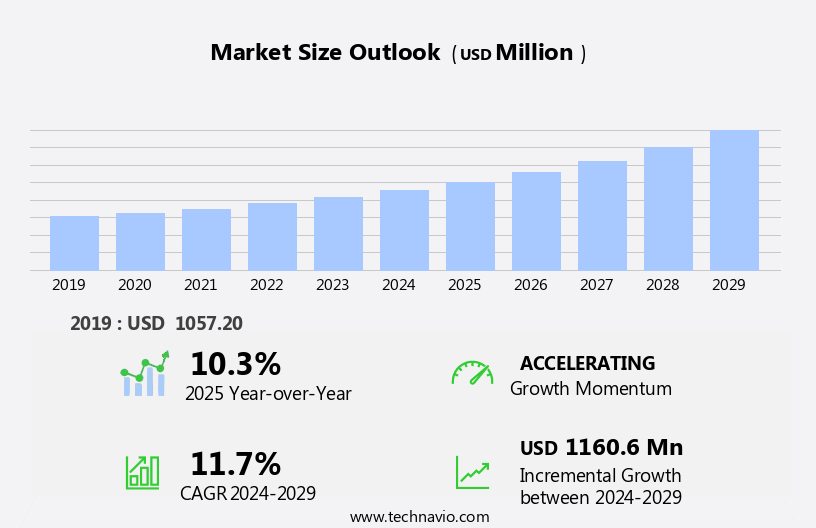
The microgreens market size is forecast to increase by USD 1.16 billion, at a CAGR of 11.7% between 2024 and 2029.
- The market is experiencing significant growth, driven by the increasing health awareness among consumers. As people become more conscious of their dietary needs, the demand for nutrient-dense and locally sourced produce is on the rise. This trend is further fueled by the expansion of urban farming and local expenditure, enabling easier access to fresh microgreens. However, the market faces challenges, primarily from the prevalence of seasonal variability. The unpredictability of crop yields due to seasonal changes can impact supply chain operations and pricing.
- To capitalize on market opportunities, companies must focus on implementing robust supply chain strategies, investing in research and development for year-round production, and collaborating with urban farmers to ensure a steady supply of high-quality microgreens. By navigating these challenges effectively, businesses can establish a strong presence in the market and cater to the growing demand for healthy, locally sourced produce. Advanced farming technologies, such as sensors, artificial intelligence, and automatic systems, are being employed to optimize production in hydroponic, aquaponics, and aeroponic systems.
What will be the Size of the Microgreens Market during the forecast period?
Explore in-depth regional segment analysis with market size data - historical 2019-2023 and forecasts 2025-2029 - in the full report.
Request Free Sample
The market continues to evolve, driven by the increasing adoption of innovative farming techniques and the growing demand for nutrient-dense, locally sourced produce. Indoor farming, utilizing vertical farming and aeroponic systems, has gained traction due to its ability to optimize yield, reduce water usage, and ensure consistent quality. Soil-less growing methods, such as hydroponics and air-water culture, have also gained popularity for their efficiency and ease of use. Organic growing practices are increasingly being incorporated into microgreens production, as consumers seek out healthier, more sustainable food options. Vitamin analysis and mineral content are key factors in product differentiation, with traceability systems ensuring transparency and food safety.
The food service industry and farmers markets have embraced microgreens for their culinary applications and health benefits. Controlled environment agriculture, including humidity control and climate management, is essential for maintaining optimal growing conditions. Nutritional value and yield optimization are critical factors in profitability analysis, with energy consumption and production costs under constant scrutiny. Pest control and crop rotation are essential aspects of sustainable agriculture, ensuring healthy, disease-free crops. Distribution channels, including grocery stores, subscription boxes, and seed starting trays, are expanding to meet growing consumer demand. The ongoing unfolding of market activities and evolving patterns in the microgreens industry promises continued innovation and growth.
How is this Microgreens Industry segmented?
The microgreens industry research report provides comprehensive data (region-wise segment analysis), with forecasts and estimates in "USD million" for the period 2025-2029, as well as historical data from 2019-2023 for the following segments.
- Type
- Indoor vertical farming
- Commercial greenhouse
- Others
- Distribution Channel
- Offline
- Online
- End-user
- Food service industry
- Retail consumers
- Food processors
- Variant
- Brassicaceae family
- Asteraceae family
- Amaranthaceae family
- Others
- Geography
- North America
- US
- Canada
- Europe
- France
- Germany
- Italy
- Russia
- UK
- APAC
- China
- India
- Japan
- Rest of World (ROW)
- North America
By Type Insights
The indoor vertical farming segment is estimated to witness significant growth during the forecast period.
Indoor vertical farming, a key trend in sustainable agriculture, employs hydroponic and aeroponic systems to grow microgreens. Hydroponics eliminates the need for soil, using nutrient-dense water solutions, while aeroponics cultivates plants in a mist-infused environment. Both methods enhance resource utilization, yield, and minimize environmental impacts. The indoor farming sector has experienced substantial growth, with companies like Gotham Greens leading the way. This urban agriculture firm operates hydroponic greenhouse facilities in New York City and Chicago, providing a year-round supply of fresh microgreens for the burgeoning demand of locally sourced produce. Microgreens production also prioritizes disease management through controlled environments and precise harvesting techniques.
Grow lights and climate control systems ensure optimal growing conditions. Soil-less growing media, such as coco coir, and hydroponic systems facilitate germination rate improvement and water usage efficiency. Traceability systems ensure food safety and product differentiation, while pest control measures maintain crop health. Distribution channels extend to restaurant supply, grocery stores, and direct-to-consumer sales through subscription boxes and farmers markets. The nutritional value and health benefits of microgreens, including high antioxidant levels and vitamin analysis, contribute to their popularity. Energy consumption is minimized through climate control and production cost optimization. Culinary applications in the food service industry and vertical farming's potential for yield optimization and climate control further drive market growth.
Organic growing practices and mineral analysis cater to consumer demand. Sustainable agriculture practices and crop rotation strategies ensure long-term profitability. Innovations like air-water culture, wick systems, and aeroponic systems expand the market's scope, providing diverse growing options for microgreens. Controlled environment agriculture and humidity control further optimize growing conditions, ensuring high-quality produce.
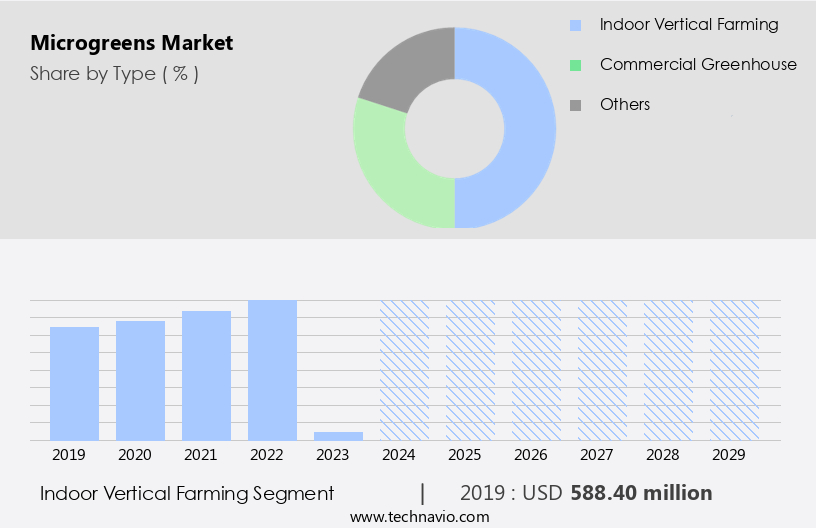
The Indoor vertical farming segment was valued at USD 588.40 billion in 2019 and showed a gradual increase during the forecast period.
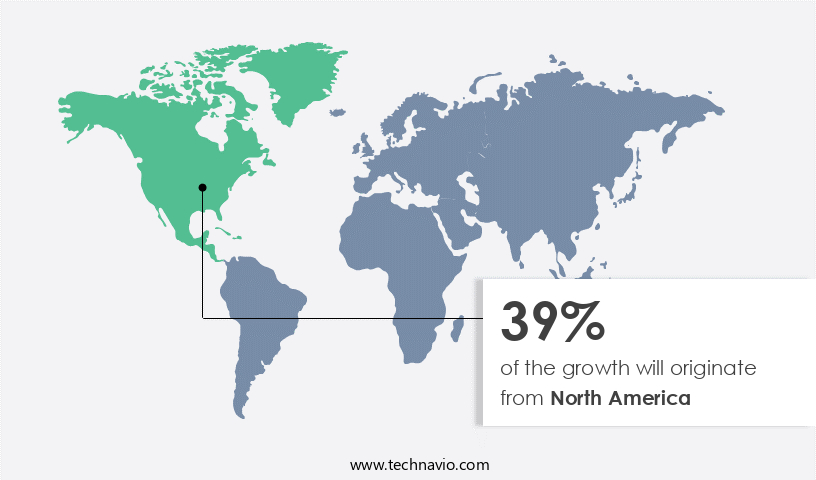
Regional Analysis
North America is estimated to contribute 39% to the growth of the global market during the forecast period.Technavio's analysts have elaborately explained the regional trends and drivers that shape the market during the forecast period.
The North American market is experiencing significant growth, fueled by increasing consumer interest in health and wellness, a preference for locally and sustainably sourced produce, and the demand for fresh, nutrient-dense foods. Microgreens, a subset of the broader hydroponic farming industry, have gained popularity due to their intense flavors and numerous health benefits. In the US, the market is thriving, driven by consumers' heightened awareness of the importance of healthy eating and the nutritional advantages of microgreens. Indoor farming techniques, including soil-less growing and hydroponic systems, enable year-round production, while climate control and humidity management ensure consistent quality.
Grow lights facilitate optimal growth, and traceability systems provide transparency. Pest control methods and food safety standards ensure product safety. Product differentiation is achieved through various cultivation techniques, such as air-water culture, wick systems, and vertical farming. Aeroponic systems and organic growing methods cater to diverse consumer preferences. The market's profitability is further boosted by efficient water usage, long shelf life, and various distribution channels, including grocery stores, restaurants, and subscription boxes. Seed starting trays and mineral analysis contribute to yield optimization, while sustainable agriculture practices align with consumer values. Culinary applications in the food service industry and farmers markets expand market reach, and health benefits fuel consumer demand.
Energy consumption remains a consideration for producers, and profitability analysis is essential for market success.
Market Dynamics
The Global Microgreens Market is experiencing robust expansion, driven by increasing consumer awareness of the nutritional benefits (microgreens) and a growing demand for health food products. Microgreens, cultivated using advanced techniques like vertical farming and hydroponics, offer a sustainable solution for food production. The market sees strong demand for varieties like organic microgreens and specific types such as broccoli microgreens. These nutrient-dense greens are increasingly utilized by restaurants and hotels for gourmet applications, and are readily available through retail grocery stores and the expanding online distribution channel. The rise of indoor farming and urban agriculture initiatives reflects a commitment to sustainable farming practices and controlled environment agriculture (CEA). The Asia Pacific Microgreens Market is a significant growth region, with microgreens producers adapting to global microgreens market trends and capitalizing on the superfood applications of these vibrant greens.
Our researchers analyzed the data with 2024 as the base year, along with the key drivers, trends, and challenges. A holistic analysis of drivers will help companies refine their marketing strategies to gain a competitive advantage.
What are the key market drivers leading to the rise in the adoption of Microgreens Industry?
- The heightened emphasis on public health and wellness serves as the primary catalyst for market growth.
- Microgreens, small edible plants grown from sprouted seeds, have gained significant attention in the food industry due to their nutritional benefits and versatility. The market for microgreens is experiencing growth as more consumers prioritize healthier food choices. These plants offer higher nutritional content than their mature counterparts, with some varieties containing up to 40 times more vitamins, minerals, and antioxidants. Production costs can be optimized through the use of various growth mediums and climate control systems, ensuring profitability analysis for businesses. Sustainable agriculture practices, such as hydroponics and aeroponics, are increasingly being adopted for microgreens cultivation. Direct-to-consumer sales have become a popular trend, allowing farmers to sell their produce directly to consumers, bypassing intermediaries and reducing energy consumption.
- Mineral analysis and yield optimization are crucial aspects of microgreens production, with different varieties offering unique nutritional profiles. Culinary applications of microgreens are vast, ranging from salads and sandwiches to smoothies and baked goods. Energy consumption in microgreens production is relatively low compared to traditional agriculture, making it an attractive option for businesses seeking to reduce their carbon footprint. Climate control systems are essential for maintaining optimal growing conditions, ensuring consistent yield and high-quality produce. Production costs can be further reduced through the use of sustainable energy sources, such as solar or wind power, and the implementation of automation technologies.
- In conclusion, the market is driven by the increasing demand for nutrient-dense foods, the discovery of unique health benefits, and the adoption of sustainable agriculture practices. The versatility of microgreens, combined with their low production costs and minimal energy consumption, make them an attractive option for businesses seeking to offer high-quality, healthy food products to consumers.
What are the market trends shaping the Microgreens Industry?
- Urban farming's expansion and the increase in local expenditures represent a significant market trend. This development signifies a growing emphasis on sustainable agriculture and self-sufficiency in food production.
- Microgreens, small edible plants grown from seeds, are gaining popularity due to their numerous health benefits and sustainable production methods. Vertical farming and aeroponic systems are commonly used for microgreens cultivation, allowing for controlled environment agriculture with optimal humidity and nutrient delivery. Organic growing practices ensure the production of microgreens with high nutritional value, as studies show they contain more vitamins and minerals than their mature counterparts. The food service industry and farmers markets are significant markets for microgreens due to their demand for fresh, local, and traceable produce. Consumers are increasingly health-conscious and value the nutritional benefits of microgreens.
- Controlled environment agriculture enables year-round production, ensuring a consistent supply. The trend toward sustainability and eco-friendliness is driving the growth of urban farming, as microgreens can be grown locally, reducing the carbon impact of food production and transport. Consumers appreciate the economic advantages of supporting local growers and businesses, making locally sourced microgreens a popular choice.
What challenges does the Microgreens Industry face during its growth?
- The seasonal variability, which is a significant challenge, impedes the growth of the industry due to its prevalence.
- Microgreens, young and delicate plants harvested at the beginning of their growth cycle, require optimal environmental conditions for optimal quality. Temperature, sunlight, and humidity significantly impact microgreen production, with some varieties preferring cooler climates and others thriving in warmer conditions. This seasonal dependency can result in inconsistent supply and price fluctuations on the market. Indoor farming techniques, such as soil-less growing in hydroponic systems and the use of grow lights, have gained popularity to mitigate the effects of seasonal changes on microgreen production. Disease management is also crucial in microgreen farming, as the plants are susceptible to various diseases due to their tender nature.
- Restaurant suppliers and consumers have shown increasing demand for microgreens due to their high antioxidant levels and water usage efficiency. Traceability systems are essential to ensure the origin and quality of microgreens, as they are susceptible to contamination. Coco coir, a common growing medium, is often used in microgreen production due to its water retention properties and sustainability. In conclusion, the market is influenced by various factors, including seasonal changes, production techniques, and consumer demand. Producers must employ effective disease management strategies and utilize indoor farming technologies to maintain consistent supply and quality, while ensuring traceability and sustainability.
Exclusive Customer Landscape
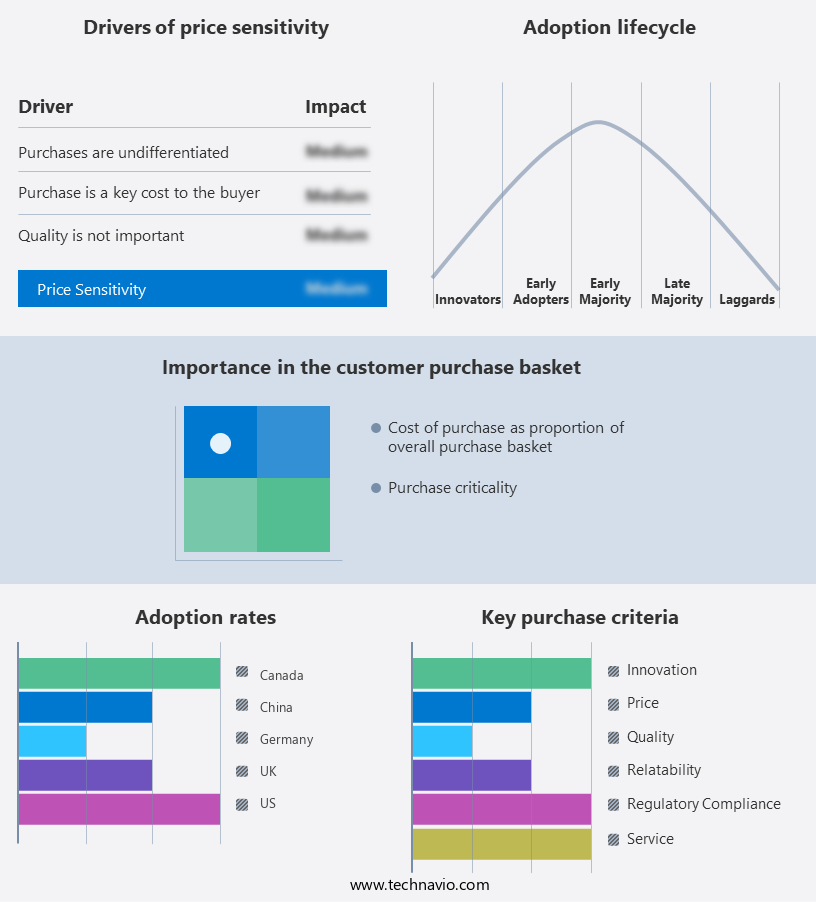
The microgreens market forecasting report includes the adoption lifecycle of the market, covering from the innovator's stage to the laggard's stage. It focuses on adoption rates in different regions based on penetration. Furthermore, the microgreens market report also includes key purchase criteria and drivers of price sensitivity to help companies evaluate and develop their market growth analysis strategies.
Customer Landscape
Key Companies & Market Insights
Companies are implementing various strategies, such as strategic alliances, microgreens market forecast, partnerships, mergers and acquisitions, geographical expansion, and product/service launches, to enhance their presence in the industry.
AeroFarms LLC - This company specializes in the production and distribution of a diverse range of microgreens, including micro wasabi, micro supermix, micro broccoli, and micro arugula. Microgreens are nutrient-dense young plants, harvested just after the first set of true leaves emerge. Their consumption provides various health benefits, making them a popular choice for health-conscious individuals. The company's microgreens are grown using sustainable farming practices, ensuring consistent quality and freshness.
The industry research and growth report includes detailed analyses of the competitive landscape of the market and information about key companies, including:
- AeroFarms LLC
- Arizona Microgreens
- BrightFresh
- Charlies Produce
- Dream Harvest
- Emerald Gardens Farm
- Farm.One Inc.
- Freight Farms Inc.
- Fresh Origins
- garden guru
- Gotham Greens Holdings LLC
- Kalera Inc
- Living Earth Farm
- Long Island Microgreens
- Metro Microgreens
- Quantum Microgeens
- Suba Seeds Co
- Teshuva Agricultural Projects
- The Chefs Garden
- Tru Leaf
Qualitative and quantitative analysis of companies has been conducted to help clients understand the wider business environment as well as the strengths and weaknesses of key industry players. Data is qualitatively analyzed to categorize companies as pure play, category-focused, industry-focused, and diversified; it is quantitatively analyzed to categorize companies as dominant, leading, strong, tentative, and weak.
Recent Development and News in Microgreens Market
- In January 2024, BrightFarms, a leading hydroponic microgreens producer, announced a strategic partnership with Whole Foods Market to expand its microgreens offerings in over 300 Whole Foods stores across the US (BrightFarms Press Release).
- In March 2024, AeroFarms, a vertical farming company specializing in microgreens, raised USD200 million in Series D funding, bringing its total funding to USD430 million, to accelerate its global expansion and technology development (AeroFarms Press Release).
- In April 2024, Plenty, a San Francisco-based vertical farming company, launched its microgreens product line in Walmart stores, marking a significant geographic expansion for the company (Plenty Press Release).
- In May 2025, Bonduelle, a leading global vegetable processing company, acquired Green Spirit Growers, a microgreens producer, to strengthen its position in the growing the market and expand its product portfolio (Bonduelle Press Release).
Research Analyst Overview
- The market, encompassing export and import sectors, exhibits significant growth, driven by consumer preferences for healthier, locally sourced produce. Growing medium innovations, such as light spectrum optimization, enable year-round production and improve business model efficiency. Supply chain management strategies, including temperature control and environmental monitoring, ensure product quality and sustainability. Pricing strategies and product lifecycle management are crucial for economic viability, while seed variety diversity caters to evolving consumer tastes and social impact. Sustainability initiatives, such as waste management and water quality control, enhance competitive advantage.
- Food processing technologies and value-added products broaden market reach, while disease resistance, pest management, air circulation, and quality assurance measures bolster consumer trust. Ph adjustment and nutrient solution optimization further enhance product quality, aligning with brand awareness efforts and irrigation system advancements.
Dive into Technavio's robust research methodology, blending expert interviews, extensive data synthesis, and validated models for unparalleled Microgreens Market insights. See full methodology.
|
Market Scope |
|
|
Report Coverage |
Details |
|
Page number |
218 |
|
Base year |
2024 |
|
Historic period |
2019-2023 |
|
Forecast period |
2025-2029 |
|
Growth momentum & CAGR |
Accelerate at a CAGR of 11.7% |
|
Market growth 2025-2029 |
USD 1160.6 million |
|
Market structure |
Fragmented |
|
YoY growth 2024-2025(%) |
10.3 |
|
Key countries |
US, China, Germany, UK, Russia, Canada, France, Japan, India, and Italy |
|
Competitive landscape |
Leading Companies, Market Positioning of Companies, Competitive Strategies, and Industry Risks |
What are the Key Data Covered in this Microgreens Market Research and Growth Report?
- CAGR of the Microgreens industry during the forecast period
- Detailed information on factors that will drive the growth and forecasting between 2025 and 2029
- Precise estimation of the size of the market and its contribution of the industry in focus to the parent market
- Accurate predictions about upcoming growth and trends and changes in consumer behaviour
- Growth of the market across North America, Europe, APAC, South America, and Middle East and Africa
- Thorough analysis of the market's competitive landscape and detailed information about companies
- Comprehensive analysis of factors that will challenge the microgreens market growth of industry companies
We can help! Our analysts can customize this microgreens market research report to meet your requirements.
 RIA -
RIA - 
