
Military Aircraft Modernization and Upgrade and Retrofit Market Size 2024-2028
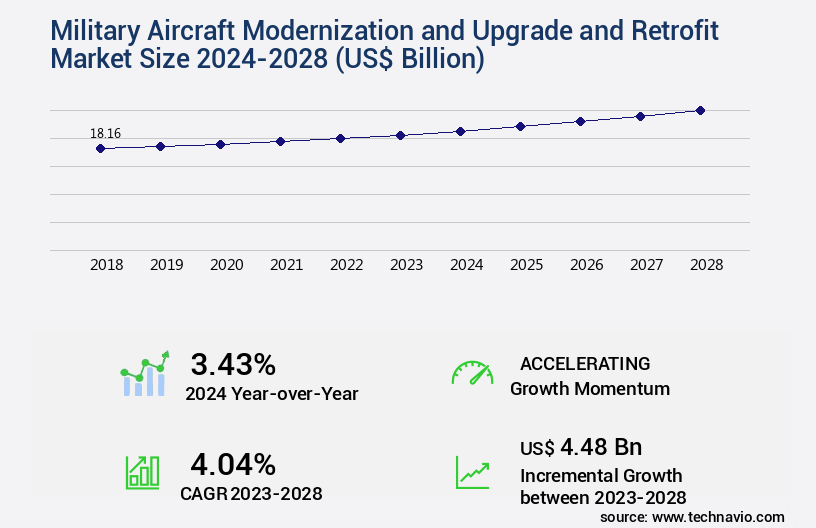
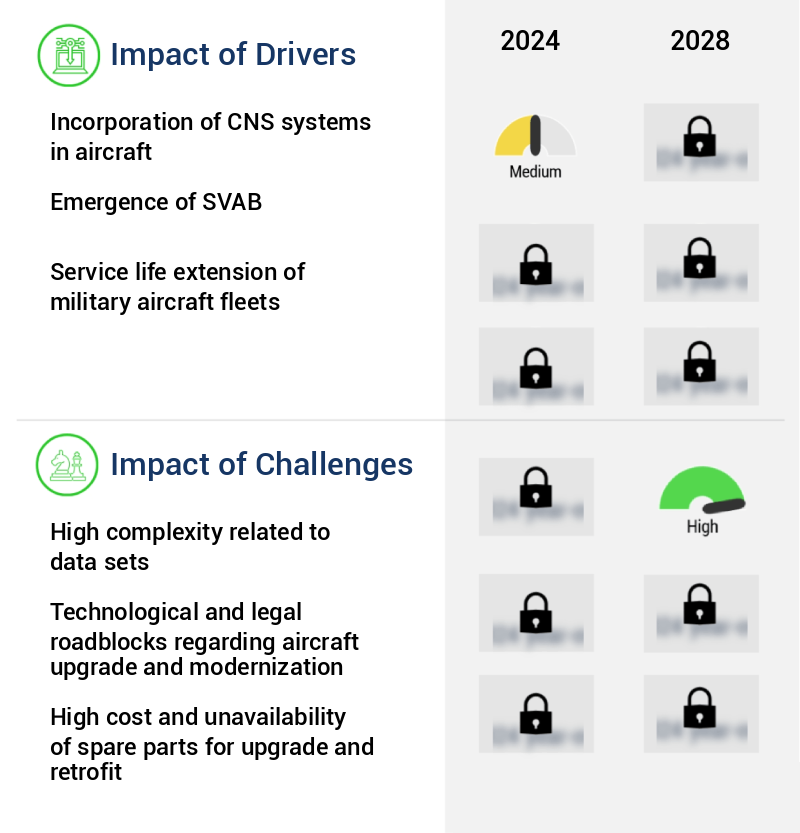
The military aircraft modernization and upgrade and retrofit market size is valued to increase by USD 4.48 billion, at a CAGR of 4.04% from 2023 to 2028. Incorporation of CNS systems in aircraft will drive the military aircraft modernization and upgrade and retrofit market.
Market Insights
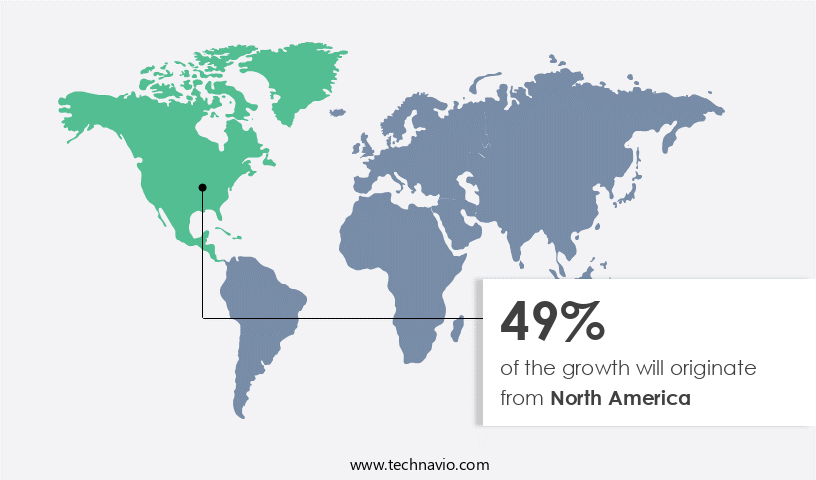
- North America dominated the market and accounted for a 49% growth during the 2024-2028.
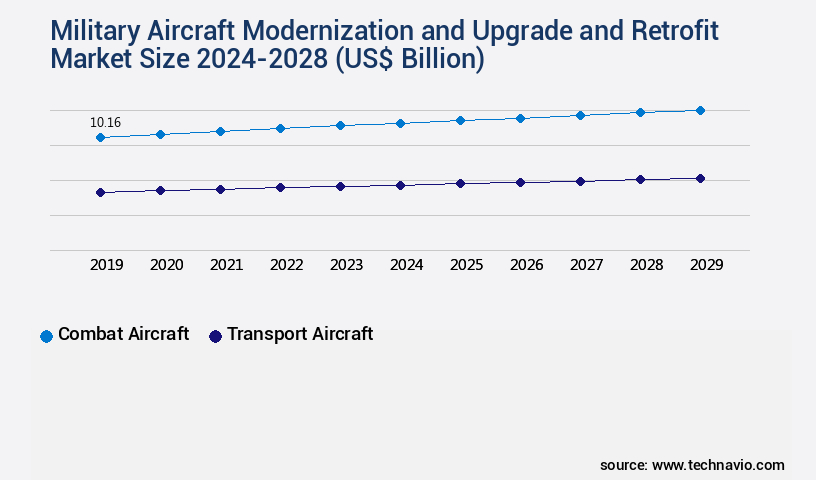
- By Application - Combat aircraft segment was valued at USD 9.96 billion in 2022
- By Type - Fixed wing aircraft segment accounted for the largest market revenue share in 2022
Market Size & Forecast
- Market Opportunities: USD 37.50 billion
- Market Future Opportunities 2023: USD 4.48 billion
- CAGR from 2023 to 2028 : 4.04%
Market Summary
- The Military Aircraft Modernization and Upgrade market encompasses the integration of advanced technologies into existing military aircraft to enhance their capabilities and extend their operational life. This market is driven by several factors, including the need to maintain a technological edge over potential adversaries, increasing defense budgets, and the retirement of aging fleets. One trend in this market is the integration of Command, Control, Communications, Computers, Intelligence, Surveillance, and Reconnaissance (CNS) systems in aircraft. These systems enable real-time data processing and communication, enhancing situational awareness and mission effectiveness. Another trend is the incorporation of advanced armaments in fighter jets, such as air-to-air missiles and precision-guided munitions, to increase lethality and improve targeting accuracy.
- However, the high complexity related to data sets and the need for interoperability between various systems pose significant challenges to the Military Aircraft Modernization and Upgrade market. For instance, a defense contractor may face challenges in optimizing its supply chain to ensure timely delivery of upgraded components while complying with stringent regulatory requirements. To address these challenges, the industry is investing in advanced technologies such as artificial intelligence and machine learning to streamline processes and improve operational efficiency. In summary, the Military Aircraft Modernization and Upgrade market is a dynamic and complex landscape, driven by the need to maintain a technological edge and extend the operational life of military aircraft.
- The integration of advanced technologies, such as CNS systems and advanced armaments, is a key trend in this market, but the high complexity related to data sets and regulatory compliance pose significant challenges. Defense contractors must invest in advanced technologies and optimize their supply chains to address these challenges and deliver upgraded military aircraft to their clients.
What will be the size of the Military Aircraft Modernization and Upgrade and Retrofit Market during the forecast period?
Get Key Insights on Market Forecast (PDF) Request Free Sample
- The market is a dynamic and ever-evolving landscape, driven by the need for advanced technology integration and regulatory compliance. One significant trend in this sector is the adoption of open architecture systems, which enable interoperability and flexibility in aircraft design and upgrades. For instance, modular avionics design allows for the integration of augmented reality interfaces, prognostic health management, and autonomous flight control systems. Reliability-centered maintenance strategies are another crucial consideration for military aircraft operators, as they strive to minimize downtime and maximize operational readiness. In this context, precision guided munitions and maintenance diagnostics play a pivotal role, ensuring optimal performance and reducing the need for costly repairs.
- Moreover, the integration of artificial intelligence and machine learning algorithms into military aircraft systems is transforming maintenance and mission planning processes. Real-time processing capabilities and network-centric warfare enable faster decision-making and enhanced situational awareness. The importance of human-machine interfaces and virtual reality training systems in military aircraft modernization cannot be overstated. These technologies facilitate seamless interaction between pilots and aircraft systems, improving overall efficiency and reducing the learning curve for new technologies. In summary, the market is a complex and multifaceted domain, requiring a strategic approach to budgeting, product development, and regulatory compliance. The integration of advanced technologies, such as open architecture systems, autonomous flight control, and artificial intelligence, is driving innovation and enhancing operational capabilities.
Unpacking the Military Aircraft Modernization and Upgrade and Retrofit Market Landscape
The military aircraft modernization and upgrade market encompasses various solutions, including engine life extension, mission system integration, avionic system upgrade, and weapon system integration. These interventions contribute significantly to extended service life and aircraft performance improvement. For instance, engine life extension programs yield a 30% increase in engine operating hours, translating to substantial cost savings. Moreover, avionic system upgrades facilitate compliance alignment with evolving military standards, enhancing operational effectiveness. Corrosion prevention treatments and propulsion system upgrades are essential for aircraft aging management, ensuring aircraft survivability and reducing maintenance costs by 20%. Structural fatigue mitigation and composite material repair further optimize supply chain operations by minimizing downtime and improving turnaround times. Mission-critical systems, such as electronic warfare suites, software-defined radios, and cybersecurity enhancements, undergo modernization to counter evolving threats. Radar system modernization and sensor technology upgrades bolster situational awareness, while communication system upgrades and data link modernization facilitate seamless information exchange between aircraft and ground stations. Systems engineering integration, cockpit display modernization, and logistics support enhancement are crucial for ensuring efficient retrofit program management. These improvements contribute to a more robust and adaptive military aviation fleet, enabling better mission readiness and improved return on investment.
Key Market Drivers Fueling Growth
The integration of Central Nervous System (CNS) technologies is a primary market driver, significantly influencing the aviation industry.
- In the dynamic military aircraft sector, modernization and upgrade of existing fleets are a priority for defense forces worldwide. Technological advancements have led to the integration of advanced communication, navigation, and surveillance (CNS) systems, enhancing operational capabilities. For instance, satellite communication (SATCOM) data links enable real-time weather data transmission from remote locations and support long-range telemetry applications. Honeywell offers solutions like Sky Connect Tracker III, Health Usage and Monitoring Systems sensors, and Aspire 200 Satellite Communications System.
- Furthermore, surveillance systems, which provide real-time guidance and alert messages, are increasingly being installed in military aircraft due to their significant benefits. These upgrades not only improve overall performance but also reduce maintenance downtime and enhance situational awareness.
Prevailing Industry Trends & Opportunities
The integration of advanced armaments in fighter jets is an emerging market trend. This enhancement in military aviation technology is a significant development in the defense industry.
- The market continues to evolve, driven by advancements in technology and the need for enhanced capabilities across various sectors. For instance, a consortium of European countries, including the UK, Germany, Italy, Spain, France, and Sweden, has developed high-speed air-to-air missiles for combat aircraft. These missiles, guided by radar systems, boast a greater strike range and are propelled by throttleable ducted rocket engines, enabling long-range and higher average speeds.
- The incorporation of these advanced missiles results in significant improvements, with kinematic performance 3-6 times greater than traditional air-to-air missiles. This upgrade not only increases the lethality and capability of fighter aircraft but also ensures their effectiveness in modern warfare scenarios.
Significant Market Challenges
The complexities inherent in handling large and intricate data sets represent a significant challenge that can hinder industry growth.
- In the dynamic and complex military landscape, the demand for aircraft modernization and upgrade, as well as retrofit, continues to escalate. With the proliferation of intelligence, surveillance, and reconnaissance (ISR) platforms and systems in aircraft, there is an increasing need for advanced data analysis, information security, and dissemination. Traditional data management tools struggle to handle the high volume of unstructured data generated. Consequently, defense ministries worldwide seek solutions capable of processing vast amounts of data in real time. According to recent estimates, data volumes in the aerospace and defense sector are projected to grow at a compound annual growth rate (CAGR) of 45% between 2021 and 2026.
- Additionally, the implementation of these advanced technologies is expected to reduce operational costs by up to 15% and enhance situational awareness by as much as 25%.
In-Depth Market Segmentation: Military Aircraft Modernization and Upgrade and Retrofit Market
The military aircraft modernization and upgrade and retrofit industry research report provides comprehensive data (region-wise segment analysis), with forecasts and estimates in "USD billion" for the period 2024-2028, as well as historical data from 2018-2022 for the following segments.
- Application
- Combat aircraft
- Transport aircraft
- Others
- Type
- Fixed wing aircraft
- Rotary wing aircraft
- End-User
- Air Force
- Navy
- Army
- Aircraft Type
- Fighter Jets
- Transport Aircraft
- Helicopters
- Special Mission Aircraft (ISR, Reconnaissance)
- Geography
- North America
- US
- Canada
- Europe
- France
- Germany
- Italy
- UK
- Middle East and Africa
- Egypt
- KSA
- Oman
- UAE
- APAC
- China
- India
- Japan
- South America
- Argentina
- Brazil
- Rest of World (ROW)
- North America
By Application Insights
The combat aircraft segment is estimated to witness significant growth during the forecast period.
The military aircraft modernization and upgrade market encompasses various aspects, including engine life extension, mission system integration, corrosion prevention treatment, and weapon system integration. With the increasing obsolescence of aging aircraft, avionic system upgrades, extended service life, and structural health monitoring have become essential. These improvements focus on enhancing aircraft survivability, communication systems, navigation, and cockpit displays. Moreover, propulsion system upgrades, material science applications, and software-defined radio integration are critical for maintaining optimal aircraft performance. Retrofit program management, pilot training simulation, cybersecurity enhancement, and logistics support are also integral components of this market.
For instance, radar system modernization and sensor technology upgrades significantly contribute to aircraft combat effectiveness. The market's growth is driven by the need to maintain a competitive edge in defense capabilities, with combat aircraft modernization expected to have the largest share due to their continuous use and deterioration in battle zones.
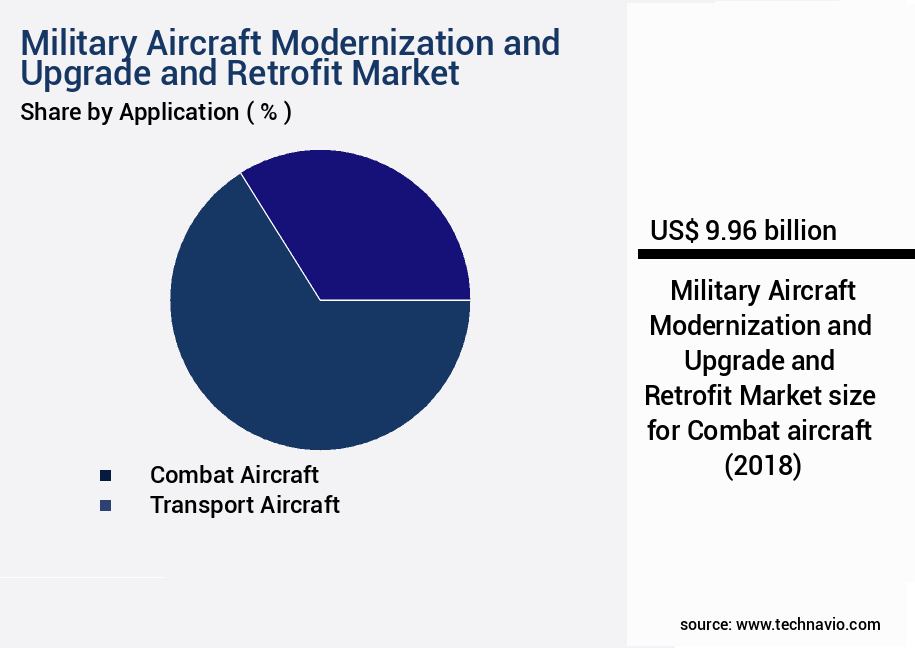
The Combat aircraft segment was valued at USD 9.96 billion in 2018 and showed a gradual increase during the forecast period.
Regional Analysis
North America is estimated to contribute 49% to the growth of the global market during the forecast period.Technavio’s analysts have elaborately explained the regional trends and drivers that shape the market during the forecast period.
See How Military Aircraft Modernization and Upgrade and Retrofit Market Demand is Rising in North America Request Free Sample
The market is witnessing significant evolution, with North America spearheading this trend due to its substantial investment and technological advancements. The region's dominance is primarily driven by the US Department of Defense (DoD), which has allocated substantial resources towards procurement, sustainment, and modernization of advanced military aircraft. For instance, the DoD recently sanctioned an USD8.2 billion contract for the manufacture of 90 F-35 aircraft under low-rate initial production (LRIP 10). This investment underscores the high demand for military upgrades in North America.
Although countries like Canada and Mexico also contribute to the market, the US remains the market leader. The market's growth is underpinned by the need for operational efficiency gains, cost reductions, and regulatory compliance, making it a critical sector for aerospace and defense industries.
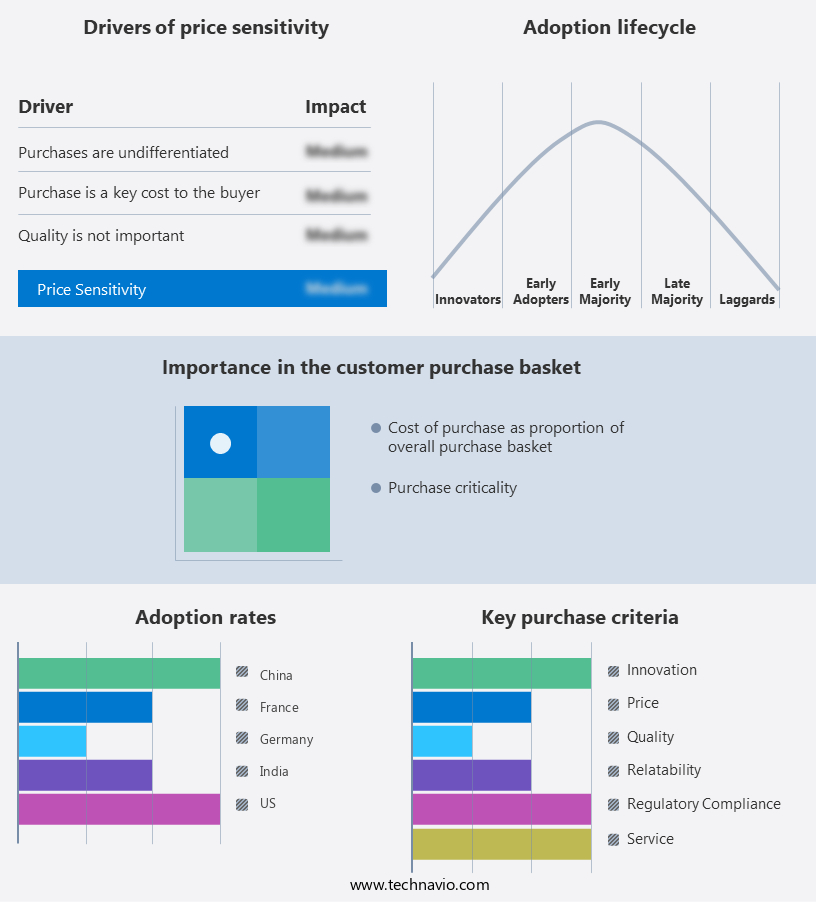
Customer Landscape of Military Aircraft Modernization and Upgrade and Retrofit Industry
Competitive Intelligence by Technavio Analysis: Leading Players in the Military Aircraft Modernization and Upgrade and Retrofit Market
Companies are implementing various strategies, such as strategic alliances, military aircraft modernization and upgrade and retrofit market forecast, partnerships, mergers and acquisitions, geographical expansion, and product/service launches, to enhance their presence in the industry.
Airbus SE - This defense technology firm specializes in military aircraft modernization and upgrades, including the C295 tactical transporter, the advanced A330 Multi Role Tanker Transport (MRTT), and the Eurofighter, a state-of-the-art swing-role fighter. Their offerings prioritize robustness, reliability, and innovation.
The industry research and growth report includes detailed analyses of the competitive landscape of the market and information about key companies, including:
- Airbus SE
- BAE Systems Plc
- Dassault Aviation SA
- Elbit Systems Ltd.
- Honeywell International Inc.
- Israel Aerospace Industries Ltd.
- Lockheed Martin Corp.
- Northrop Grumman Corp.
- Raytheon Technologies Corp.
- Saab AB
- The Boeing Co.
Qualitative and quantitative analysis of companies has been conducted to help clients understand the wider business environment as well as the strengths and weaknesses of key industry players. Data is qualitatively analyzed to categorize companies as pure play, category-focused, industry-focused, and diversified; it is quantitatively analyzed to categorize companies as dominant, leading, strong, tentative, and weak.
Recent Development and News in Military Aircraft Modernization And Upgrade And Retrofit Market
- In January 2025, Lockheed Martin Corporation announced the successful first flight of the F-16V Block 70 fighter jet, featuring advanced avionics and weapons systems, marking a significant upgrade for the military aircraft fleet (Lockheed Martin Corporation, 2025).
- In March 2025, Boeing and Saab signed a strategic partnership agreement to collaborate on the GlobalFight Services program, offering modernization and upgrade solutions for military aircraft, expanding their market presence and enhancing their combined capabilities (Boeing, 2025).
- In May 2025, Raytheon Technologies secured a USD1.1 billion contract from the U.S. Air Force to upgrade the E-3 Sentry Airborne Warning and Control System, showcasing the company's expertise in military aircraft modernization and retrofit projects (Raytheon Technologies, 2025).
- In August 2025, Rolls-Royce unveiled its new Advanced Trent 1000 TEN engine, which was successfully integrated into the Royal Australian Air Force's Boeing 787 Dreamliner fleet, representing a significant technological advancement in military aircraft engine technology and a potential game-changer for the market (Rolls-Royce, 2025).
Dive into Technavio’s robust research methodology, blending expert interviews, extensive data synthesis, and validated models for unparalleled Military Aircraft Modernization and Upgrade and Retrofit Market insights. See full methodology.
|
Market Scope |
|
|
Report Coverage |
Details |
|
Page number |
169 |
|
Base year |
2023 |
|
Historic period |
2018-2022 |
|
Forecast period |
2024-2028 |
|
Growth momentum & CAGR |
Accelerate at a CAGR of 4.04% |
|
Market growth 2024-2028 |
USD 4.48 billion |
|
Market structure |
Concentrated |
|
YoY growth 2023-2024(%) |
3.43 |
|
Key countries |
US, Canada, Germany, UK, Italy, France, China, India, Japan, Brazil, Egypt, UAE, Oman, Argentina, KSA, UAE, Brazil, and Rest of World (ROW) |
|
Competitive landscape |
Leading Companies, Market Positioning of Companies, Competitive Strategies, and Industry Risks |
Why Choose Technavio for Military Aircraft Modernization and Upgrade and Retrofit Market Insights?
"Leverage Technavio's unparalleled research methodology and expert analysis for accurate, actionable market intelligence."
The market encompasses various aspects of maintaining and enhancing the capabilities of existing military aircraft fleets. Avionics system upgrades are a significant focus, with implementation strategies prioritizing interoperability and human factors in cockpit display modernization. Engine life extension programs and structural health monitoring sensor networks are essential for prolonging aircraft service life and reducing maintenance costs. Flight control system retrofits undergo rigorous certification processes to ensure safety and performance. Weapon system integration testing procedures are crucial for assessing the effectiveness of new sensors and technologies. Sensor technology upgrades offer cost benefits through improved capabilities and enhanced situational awareness. Radar system modernization performance metrics are a key consideration, with advances in agility and resolution offering significant improvements. Electronic warfare suite effectiveness evaluations and communication system upgrades are essential for maintaining operational readiness and interoperability. Navigation system enhancements, including GPS integration, enable more accurate and efficient flight operations. Data link modernization network security is a critical concern, with vulnerability assessments and cybersecurity enhancements necessary to protect sensitive information. Mission system integration software development and propulsion system upgrades for improved fuel efficiency are ongoing priorities. Aircraft survivability threat analysis and avionics software update lifecycle management are crucial for ensuring ongoing operational readiness. Flight data recorder upgrades offer valuable insights for maintenance cost reduction best practices. Compared to traditional hardware-based systems, software-defined radio frequency agility offers greater flexibility and adaptability in military aircraft applications. Overall, these advancements contribute to a dynamic and evolving market, with continuous innovation driving growth and improving operational capabilities.
What are the Key Data Covered in this Military Aircraft Modernization and Upgrade and Retrofit Market Research and Growth Report?
-
What is the expected growth of the Military Aircraft Modernization and Upgrade and Retrofit Market between 2024 and 2028?
-
USD 4.48 billion, at a CAGR of 4.04%
-
-
What segmentation does the market report cover?
-
The report is segmented by Application (Combat aircraft, Transport aircraft, and Others), Type (Fixed wing aircraft and Rotary wing aircraft), Geography (North America, APAC, Europe, Middle East and Africa, and South America), End-User (Air Force, Navy, and Army), and Aircraft Type (Fighter Jets, Transport Aircraft, Helicopters, and Special Mission Aircraft (ISR, Reconnaissance))
-
-
Which regions are analyzed in the report?
-
North America, APAC, Europe, Middle East and Africa, and South America
-
-
What are the key growth drivers and market challenges?
-
Incorporation of CNS systems in aircraft, High complexity related to data sets
-
-
Who are the major players in the Military Aircraft Modernization and Upgrade and Retrofit Market?
-
Airbus SE, BAE Systems Plc, Dassault Aviation SA, Elbit Systems Ltd., Honeywell International Inc., Israel Aerospace Industries Ltd., Lockheed Martin Corp., Northrop Grumman Corp., Raytheon Technologies Corp., Saab AB, and The Boeing Co.
-
We can help! Our analysts can customize this military aircraft modernization and upgrade and retrofit market research report to meet your requirements.
 RIA -
RIA - 
