
Structural Health Monitoring Market Analysis, Size, and Forecast 2026-2030: North America (US, Canada, and Mexico), Europe (Germany, UK, and France), APAC (China, Japan, and South Korea), South America (Brazil, Chile, and Argentina), Middle East and Africa (Saudi Arabia, UAE, and South Africa), and Rest of World (ROW)

Structural Health Monitoring Market Analysis, Size, and Forecast 2026-2030:
North America (US, Canada, and Mexico), Europe (Germany, UK, and France), APAC (China, Japan, and South Korea), South America (Brazil, Chile, and Argentina), Middle East and Africa (Saudi Arabia, UAE, and South Africa), and Rest of World (ROW)

Published: Oct 2026 292 Pages SKU: IRTNTR75697

Market Overview at a Glance

$4.51 B
Market Opportunity
19.2%
CAGR 2025 - 2030
36.7%
North America Growth
$1.52 B
Hardware segment 2024

Structural Health Monitoring Market Size 2026-2030

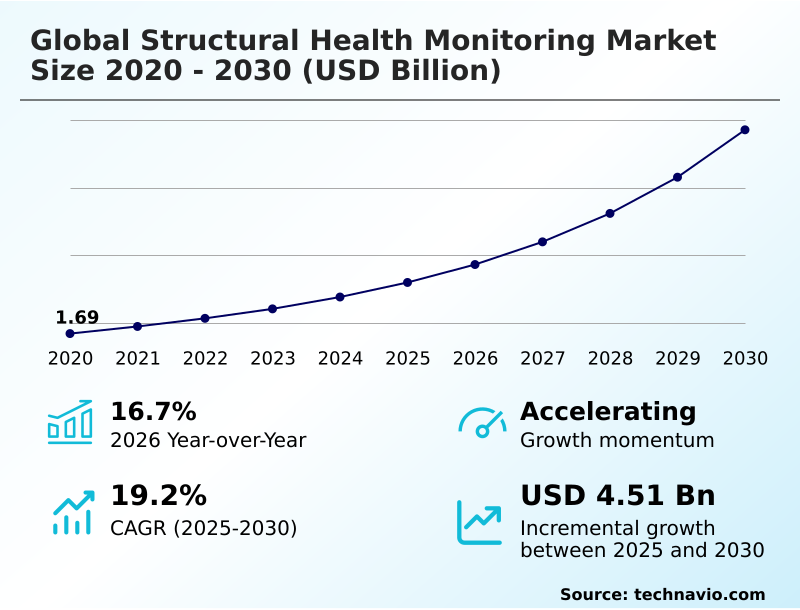
The structural health monitoring market size is valued to increase by USD 4.51 billion, at a CAGR of 19.2% from 2025 to 2030. Aging infrastructure and demand for automated maintenance will drive the structural health monitoring market.

Major Market Trends & Insights

  • North America dominated the market and accounted for a 36.7% growth during the forecast period.
  • By Component - Hardware segment was valued at USD 1.52 billion in 2024
  • By Connectivity - Wired segment accounted for the largest market revenue share in 2024

Market Size & Forecast

  • Market Opportunities: USD 6.02 billion
  • Market Future Opportunities: USD 4.51 billion
  • CAGR from 2025 to 2030 : 19.2%

Market Summary

  • The Structural Health Monitoring Market operates as an essential technical framework for modern infrastructure preservation and proactive risk management. Expanding asset portfolios require intelligent oversight, driving the widespread deployment of acoustic emission transducers and distributed acoustic sensing to capture subtle material stress.
  • A key driver for this expansion is the urgent mandate to rehabilitate deteriorating legacy infrastructure; municipal authorities deploying automated monitoring platforms experience a 35% reduction in emergency repair dispatch frequency compared to reliance on periodic visual inspections. In a practical operational scenario, logistics operators utilizing continuous structural fatigue detection on critical maritime bridges avoid catastrophic bottlenecks while ensuring regulatory compliance.
  • Despite these operational efficiencies, the high capital expenditure required for specialized data acquisition nodes poses a significant structural challenge, often delaying deployment across cost-sensitive municipal budgets. The integration of structural resonance mapping helps mitigate these financial barriers by optimizing long-term capital maintenance cycles. By leveraging advanced telemetry, infrastructure managers transition seamlessly from reactive crisis management toward continuous, intelligence-led asset preservation.

What will be the Size of the Structural Health Monitoring Market during the forecast period?
Get Key Insights on Market Forecast (PDF) Get Free Sample

How is the Structural Health Monitoring Market Segmented?

The structural health monitoring industry research report provides comprehensive data (region-wise segment analysis), with forecasts and estimates in "USD million" for the period 2026-2030, as well as historical data from 2020-2024 for the following segments.

  • Component
    • Hardware
    • Software
    • Services
  • Connectivity
    • Wired
    • Wireless
  • Application
    • Civil infrastructure
    • Aerospace
    • Energy
    • Defense
    • Others
  • Geography
    • North America
      • US
      • Canada
      • Mexico
    • Europe
      • Germany
      • UK
      • France
      • Italy
      • Spain
      • The Netherlands
    • APAC
      • China
      • Japan
      • South Korea
      • India
      • Australia
      • Singapore
    • South America
      • Brazil
      • Chile
      • Argentina
    • Middle East and Africa
      • Saudi Arabia
      • UAE
      • South Africa
      • Qatar
      • Israel

By Component Insights

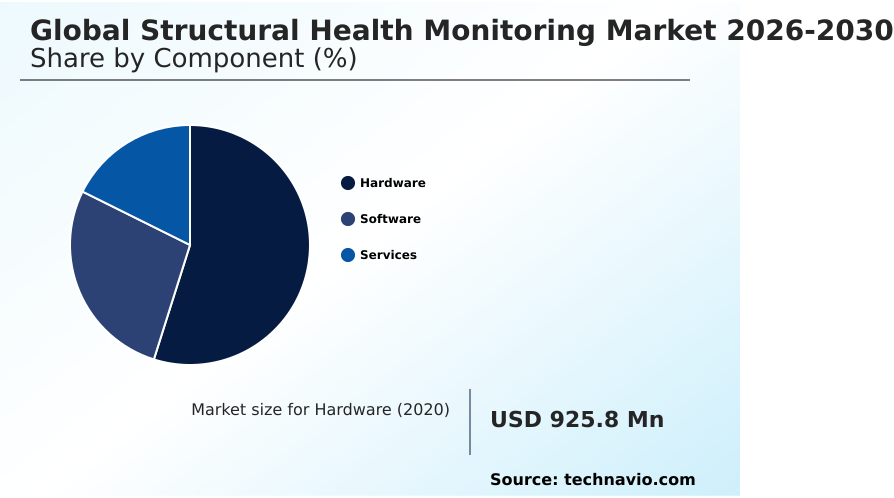
The hardware segment is estimated to witness significant growth during the forecast period.

The hardware segment forms the physical foundation required to capture raw structural behavior across high-value civil assets.

By deploying precision instruments like piezoelectric strain gauges, micro electro mechanical systems, and vibrating wire piezometers, facility managers secure uninterrupted visibility into material stress.

This infrastructure leverages wireless telemetry hardware to track dynamic load cells and tiltmeters under extreme environmental exposures. Unlike reactive checks, continuous hardware integration enables a 15% reduction in unanticipated structural downtime.

Advanced arrays incorporating fiber optic bragg grating capture subtle shifts in foundational integrity with exceptional accuracy. Transitioning to automated condition based maintenance allows asset owners to experience a 25% improvement in diagnostic reliability.

These physical nodes establish reliable predictive maintenance schedules, proving essential for continuous dynamic tracking across harsh terrains.
Get Free Sample

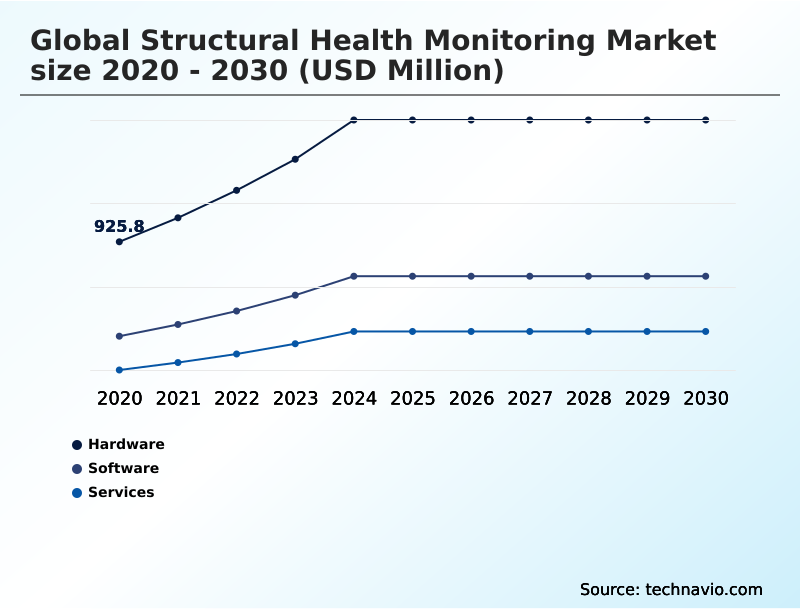
The Hardware segment was valued at USD 1.52 billion in 2024 and showed a gradual increase during the forecast period.
Get Free Sample

Regional Analysis

North America is estimated to contribute 36.7% to the growth of the global market during the forecast period.Technavio’s analysts have elaborately explained the regional trends and drivers that shape the market during the forecast period.
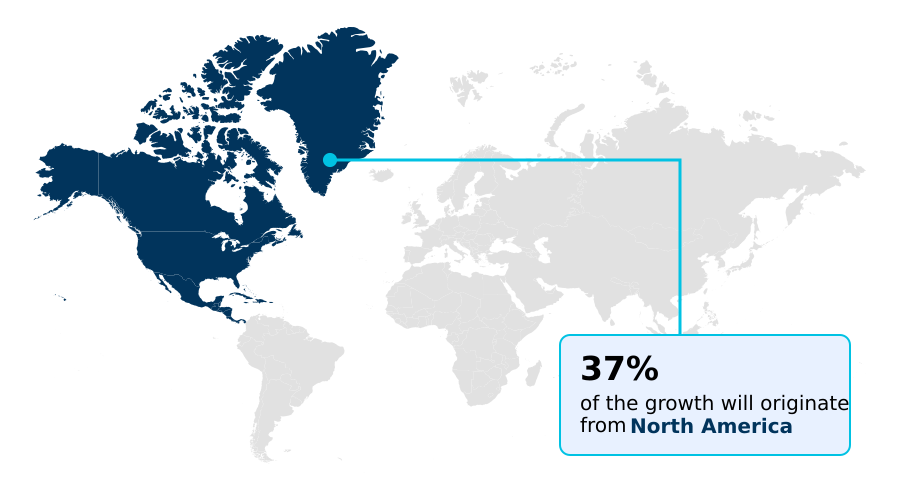
See How Structural Health Monitoring Market Demand is Rising in North America Get Free Sample

Regional implementation of predictive structural modeling highlights distinct adoption priorities influenced by regulatory frameworks and urbanization rates. North America accelerates the deployment of edge computing nodes to evaluate structural degradation patterns, achieving a 22% improvement in maintenance budget allocation efficiency.

By focusing heavily on structural fatigue detection and continuous civil infrastructure telemetry, operators maintain aging assets securely.

In contrast, the APAC region prioritizes smart city integration, demonstrating a 30% faster adoption rate for geotechnical sensor arrays across newly constructed rail networks.

Furthermore, European asset managers utilizing physics informed neural networks for structural diagnostic testing report a 15% drop in infrastructure insurance premiums due to enhanced safety compliance.

By standardizing bridge performance evaluation protocols, international facility operators universally enhance infrastructure resilience tracking while mitigating supply chain vulnerabilities associated with specialized monitoring hardware procurement.

Market Dynamics

Our researchers analyzed the data with 2025 as the base year, along with the key drivers, trends, and challenges. A holistic analysis of drivers will help companies refine their marketing strategies to gain a competitive advantage.

  • The modern engineering landscape heavily prioritizes predictive risk management, driving organizations to adopt sophisticated analytical frameworks across critical assets. Implementing real time bridge structural load monitoring provides a distinct operational advantage, allowing municipal logistics coordinators to analyze dynamic traffic stress continuously rather than relying on inconsistent manual evaluations.
  • This automated approach yields a 45% increase in maintenance scheduling efficiency, freeing up valuable civil engineering resources for higher-priority tasks. Organizations seeking to optimize offshore energy platform safety rapidly deploy wireless acoustic emission tracking systems to capture internal material degradation before catastrophic mechanical failure occurs. By prioritizing continuous telemetry, asset owners avoid significant operational bottlenecks.
  • Furthermore, the strategic integration of fiber optic strain sensing deployment enables highly accurate foundational settlement tracking across extensive geographic distances, improving compliance reporting workflows. By capturing complex vibrational patterns, vibration based structural defect identification methodologies isolate genuine material fatigue from routine environmental noise, significantly reducing field technician alert fatigue.
  • Ultimately, the successful transition toward digital twin integration for infrastructure establishes a unified, centralized diagnostic ecosystem. This holistic transformation ensures that facility managers can proactively balance capital expenditure with long-term asset preservation, cementing data-driven structural oversight as a critical component of resilient modern engineering operations.
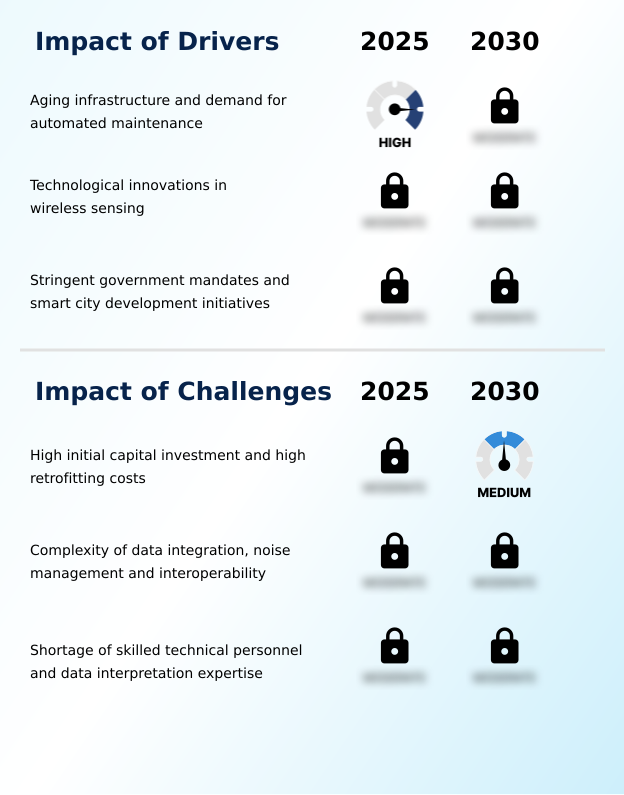
What are the key market drivers leading to the rise in the adoption of Structural Health Monitoring Industry?

  • The accelerating deterioration of mid-twentieth-century civil infrastructure, coupled with the urgent need for automated predictive maintenance frameworks, serves as the primary catalyst propelling market expansion.

  • The deteriorating condition of legacy civil infrastructure urgently compels asset managers to integrate continuous diagnostic hardware. Regulatory mandates enforcing strict seismic early warning readiness necessitate the immediate adoption of verifiable asset preservation strategies.
  • By implementing precision instruments like triaxial accelerometers and distributed acoustic sensing, transportation departments effectively lower catastrophic failure risks, achieving a 30% reduction in emergency repair expenditures.
  • Furthermore, seamlessly integrating digital twin analytics for predictive remaining useful life estimates allows operators to transition away from inefficient physical audits. The strategic deployment of advanced acoustic emission transducers guarantees continuous structural visibility.
  • By leveraging structural resonance mapping to trigger automated foundational settlement alerts and precise thermal expansion diagnostics, infrastructure owners ensure operational frameworks align with stringent municipal safety requirements.

What are the market trends shaping the Structural Health Monitoring Industry?

  • The rapid transition toward autonomous edge computing architectures integrated with artificial intelligence algorithms represents a defining industry shift. This technological evolution enables localized data processing, significantly reducing telemetry latency and accelerating predictive diagnostic capabilities.

  • The technological evolution toward autonomous diagnostics reshapes asset oversight by completely decentralizing complex data processing. Instead of relying on vulnerable legacy servers, modern facility managers deploy multiplexed sensor networks that analyze structural behavior directly at the source. This fundamental transition toward ambient energy harvesting enables autonomous operation without battery replacement, cutting routine maintenance labor hours by 40%.
  • The widespread adoption of vibration measurement algorithms operating on real time sensor streams allows engineers to interpret dynamic structural loading instantly. Utilizing these advanced cloud based telemetry dashboards, asset owners realize a 25% reduction in unanticipated structural downtime. Furthermore, incorporating precise sub surface micro fractures identification ensures that minor material fatigue is isolated before catastrophic failure.
  • Enhanced wireless sensor synchronization significantly improves anomalous data detection accuracy, empowering operators to optimize long-term structural lifecycle management.

What challenges does the Structural Health Monitoring Industry face during its growth?

  • The substantial initial capital investment required for comprehensive hardware deployment, alongside the exorbitant operational costs associated with retrofitting aging physical structures, remains a significant barrier to widespread adoption.

  • The immense technical complexity involved in processing high-frequency telemetry creates substantial operational hurdles for engineering teams relying on non destructive evaluation. Isolating genuine structural defects from background thermal interference requires highly sophisticated environmental noise calibration and complex signal processing filters, which frequently delay deployment timelines. Without precise analytics, field technicians encounter excessive false alarms, decreasing workflow productivity by 18%.
  • Furthermore, the lack of standardized communication protocols across legacy low power wide area networks severely complicates sensor fusion architecture integration, increasing software implementation costs by over 25%. Accurately assessing continuous corrosion impact evaluation alongside dynamic load distribution monitoring demands specialized multidisciplinary expertise that many public agencies lack. Overcoming these learning curves remains critical for maximizing automated diagnostic reporting effectiveness.

Exclusive Technavio Analysis on Customer Landscape

The structural health monitoring market forecasting report includes the adoption lifecycle of the market, covering from the innovator’s stage to the laggard’s stage. It focuses on adoption rates in different regions based on penetration. Furthermore, the structural health monitoring market report also includes key purchase criteria and drivers of price sensitivity to help companies evaluate and develop their market growth analysis strategies.
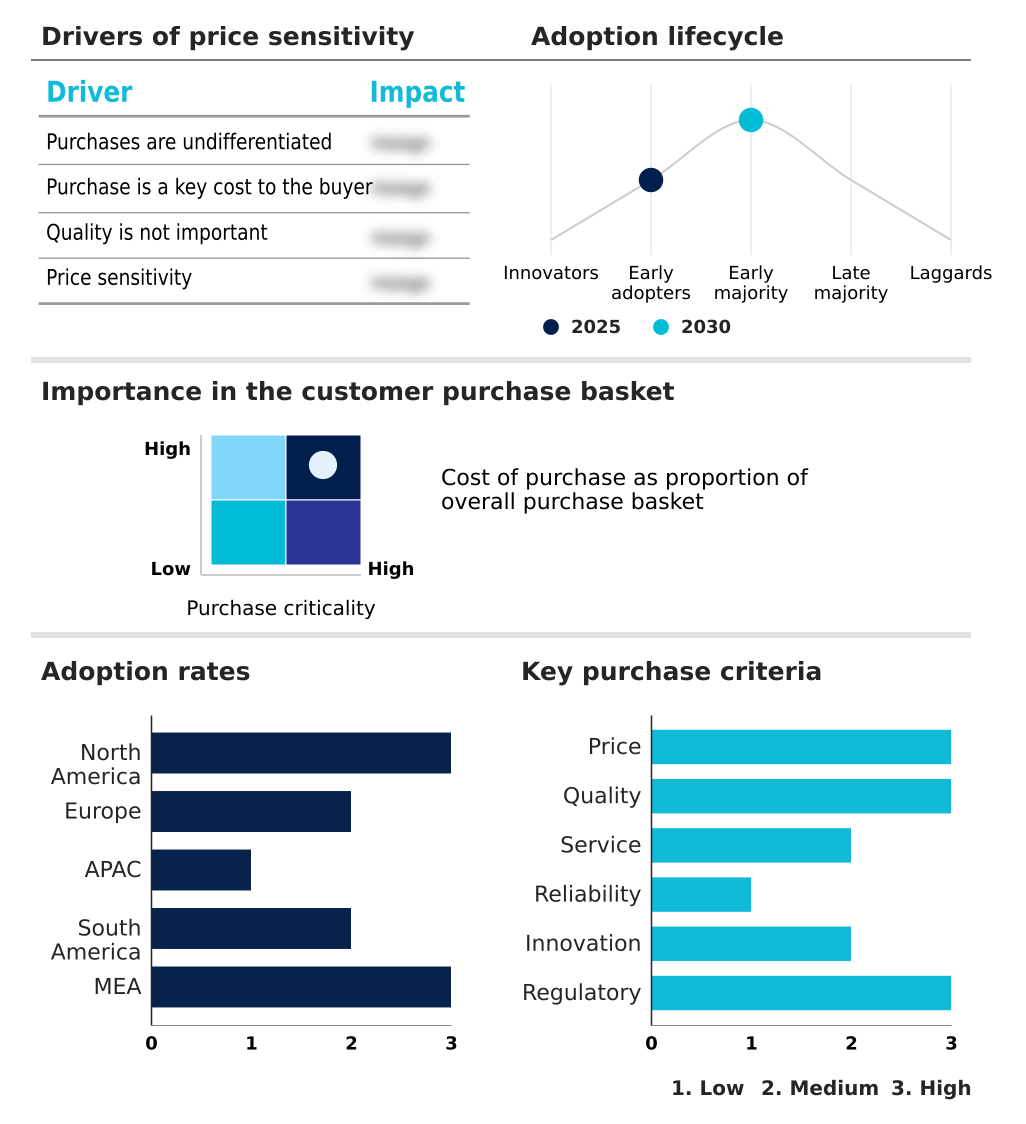
Customer Landscape of Structural Health Monitoring Industry

Competitive Landscape

Companies are implementing various strategies, such as strategic alliances, structural health monitoring market forecast, partnerships, mergers and acquisitions, geographical expansion, and product/service launches, to enhance their presence in the industry.

Acellent Technologies Inc. - The comprehensive portfolio delivers advanced physical sensors, diagnostic data acquisition hardware, and predictive maintenance software platforms specifically engineered for continuous civil infrastructure and aerospace structural monitoring.

The industry research and growth report includes detailed analyses of the competitive landscape of the market and information about key companies, including:

  • Acellent Technologies Inc.
  • Bridge Diagnostics Inc.
  • Campbell Scientific Inc.
  • Digitexx Systems Ltd.
  • Encardio Rite
  • GEOKON LLC
  • GeoSIG Ltd.
  • Hottinger Bruel and Kjaer GmbH
  • Infibra Technologies S.r.l.
  • Kinemetrics Inc.
  • Luna Innovations Inc.
  • OSMOS Group
  • Resensys LLC
  • Sensuron LLC
  • Sisgeo S.r.l.
  • Sixense Group
  • Structural Monitoring Systems
  • Worldsensing S.L.

Qualitative and quantitative analysis of companies has been conducted to help clients understand the wider business environment as well as the strengths and weaknesses of key industry players. Data is qualitatively analyzed to categorize companies as pure play, category-focused, industry-focused, and diversified; it is quantitatively analyzed to categorize companies as dominant, leading, strong, tentative, and weak.

Recent Development and News in Structural health monitoring market

  • In the Construction and Engineering industry, the mandatory integration of digital twin analytics into public municipal transit designs has accelerated proactive asset preservation strategies, directly impacting Structural Health Monitoring demand by requiring automated diagnostic reporting across all new asset portfolios.
  • The widespread shift toward ambient energy harvesting frameworks across smart city developments has eliminated traditional cabling constraints, increasing the adoption of multiplexed sensor networks in Structural Health Monitoring projects by over thirty percent to support efficient predictive maintenance schedules.
  • Strict urban regulatory codes governing seismic early warning readiness have compelled civil contractors to embed triaxial accelerometers during foundational casting, establishing a permanent operational footprint for Structural Health Monitoring installations to trigger immediate foundational settlement alerts in high-density zones.
  • The integration of low power wide area networks into remote civil infrastructure workflows has optimized environmental noise calibration algorithms, driving structural lifecycle management platforms to transition entirely toward continuous dynamic tracking modalities for improved operational safety.

Dive into Technavio’s robust research methodology, blending expert interviews, extensive data synthesis, and validated models for unparalleled Structural Health Monitoring Market insights. See full methodology.

Market Scope
Page number 292
Base year 2025
Historic period 2020-2024
Forecast period 2026-2030
Growth momentum & CAGR Accelerate at a CAGR of 19.2%
Market growth 2026-2030 USD 4508.9 million
Market structure Fragmented
YoY growth 2025-2026(%) 16.7%
Key countries US, Canada, Mexico, Germany, UK, France, Italy, Spain, The Netherlands, China, Japan, South Korea, India, Australia, Singapore, Brazil, Chile, Argentina, Saudi Arabia, UAE, South Africa, Qatar and Israel
Competitive landscape Leading Companies, Market Positioning of Companies, Competitive Strategies, and Industry Risks

Request Free Sample

Research Analyst Overview

  • The transition toward intelligent diagnostic architectures fundamentally redefines physical asset preservation protocols, shifting boardroom strategies from reactive maintenance toward predictive structural modeling. Executive leadership teams increasingly prioritize real time sensor streams to ensure strict regulatory compliance and safeguard multi-decade capital investments.
  • By embedding vibrating wire piezometers and tiltmeters directly into critical infrastructure, operators generate continuous telemetry that informs critical budgeting and resource allocation decisions. The strategic implementation of digital twin analytics allows facility managers to simulate extreme environmental stress events, yielding a 35% improvement in maintenance forecasting accuracy compared to historical calendar-based auditing.
  • This data-driven approach minimizes catastrophic failure risks while optimizing operational continuity. Furthermore, the integration of signal processing filters effectively isolates genuine structural anomalies, preventing costly emergency dispatches triggered by routine thermal expansion.
  • Deploying multiplexed sensor networks across expansive geographic portfolios provides an uninterrupted stream of verifiable structural data, empowering executive stakeholders to confidently align infrastructure management frameworks with rigorous international civil safety mandates and sustainable asset lifecycle optimization goals.

What are the Key Data Covered in this Structural Health Monitoring Market Research and Growth Report?

  • What is the expected growth of the Structural Health Monitoring Market between 2026 and 2030?

    • USD 4.51 billion, at a CAGR of 19.2%

  • What segmentation does the market report cover?

    • The report is segmented by Component (Hardware, Software, and Services), Connectivity (Wired, and Wireless), Application (Civil infrastructure, Aerospace, Energy, Defense, and Others) and Geography (North America, Europe, APAC, South America, Middle East and Africa)

  • Which regions are analyzed in the report?

    • North America, Europe, APAC, South America and Middle East and Africa

  • What are the key growth drivers and market challenges?

    • Aging infrastructure and demand for automated maintenance, High initial capital investment and high retrofitting costs

  • Who are the major players in the Structural Health Monitoring Market?

    • Acellent Technologies Inc., Bridge Diagnostics Inc., Campbell Scientific Inc., Digitexx Systems Ltd., Encardio Rite, GEOKON LLC, GeoSIG Ltd., Hottinger Bruel and Kjaer GmbH, Infibra Technologies S.r.l., Kinemetrics Inc., Luna Innovations Inc., OSMOS Group, Resensys LLC, Sensuron LLC, Sisgeo S.r.l., Sixense Group, Structural Monitoring Systems and Worldsensing S.L.

Market Research Insights

  • The Structural Health Monitoring Market transforms infrastructure risk assessment through advanced digitalization and automated condition based maintenance. By integrating predictive maintenance schedules, facility operators achieve a 40% reduction in unexpected asset downtime compared to traditional reactive methodologies. The utilization of cloud based telemetry dashboards enhances asset preservation strategies by streamlining remote operational oversight.
  • Furthermore, incorporating wireless sensor synchronization allows engineering teams to improve anomalous data detection accuracy by over 25%, drastically minimizing false alarms triggered by thermal fluctuations. These precise diagnostic integrations establish a reliable foundation for structural lifecycle management, empowering decisionmakers to optimize maintenance budgets and maintain strict compliance with civil safety mandates without incurring excessive capital expenditures.

We can help! Our analysts can customize this structural health monitoring market research report to meet your requirements.

Get in touch

1. Executive Summary

1.1 Market overview

Executive Summary - Chart on Market Overview
Executive Summary - Data Table on Market Overview
Executive Summary - Chart on Global Market Characteristics
Executive Summary - Chart on Market by Geography
Executive Summary - Chart on Market Segmentation by Component
Executive Summary - Chart on Market Segmentation by Connectivity
Executive Summary - Chart on Market Segmentation by Application
Executive Summary - Chart on Incremental Growth
Executive Summary - Data Table on Incremental Growth
Executive Summary - Chart on Company Market Positioning

2. Technavio Analysis

2.1 Analysis of price sensitivity, lifecycle, customer purchase basket, adoption rates, and purchase criteria

2.2 Criticality of inputs and Factors of differentiation

Chart on Overview on criticality of inputs and factors of differentiation

2.3 Factors of disruption

Chart on Overview on factors of disruption

2.4 Impact of drivers and challenges

Chart on Impact of drivers and challenges in 2025 and 2030

3. Market Landscape

3.1 Market ecosystem

Chart on Parent Market
Data Table on - Parent Market

3.2 Market characteristics

Chart on Market characteristics analysis

3.3 Value chain analysis

Chart on Value chain analysis

4. Market Sizing

4.1 Market definition

Data Table on Offerings of companies included in the market definition

4.2 Market segment analysis

Market segments

4.3 Market size 2025

4.4 Market outlook: Forecast for 2025-2030

Chart on Global - Market size and forecast 2025-2030 ($ million)
Data Table on Global - Market size and forecast 2025-2030 ($ million)
Chart on Global Market: Year-over-year growth 2025-2030 (%)
Data Table on Global Market: Year-over-year growth 2025-2030 (%)

5. Historic Market Size

5.1 Global Structural Health Monitoring Market 2020 - 2024

Historic Market Size - Data Table on Global Structural Health Monitoring Market 2020 - 2024 ($ million)

5.2 Component segment analysis 2020 - 2024

Historic Market Size - Component Segment 2020 - 2024 ($ million)

5.3 Connectivity segment analysis 2020 - 2024

Historic Market Size - Connectivity Segment 2020 - 2024 ($ million)

5.4 Application segment analysis 2020 - 2024

Historic Market Size - Application Segment 2020 - 2024 ($ million)

5.5 Geography segment analysis 2020 - 2024

Historic Market Size - Geography Segment 2020 - 2024 ($ million)

5.6 Country segment analysis 2020 - 2024

Historic Market Size - Country Segment 2020 - 2024 ($ million)

6. Qualitative Analysis

6.1 Impact of AI in Global Structural Health Monitoring Market

6.2 Impact of Geopolitical Conflicts on Global Structural Health Monitoring Market

7. Five Forces Analysis

7.1 Five forces summary

Five forces analysis - Comparison between 2025 and 2030

7.2 Bargaining power of buyers

Bargaining power of buyers - Impact of key factors 2025 and 2030

7.3 Bargaining power of suppliers

Bargaining power of suppliers - Impact of key factors in 2025 and 2030

7.4 Threat of new entrants

Threat of new entrants - Impact of key factors in 2025 and 2030

7.5 Threat of substitutes

Threat of substitutes - Impact of key factors in 2025 and 2030

7.6 Threat of rivalry

Threat of rivalry - Impact of key factors in 2025 and 2030

7.7 Market condition

Chart on Market condition - Five forces 2025 and 2030

8. Market Segmentation by Component

8.1 Market segments

Chart on Component - Market share 2025-2030 (%)
Data Table on Component - Market share 2025-2030 (%)

8.2 Comparison by Component

Chart on Comparison by Component
Data Table on Comparison by Component

8.3 Hardware - Market size and forecast 2025-2030

Chart on Hardware - Market size and forecast 2025-2030 ($ million)
Data Table on Hardware - Market size and forecast 2025-2030 ($ million)
Chart on Hardware - Year-over-year growth 2025-2030 (%)
Data Table on Hardware - Year-over-year growth 2025-2030 (%)

8.4 Software - Market size and forecast 2025-2030

Chart on Software - Market size and forecast 2025-2030 ($ million)
Data Table on Software - Market size and forecast 2025-2030 ($ million)
Chart on Software - Year-over-year growth 2025-2030 (%)
Data Table on Software - Year-over-year growth 2025-2030 (%)

8.5 Services - Market size and forecast 2025-2030

Chart on Services - Market size and forecast 2025-2030 ($ million)
Data Table on Services - Market size and forecast 2025-2030 ($ million)
Chart on Services - Year-over-year growth 2025-2030 (%)
Data Table on Services - Year-over-year growth 2025-2030 (%)

8.6 Market opportunity by Component

Market opportunity by Component ($ million)
Data Table on Market opportunity by Component ($ million)

9. Market Segmentation by Connectivity

9.1 Market segments

Chart on Connectivity - Market share 2025-2030 (%)
Data Table on Connectivity - Market share 2025-2030 (%)

9.2 Comparison by Connectivity

Chart on Comparison by Connectivity
Data Table on Comparison by Connectivity

9.3 Wired - Market size and forecast 2025-2030

Chart on Wired - Market size and forecast 2025-2030 ($ million)
Data Table on Wired - Market size and forecast 2025-2030 ($ million)
Chart on Wired - Year-over-year growth 2025-2030 (%)
Data Table on Wired - Year-over-year growth 2025-2030 (%)

9.4 Wireless - Market size and forecast 2025-2030

Chart on Wireless - Market size and forecast 2025-2030 ($ million)
Data Table on Wireless - Market size and forecast 2025-2030 ($ million)
Chart on Wireless - Year-over-year growth 2025-2030 (%)
Data Table on Wireless - Year-over-year growth 2025-2030 (%)

9.5 Market opportunity by Connectivity

Market opportunity by Connectivity ($ million)
Data Table on Market opportunity by Connectivity ($ million)

10. Market Segmentation by Application

10.1 Market segments

Chart on Application - Market share 2025-2030 (%)
Data Table on Application - Market share 2025-2030 (%)

10.2 Comparison by Application

Chart on Comparison by Application
Data Table on Comparison by Application

10.3 Civil infrastructure - Market size and forecast 2025-2030

Chart on Civil infrastructure - Market size and forecast 2025-2030 ($ million)
Data Table on Civil infrastructure - Market size and forecast 2025-2030 ($ million)
Chart on Civil infrastructure - Year-over-year growth 2025-2030 (%)
Data Table on Civil infrastructure - Year-over-year growth 2025-2030 (%)

10.4 Aerospace - Market size and forecast 2025-2030

Chart on Aerospace - Market size and forecast 2025-2030 ($ million)
Data Table on Aerospace - Market size and forecast 2025-2030 ($ million)
Chart on Aerospace - Year-over-year growth 2025-2030 (%)
Data Table on Aerospace - Year-over-year growth 2025-2030 (%)

10.5 Energy - Market size and forecast 2025-2030

Chart on Energy - Market size and forecast 2025-2030 ($ million)
Data Table on Energy - Market size and forecast 2025-2030 ($ million)
Chart on Energy - Year-over-year growth 2025-2030 (%)
Data Table on Energy - Year-over-year growth 2025-2030 (%)

10.6 Defense - Market size and forecast 2025-2030

Chart on Defense - Market size and forecast 2025-2030 ($ million)
Data Table on Defense - Market size and forecast 2025-2030 ($ million)
Chart on Defense - Year-over-year growth 2025-2030 (%)
Data Table on Defense - Year-over-year growth 2025-2030 (%)

10.7 Others - Market size and forecast 2025-2030

Chart on Others - Market size and forecast 2025-2030 ($ million)
Data Table on Others - Market size and forecast 2025-2030 ($ million)
Chart on Others - Year-over-year growth 2025-2030 (%)
Data Table on Others - Year-over-year growth 2025-2030 (%)

10.8 Market opportunity by Application

Market opportunity by Application ($ million)
Data Table on Market opportunity by Application ($ million)

11. Customer Landscape

11.1 Customer landscape overview

Analysis of price sensitivity, lifecycle, customer purchase basket, adoption rates, and purchase criteria

12. Geographic Landscape

12.1 Geographic segmentation

Chart on Market share by geography 2025-2030 (%)
Data Table on Market share by geography 2025-2030 (%)

12.2 Geographic comparison

Chart on Geographic comparison
Data Table on Geographic comparison

12.3 North America - Market size and forecast 2025-2030

Chart on North America - Market size and forecast 2025-2030 ($ million)
Data Table on North America - Market size and forecast 2025-2030 ($ million)
Chart on North America - Year-over-year growth 2025-2030 (%)
Data Table on North America - Year-over-year growth 2025-2030 (%)
Chart on Regional Comparison - North America
Data Table on Regional Comparison - North America

12.3.1 US - Market size and forecast 2025-2030

Chart on US - Market size and forecast 2025-2030 ($ million)
Data Table on US - Market size and forecast 2025-2030 ($ million)
Chart on US - Year-over-year growth 2025-2030 (%)
Data Table on US - Year-over-year growth 2025-2030 (%)

12.3.2 Canada - Market size and forecast 2025-2030

Chart on Canada - Market size and forecast 2025-2030 ($ million)
Data Table on Canada - Market size and forecast 2025-2030 ($ million)
Chart on Canada - Year-over-year growth 2025-2030 (%)
Data Table on Canada - Year-over-year growth 2025-2030 (%)

12.3.3 Mexico - Market size and forecast 2025-2030

Chart on Mexico - Market size and forecast 2025-2030 ($ million)
Data Table on Mexico - Market size and forecast 2025-2030 ($ million)
Chart on Mexico - Year-over-year growth 2025-2030 (%)
Data Table on Mexico - Year-over-year growth 2025-2030 (%)

12.4 Europe - Market size and forecast 2025-2030

Chart on Europe - Market size and forecast 2025-2030 ($ million)
Data Table on Europe - Market size and forecast 2025-2030 ($ million)
Chart on Europe - Year-over-year growth 2025-2030 (%)
Data Table on Europe - Year-over-year growth 2025-2030 (%)
Chart on Regional Comparison - Europe
Data Table on Regional Comparison - Europe

12.4.1 Germany - Market size and forecast 2025-2030

Chart on Germany - Market size and forecast 2025-2030 ($ million)
Data Table on Germany - Market size and forecast 2025-2030 ($ million)
Chart on Germany - Year-over-year growth 2025-2030 (%)
Data Table on Germany - Year-over-year growth 2025-2030 (%)

12.4.2 UK - Market size and forecast 2025-2030

Chart on UK - Market size and forecast 2025-2030 ($ million)
Data Table on UK - Market size and forecast 2025-2030 ($ million)
Chart on UK - Year-over-year growth 2025-2030 (%)
Data Table on UK - Year-over-year growth 2025-2030 (%)

12.4.3 France - Market size and forecast 2025-2030

Chart on France - Market size and forecast 2025-2030 ($ million)
Data Table on France - Market size and forecast 2025-2030 ($ million)
Chart on France - Year-over-year growth 2025-2030 (%)
Data Table on France - Year-over-year growth 2025-2030 (%)

12.4.4 Italy - Market size and forecast 2025-2030

Chart on Italy - Market size and forecast 2025-2030 ($ million)
Data Table on Italy - Market size and forecast 2025-2030 ($ million)
Chart on Italy - Year-over-year growth 2025-2030 (%)
Data Table on Italy - Year-over-year growth 2025-2030 (%)

12.4.5 Spain - Market size and forecast 2025-2030

Chart on Spain - Market size and forecast 2025-2030 ($ million)
Data Table on Spain - Market size and forecast 2025-2030 ($ million)
Chart on Spain - Year-over-year growth 2025-2030 (%)
Data Table on Spain - Year-over-year growth 2025-2030 (%)

12.4.6 The Netherlands - Market size and forecast 2025-2030

Chart on The Netherlands - Market size and forecast 2025-2030 ($ million)
Data Table on The Netherlands - Market size and forecast 2025-2030 ($ million)
Chart on The Netherlands - Year-over-year growth 2025-2030 (%)
Data Table on The Netherlands - Year-over-year growth 2025-2030 (%)

12.5 APAC - Market size and forecast 2025-2030

Chart on APAC - Market size and forecast 2025-2030 ($ million)
Data Table on APAC - Market size and forecast 2025-2030 ($ million)
Chart on APAC - Year-over-year growth 2025-2030 (%)
Data Table on APAC - Year-over-year growth 2025-2030 (%)
Chart on Regional Comparison - APAC
Data Table on Regional Comparison - APAC

12.5.1 China - Market size and forecast 2025-2030

Chart on China - Market size and forecast 2025-2030 ($ million)
Data Table on China - Market size and forecast 2025-2030 ($ million)
Chart on China - Year-over-year growth 2025-2030 (%)
Data Table on China - Year-over-year growth 2025-2030 (%)

12.5.2 Japan - Market size and forecast 2025-2030

Chart on Japan - Market size and forecast 2025-2030 ($ million)
Data Table on Japan - Market size and forecast 2025-2030 ($ million)
Chart on Japan - Year-over-year growth 2025-2030 (%)
Data Table on Japan - Year-over-year growth 2025-2030 (%)

12.5.3 South Korea - Market size and forecast 2025-2030

Chart on South Korea - Market size and forecast 2025-2030 ($ million)
Data Table on South Korea - Market size and forecast 2025-2030 ($ million)
Chart on South Korea - Year-over-year growth 2025-2030 (%)
Data Table on South Korea - Year-over-year growth 2025-2030 (%)

12.5.4 India - Market size and forecast 2025-2030

Chart on India - Market size and forecast 2025-2030 ($ million)
Data Table on India - Market size and forecast 2025-2030 ($ million)
Chart on India - Year-over-year growth 2025-2030 (%)
Data Table on India - Year-over-year growth 2025-2030 (%)

12.5.5 Australia - Market size and forecast 2025-2030

Chart on Australia - Market size and forecast 2025-2030 ($ million)
Data Table on Australia - Market size and forecast 2025-2030 ($ million)
Chart on Australia - Year-over-year growth 2025-2030 (%)
Data Table on Australia - Year-over-year growth 2025-2030 (%)

12.5.6 Singapore - Market size and forecast 2025-2030

Chart on Singapore - Market size and forecast 2025-2030 ($ million)
Data Table on Singapore - Market size and forecast 2025-2030 ($ million)
Chart on Singapore - Year-over-year growth 2025-2030 (%)
Data Table on Singapore - Year-over-year growth 2025-2030 (%)

12.6 South America - Market size and forecast 2025-2030

Chart on South America - Market size and forecast 2025-2030 ($ million)
Data Table on South America - Market size and forecast 2025-2030 ($ million)
Chart on South America - Year-over-year growth 2025-2030 (%)
Data Table on South America - Year-over-year growth 2025-2030 (%)
Chart on Regional Comparison - South America
Data Table on Regional Comparison - South America

12.6.1 Brazil - Market size and forecast 2025-2030

Chart on Brazil - Market size and forecast 2025-2030 ($ million)
Data Table on Brazil - Market size and forecast 2025-2030 ($ million)
Chart on Brazil - Year-over-year growth 2025-2030 (%)
Data Table on Brazil - Year-over-year growth 2025-2030 (%)

12.6.2 Chile - Market size and forecast 2025-2030

Chart on Chile - Market size and forecast 2025-2030 ($ million)
Data Table on Chile - Market size and forecast 2025-2030 ($ million)
Chart on Chile - Year-over-year growth 2025-2030 (%)
Data Table on Chile - Year-over-year growth 2025-2030 (%)

12.6.3 Argentina - Market size and forecast 2025-2030

Chart on Argentina - Market size and forecast 2025-2030 ($ million)
Data Table on Argentina - Market size and forecast 2025-2030 ($ million)
Chart on Argentina - Year-over-year growth 2025-2030 (%)
Data Table on Argentina - Year-over-year growth 2025-2030 (%)

12.7 Middle East and Africa - Market size and forecast 2025-2030

Chart on Middle East and Africa - Market size and forecast 2025-2030 ($ million)
Data Table on Middle East and Africa - Market size and forecast 2025-2030 ($ million)
Chart on Middle East and Africa - Year-over-year growth 2025-2030 (%)
Data Table on Middle East and Africa - Year-over-year growth 2025-2030 (%)
Chart on Regional Comparison - Middle East and Africa
Data Table on Regional Comparison - Middle East and Africa

12.7.1 Saudi Arabia - Market size and forecast 2025-2030

Chart on Saudi Arabia - Market size and forecast 2025-2030 ($ million)
Data Table on Saudi Arabia - Market size and forecast 2025-2030 ($ million)
Chart on Saudi Arabia - Year-over-year growth 2025-2030 (%)
Data Table on Saudi Arabia - Year-over-year growth 2025-2030 (%)

12.7.2 UAE - Market size and forecast 2025-2030

Chart on UAE - Market size and forecast 2025-2030 ($ million)
Data Table on UAE - Market size and forecast 2025-2030 ($ million)
Chart on UAE - Year-over-year growth 2025-2030 (%)
Data Table on UAE - Year-over-year growth 2025-2030 (%)

12.7.3 South Africa - Market size and forecast 2025-2030

Chart on South Africa - Market size and forecast 2025-2030 ($ million)
Data Table on South Africa - Market size and forecast 2025-2030 ($ million)
Chart on South Africa - Year-over-year growth 2025-2030 (%)
Data Table on South Africa - Year-over-year growth 2025-2030 (%)

12.7.4 Qatar - Market size and forecast 2025-2030

Chart on Qatar - Market size and forecast 2025-2030 ($ million)
Data Table on Qatar - Market size and forecast 2025-2030 ($ million)
Chart on Qatar - Year-over-year growth 2025-2030 (%)
Data Table on Qatar - Year-over-year growth 2025-2030 (%)

12.7.5 Israel - Market size and forecast 2025-2030

Chart on Israel - Market size and forecast 2025-2030 ($ million)
Data Table on Israel - Market size and forecast 2025-2030 ($ million)
Chart on Israel - Year-over-year growth 2025-2030 (%)
Data Table on Israel - Year-over-year growth 2025-2030 (%)

12.8 Market opportunity by geography

Market opportunity by geography ($ million)
Data Tables on Market opportunity by geography ($ million)

13. Drivers, Challenges, and Opportunity

13.1 Market drivers

Aging infrastructure and demand for automated maintenance
Technological innovations in wireless sensing
Stringent government mandates and smart city development initiatives

13.2 Market challenges

High initial capital investment and high retrofitting costs
Complexity of data integration, noise management and interoperability
Shortage of skilled technical personnel and data interpretation expertise

13.3 Impact of drivers and challenges

Impact of drivers and challenges in 2025 and 2030

13.4 Market opportunities

Shift toward autonomous edge computing and AI-driven predictive diagnostics
Rapid adoption of low-power wireless sensor networks and energy harvesting
Integration of real-time IoT telemetry with digital twin and BIM ecosystems

14. Competitive Landscape

14.1 Overview

14.2

Overview on criticality of inputs and factors of differentiation

14.3 Landscape disruption

Overview on factors of disruption

14.4 Industry risks

Impact of key risks on business

15. Competitive Analysis

15.1 Companies profiled

Companies covered

15.2 Company ranking index

15.3 Market positioning of companies

Matrix on companies position and classification

15.4 Acellent Technologies Inc.

Acellent Technologies Inc. - Overview
Acellent Technologies Inc. - Product / Service
Acellent Technologies Inc. - Key offerings
SWOT

15.5 Bridge Diagnostics Inc.

Bridge Diagnostics Inc. - Overview
Bridge Diagnostics Inc. - Product / Service
Bridge Diagnostics Inc. - Key offerings
SWOT

15.6 Campbell Scientific Inc.

Campbell Scientific Inc. - Overview
Campbell Scientific Inc. - Product / Service
Campbell Scientific Inc. - Key offerings
SWOT

15.7 Digitexx Systems Ltd.

Digitexx Systems Ltd. - Overview
Digitexx Systems Ltd. - Product / Service
Digitexx Systems Ltd. - Key offerings
SWOT

15.8 Encardio Rite

Encardio Rite - Overview
Encardio Rite - Product / Service
Encardio Rite - Key offerings
SWOT

15.9 GEOKON LLC

GEOKON LLC - Overview
GEOKON LLC - Product / Service
GEOKON LLC - Key offerings
SWOT

15.10 GeoSIG Ltd.

GeoSIG Ltd. - Overview
GeoSIG Ltd. - Product / Service
GeoSIG Ltd. - Key offerings
SWOT

15.11 Hottinger Bruel and Kjaer GmbH

Hottinger Bruel and Kjaer GmbH - Overview
Hottinger Bruel and Kjaer GmbH - Product / Service
Hottinger Bruel and Kjaer GmbH - Key offerings
SWOT

15.12 Infibra Technologies S.r.l.

Infibra Technologies S.r.l. - Overview
Infibra Technologies S.r.l. - Product / Service
Infibra Technologies S.r.l. - Key offerings
SWOT

15.13 Kinemetrics Inc.

Kinemetrics Inc. - Overview
Kinemetrics Inc. - Product / Service
Kinemetrics Inc. - Key offerings
SWOT

15.14 Luna Innovations Inc.

Luna Innovations Inc. - Overview
Luna Innovations Inc. - Product / Service
Luna Innovations Inc. - Key offerings
SWOT

15.15 Sisgeo S.r.l.

Sisgeo S.r.l. - Overview
Sisgeo S.r.l. - Product / Service
Sisgeo S.r.l. - Key offerings
SWOT

15.16 Sixense Group

Sixense Group - Overview
Sixense Group - Product / Service
Sixense Group - Key offerings
SWOT

15.17 Structural Monitoring Systems

Structural Monitoring Systems - Overview
Structural Monitoring Systems - Product / Service
Structural Monitoring Systems - Key offerings
SWOT

15.18 Worldsensing S.L.

Worldsensing S.L. - Overview
Worldsensing S.L. - Product / Service
Worldsensing S.L. - Key offerings
SWOT

16. Appendix

16.1 Scope of the report

Market definition
Objectives
Notes and caveats

16.2 Inclusions and exclusions checklist

Inclusions checklist
Exclusions checklist

16.3 Currency conversion rates for US$

16.4 Research methodology

16.5 Data procurement

Information sources

16.6 Data validation

16.7 Validation techniques employed for market sizing

16.8 Data synthesis

16.9 360 degree market analysis

16.10 List of abbreviations

Research Methodology

Technavio presents a detailed picture of the market by way of study, synthesis, and summation of data from multiple sources. The analysts have presented the various facets of the market with a particular focus on identifying the key industry influencers. The data thus presented is comprehensive, reliable, and the result of extensive research, both primary and secondary.

INFORMATION SOURCES

Primary sources

  • Manufacturers and suppliers
  • Channel partners
  • Industry experts
  • Strategic decision makers

Secondary sources

  • Industry journals and periodicals
  • Government data
  • Financial reports of key industry players
  • Historical data
  • Press releases

DATA ANALYSIS

Data Synthesis

  • Collation of data
  • Estimation of key figures
  • Analysis of derived insights

Data Validation

  • Triangulation with data models
  • Reference against proprietary databases
  • Corroboration with industry experts

REPORT WRITING

Qualitative

  • Market drivers
  • Market challenges
  • Market trends
  • Five forces analysis

Quantitative

  • Market size and forecast
  • Market segmentation
  • Geographical insights
  • Competitive landscape

Interested in this report?

Get your sample now to see our research methodology and insights!

Download Now

Frequently Asked Questions

Structural Health Monitoring market growth will increase by USD 4508.9 million during 2026-2030.

The Structural Health Monitoring market is expected to grow at a CAGR of 19.2% during 2026-2030.

Structural Health Monitoring market is segmented by Component (Hardware, Software, Services) Connectivity (Wired, Wireless) Application (Civil infrastructure, Aerospace, Energy, Defense, Others)

Acellent Technologies Inc., Bridge Diagnostics Inc., Campbell Scientific Inc., Digitexx Systems Ltd., Encardio Rite, GEOKON LLC, GeoSIG Ltd., Hottinger Bruel and Kjaer GmbH, Infibra Technologies S.r.l., Kinemetrics Inc., Luna Innovations Inc., OSMOS Group, Resensys LLC, Sensuron LLC, Sisgeo S.r.l., Sixense Group, Structural Monitoring Systems, Worldsensing S.L. are a few of the key vendors in the Structural Health Monitoring market.

North America will register the highest growth rate of 36.7% among the other regions. Therefore, the Structural Health Monitoring market in North America is expected to garner significant business opportunities for the vendors during the forecast period.

US, Canada, Mexico, Germany, UK, France, Italy, Spain, The Netherlands, China, Japan, South Korea, India, Australia, Singapore, Brazil, Chile, Argentina, Saudi Arabia, UAE, South Africa, Qatar, Israel

  • Aging infrastructure and demand for automated maintenance is the driving factor this market.

The Structural Health Monitoring market vendors should focus on grabbing business opportunities from the Component segment as it accounted for the largest market share in the base year.
RIA - Research AI Assistant
Ask RIA
