
Musculoskeletal Drugs Market Size 2024-2028
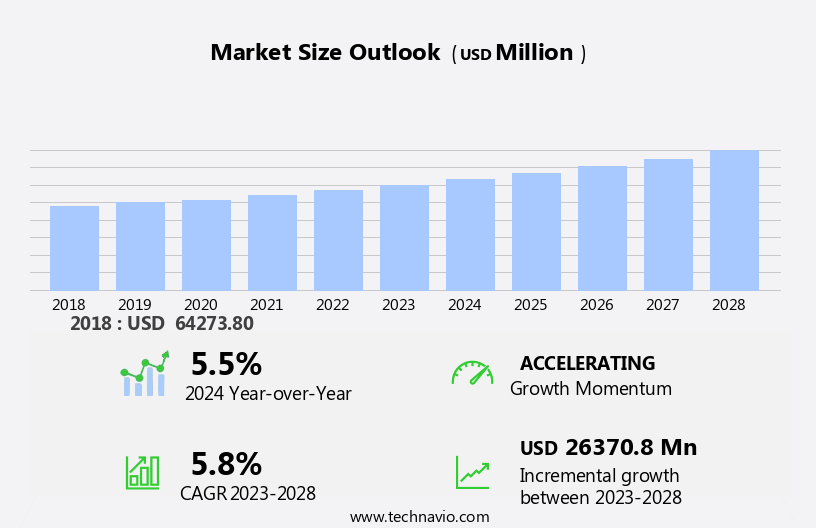
The musculoskeletal drugs market size is forecast to increase by USD 26.37 billion at a CAGR of 5.8% between 2023 and 2028.
- The market is experiencing significant growth due to several key factors. One of the primary drivers is the increasing geriatric population, as older adults are more susceptible to musculoskeletal disorders (MSDs). Another trend influencing market growth is the adoption of artificial intelligence (AI) and machine learning (ML) technologies for diagnosing MSDs, enabling early intervention and improved patient outcomes. However, high treatment costs associated with MSDs remain a challenge, necessitating the development of cost-effective treatment options and payment models. These factors, among others, are shaping the growth trajectory of the market.
What will be the Size of the Musculoskeletal Drugs Market During the Forecast Period?
- The market is experiencing significant growth due to the rising prevalence of muscle-related symptoms, including spasticity, spasms, and musculoskeletal pain. Prescription medications, such as antispastics, antispasmodics, skeletal muscle relaxants, and smooth muscle relaxants, are in high demand to manage these conditions. The market is driven by increasing healthcare expenditures, an aging population, and a growing awareness of the importance of self-care.
- Moreover, over-the-counter (OTC) options, like acetaminophen, also contribute to the market's growth. Companies are focusing on developing innovative solutions to address unmet needs, such as improved patient compliance and access to translated information. Additionally, financial support, helplines, and community initiatives, including home recipes, newsletters, and webinars, are essential resources for patients and caregivers. Organizations like MHA Kids and Workwise provide valuable resources, while bequests and donations support research and development efforts.
How is this Musculoskeletal Drugs Industry segmented and which is the largest segment?
The musculoskeletal drugs industry research report provides comprehensive data (region-wise segment analysis), with forecasts and estimates in "USD billion" for the period 2024-2028, as well as historical data from 2018-2022 for the following segments.
- Drug Class
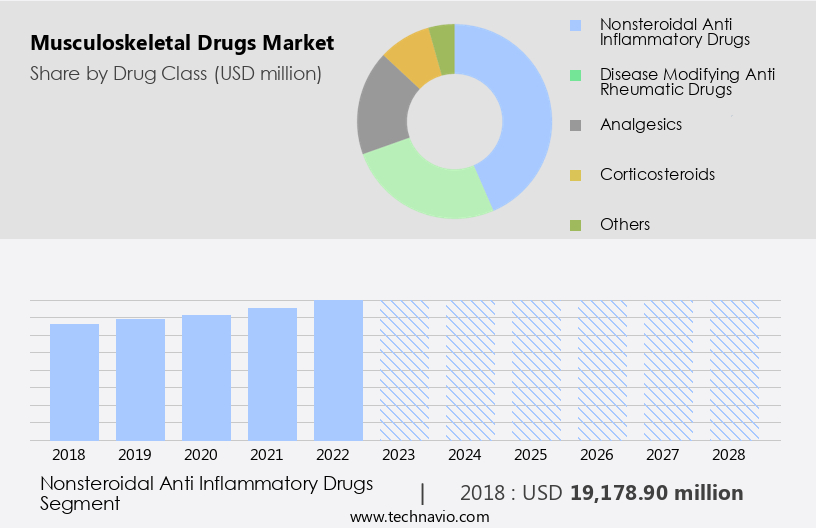
- Nonsteroidal anti inflammatory drugs
- Disease modifying anti rheumatic drugs
- Analgesics
- Corticosteroids
- Others
- Distribution Channel
- Hospital pharmacy
- Retail pharmacy
- Online pharmacy
- Geography
- North America
- Canada
- US
- Europe
- Germany
- UK
- France
- Asia
- China
- India
- Japan
- Rest of World (ROW)
- North America
By Drug Class Insights
- The nonsteroidal anti inflammatory drugs segment is estimated to witness significant growth during the forecast period.
Non-steroidal anti-inflammatory drugs (NSAIDs) are essential in managing musculoskeletal conditions by inhibiting prostaglandin production, which mediates pain and inflammation. NSAIDs are widely used for treating various musculoskeletal disorders, including joint inflammation, muscle disorders, and autoimmune-mediated and connective tissue disorders. These conditions affect individuals with cerebral palsy, multiple sclerosis, aging populations, and others. NSAIDs come in various forms, such as over-the-counter and prescription medications, catering to diverse patient needs. Common NSAIDs include ibuprofen, naproxen, diclofenac, and celecoxib, each with distinct dosing regimens and durations of action. Healthcare providers utilize these options to customize treatment plans based on individual patient requirements.
Get a glance at the Musculoskeletal Drugs Industry report of share of various segments Request Free Sample
The nonsteroidal anti inflammatory drugs segment was valued at USD 19.18 billion in 2018 and showed a gradual increase during the forecast period.
Regional Analysis
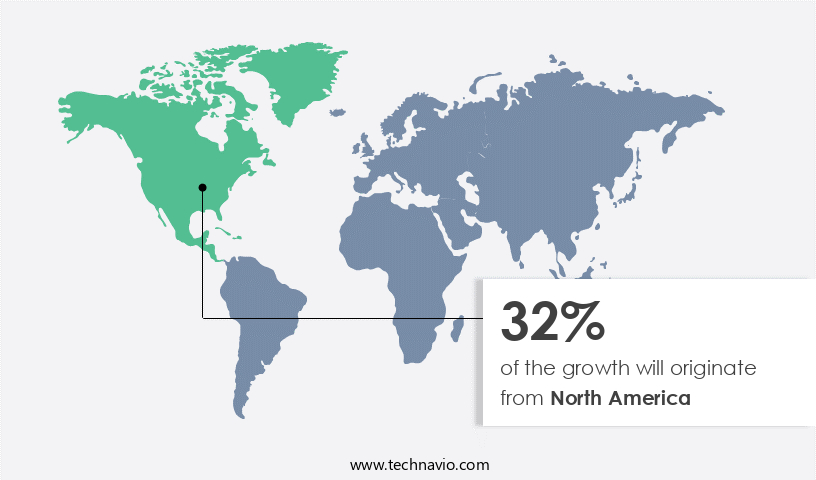
- North America is estimated to contribute 32% to the growth of the global market during the forecast period.
Technavio's analysts have elaborately explained the regional trends and drivers that shape the market during the forecast period.
For more insights on the market share of various regions, Request Free Sample
The North American region holds a substantial share In the market due to the high prevalence of musculoskeletal disorders (MSDs) and considerable healthcare expenditures. According to the Bureau of Labor Statistics (BLS), there were 976,090 cases of MSDs reported In the private sector In the US in 2021, leading to 502,380 days-away-from-work (DAFW) cases. In Canada, there were 10,211 lost-time injuries caused by MSDs in 2022, marking a 2.5% increase from the previous year. The increasing obesity rate and aging population in North America further contribute to the rising incidence of MSDs. In 2023, every US state and territory reported an obesity prevalence above 20%, with the Midwest region having the highest rate of 36%.nThese statistics underscore the significant impact of MSDs on productivity, health, and overall quality of life. The market in North America is expected to grow due to the increasing awareness and demand for effective treatments to manage MSDs.
Market Dynamics
Our musculoskeletal drugs market researchers analyzed the data with 2023 as the base year, along with the key drivers, trends, and challenges. A holistic analysis of drivers will help companies refine their marketing strategies to gain a competitive advantage.
What are the key market drivers leading to the rise In the adoption of Musculoskeletal Drugs Industry?
Increasing geriatric population is the key driver of the market.
- The market is experiencing significant growth due to the increasing prevalence of muscle-related symptoms and joint disorders among the aging population. According to the National Institute of Aging, approximately 54.4 million Americans are aged 65 and above, and this number is projected to reach 95 million by 2060. This demographic shift is driving the demand for prescription medications such as antispasmodics, antispasticity agents, skeletal muscle relaxants, and smooth muscle relaxants. These drugs are used to manage symptoms of spasticity, spasms, anxiety, seizures, and chronic pain associated with conditions like cerebral palsy, multiple sclerosis, rheumatoid arthritis, osteoarthritis, and steroid-induced myopathies.
- Additionally, the market is witnessing an increase in demand for over-the-counter (OTC) pain relievers like acetaminophen, paracetamol, and non-steroidal anti-inflammatory drugs (NSAIDs) for the management of musculoskeletal pain. The market is also witnessing an increasing trend towards holistic management of musculoskeletal disorders, which includes pharmacological management in pain clinics and alternative therapies like capsaicin and inflammation-reducing agents that inhibit prostaglandin synthesis. Financial support from organizations like MHA Kids, bequests, and donations are also contributing to the growth of the market.
What are the market trends shaping the Musculoskeletal Drugs Industry?
Adoption of AI and ML for diagnosing musculoskeletal conditions is the upcoming market trend.
- The market is experiencing significant growth due to the increasing prevalence of muscle-related symptoms and joint disorders. According to the Centers for Disease Control and Prevention (CDC), approximately 22.2% of adults In the US have doctor-diagnosed arthritis, and around 54.4 million people live with some form of arthritis or chronic joint pain. This presents a substantial market opportunity for prescription medications such as antispastics, antispasmodics, skeletal muscle relaxants, and smooth muscle relaxants. Moreover, the market is witnessing an increase in demand for over-the-counter (OTC) drugs like acetaminophen, Carisoprodol, Chlorzoxazone, Cyclobenzaprine, Metaxalone, Methocarbamol, Orphenadrine, Baclofen, Dantrolene, Tizanidine, Diazepam, and others for managing musculoskeletal pain.
- Moreover, factors such as aging, autoimmune-mediated conditions, connective tissue disorders, multimorbidity presentations, and chronic pain are driving the demand for these drugs. The healthcare community is also embracing holistic management approaches, including pharmacological management, for treating musculoskeletal conditions. Pain clinics and healthcare providers are increasingly adopting these treatments to improve patient outcomes. Additionally, there is a growing trend towards the use of alternative therapies like capsaicin and inflammation modulators that inhibit prostaglandin synthesis. Financial support, community webinars, and translated information are essential resources for individual patients seeking information and support for managing their musculoskeletal conditions. Organizations such as MHA Kids and various foundations offer resources, bequests, and donation opportunities for patients and their families.
What challenges does the Musculoskeletal Drugs Industry face during its growth?
High treatment costs associated with MSDs is a key challenge affecting the industry growth.
- The market is marked by substantial expenses due to the prevalence and treatment of various musculoskeletal conditions. These conditions, which include arthritis, joint pain, osteoporosis, spine conditions, injuries, and other musculoskeletal disorders, account for a significant portion of healthcare expenditure globally.
- Furthermore, one of the primary drivers of these high treatment costs is the extensive use of healthcare services across various specialties. This includes prescription medications such as antispasmodics, antispastics, skeletal muscle relaxants, smooth muscle relaxants, and analgesics like acetaminophen, carisoprodol, chlorzoxazone, cyclobenzaprine, metaxalone, methocarbamol, orphenadrine, baclofen, dantrolene, tizanidine, diazepam, and others. These medications are often used to manage muscle-related symptoms such as spasticity, spasms, anxiety, seizures, and chronic pain associated with conditions like cerebral palsy, multiple sclerosis, rheumatoid arthritis, osteoarthritis, and steroid-induced myopathies. Individuals with multimorbidity presentations, aging populations, and autoimmune-mediated and connective tissue disorders also contribute to the high costs of treating musculoskeletal conditions.
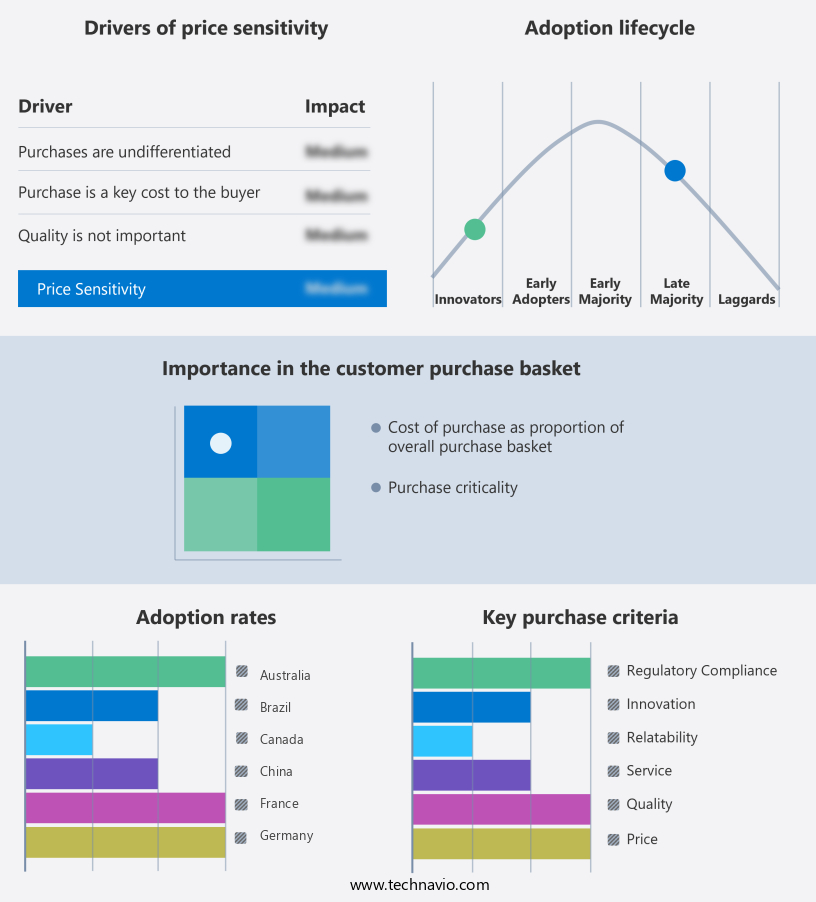
Exclusive Customer Landscape
The musculoskeletal drugs market forecasting report includes the adoption lifecycle of the market, covering from the innovator's stage to the laggard's stage. It focuses on adoption rates in different regions based on penetration. Furthermore, the musculoskeletal drugs market report also includes key purchase criteria and drivers of price sensitivity to help companies evaluate and develop their market growth analysis strategies.
Customer Landscape
Key Companies & Market Insights
Companies are implementing various strategies, such as strategic alliances, musculoskeletal drugs market forecast, partnerships, mergers and acquisitions, geographical expansion, and product/service launches, to enhance their presence In the industry.
The industry research and growth report includes detailed analyses of the competitive landscape of the market and information about key companies, including:
- AbbVie Inc.
- Amgen Inc.
- Anika Therapeutics Inc.
- Astellas Pharma Inc.
- Bioventus LLC
- Bristol Myers Squibb Co.
- Eli Lilly and Co.
- F. Hoffmann La Roche Ltd.
- Gilde Healthcare
- Gilead Sciences Inc.
- GlaxoSmithKline Plc
- Johnson and Johnson Services Inc.
- Kangstem Biotech Co Ltd.
- Novartis AG
- Oryn Therapeutics
- Pfizer Inc.
- Sanofi SA
- Sorrento Therapeutics Inc.
- UCB SA
- Zimmer Biomet Holdings Inc.
Qualitative and quantitative analysis of companies has been conducted to help clients understand the wider business environment as well as the strengths and weaknesses of key industry players. Data is qualitatively analyzed to categorize companies as pure play, category-focused, industry-focused, and diversified; it is quantitatively analyzed to categorize companies as dominant, leading, strong, tentative, and weak.
Research Analyst Overview
The musculoskeletal system is a complex network of bones, muscles, ligaments, and other soft tissues that enable movement and support the body. Musculoskeletal disorders encompass a wide range of conditions, including muscle-related symptoms, joint disorders, and connective tissue disorders. These conditions can significantly impact an individual's quality of life and productivity. Musculoskeletal drugs play a crucial role in managing various symptoms associated with these disorders. These medications can be broadly classified into two categories: antispasmodics/anticholinergics and skeletal muscle relaxants. Antispasmodics/anticholinergics are primarily used to manage conditions characterized by muscle spasms and spasticity, such as cerebral palsy and multiple sclerosis.
In addition, skeletal muscle relaxants, on the other hand, are used to alleviate muscle pain and discomfort caused by various conditions, including strains, sprains, and chronic pain. The market for musculoskeletal drugs is driven by several factors. The aging population is a significant contributor, as the prevalence of musculoskeletal disorders increases with age. Autoimmune-mediated conditions, such as rheumatoid arthritis and osteoarthritis, also contribute to the demand for these drugs. Moreover, the growing awareness of chronic pain management and the increasing prevalence of multimorbidity presentations are expected to fuel market growth. The market for musculoskeletal drugs is diverse and complex, with various players offering a range of products.
Furthermore, antispasmodics/anticholinergics include drugs like baclofen, dantrolene, tizanidine, and diazepam. Skeletal muscle relaxants include carisoprodol, chlorzoxazone, cyclobenzaprine, metaxalone, methocarbamol, orphenadrine, and others. Some drugs, such as paracetamol and capsaicin, are available over-the-counter (OTC), while others require a prescription. The use of opioids for pain management is a contentious issue, with concerns regarding addiction and dependence. Alternative pain management strategies, such as holistic management and pain clinics, are gaining popularity. Non-pharmacological interventions, such as physical therapy and lifestyle modifications, are also being explored to manage musculoskeletal disorders. The market for musculoskeletal drugs is subject to various regulations and guidelines. These regulations aim to ensure the safety and efficacy of these medications while balancing the need for patient access.
In addition, the development of new drugs and delivery systems continues to drive innovation in the market. Therefore, the market for musculoskeletal drugs is dynamic and complex, driven by various factors, including demographic trends, disease prevalence, and regulatory developments. Understanding the market dynamics and trends is essential for stakeholders, including healthcare providers, patients, and industry players, to make informed decisions and optimize patient care.
|
Musculoskeletal Drugs Market Scope |
|
|
Report Coverage |
Details |
|
Page number |
210 |
|
Base year |
2023 |
|
Historic period |
2018-2022 |
|
Forecast period |
2024-2028 |
|
Growth momentum & CAGR |
Accelerate at a CAGR of 5.8% |
|
Market growth 2024-2028 |
USD 26.37 billion |
|
Market structure |
Fragmented |
|
YoY growth 2023-2024(%) |
5.5 |
|
Key countries |
US, China, Germany, Japan, UK, India, France, Brazil, Canada, and Australia |
|
Competitive landscape |
Leading Companies, Market Positioning of Companies, Competitive Strategies, and Industry Risks |
What are the Key Data Covered in this Musculoskeletal Drugs Market Research and Growth Report?
- CAGR of the Musculoskeletal Drugs industry during the forecast period
- Detailed information on factors that will drive the Musculoskeletal Drugs growth and forecasting between 2024 and 2028
- Precise estimation of the size of the market and its contribution of the industry in focus to the parent market
- Accurate predictions about upcoming growth and trends and changes in consumer behaviour
- Growth of the market across North America, Europe, Asia, and Rest of World (ROW)
- Thorough analysis of the market's competitive landscape and detailed information about companies
- Comprehensive analysis of factors that will challenge the musculoskeletal drugs market growth of industry companies
We can help! Our analysts can customize this musculoskeletal drugs market research report to meet your requirements.
 RIA -
RIA - 
