
Private Equity Market Size 2026-2030
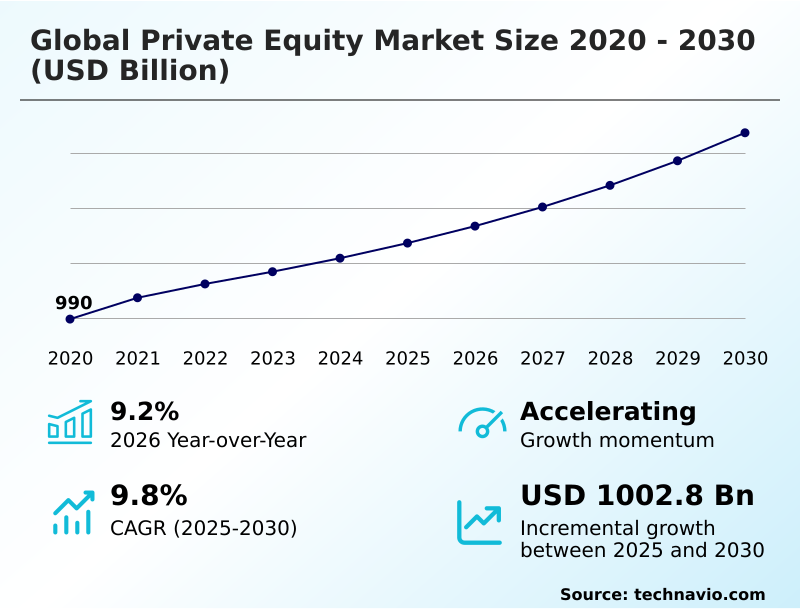
The private equity market size is valued to increase by USD 1002.8 billion, at a CAGR of 9.8% from 2025 to 2030. Expansion of secondary market liquidity will drive the private equity market.
Major Market Trends & Insights
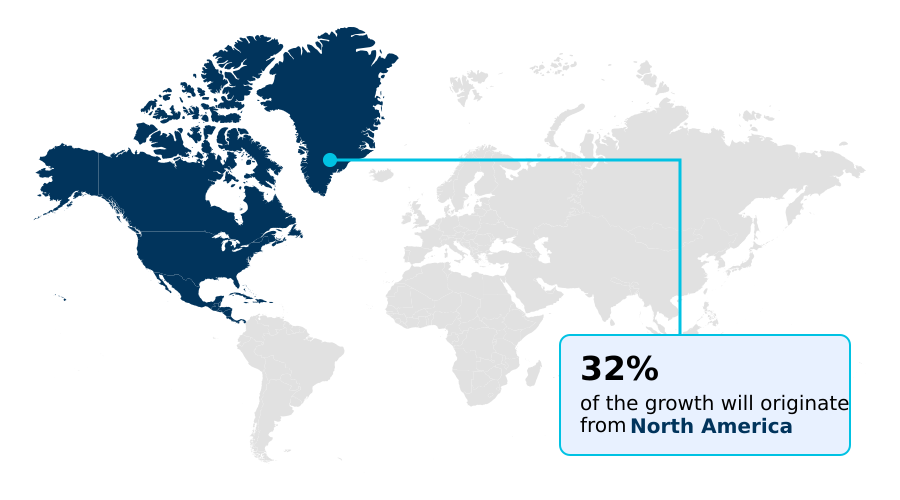
- North America dominated the market and accounted for a 31.9% growth during the forecast period.
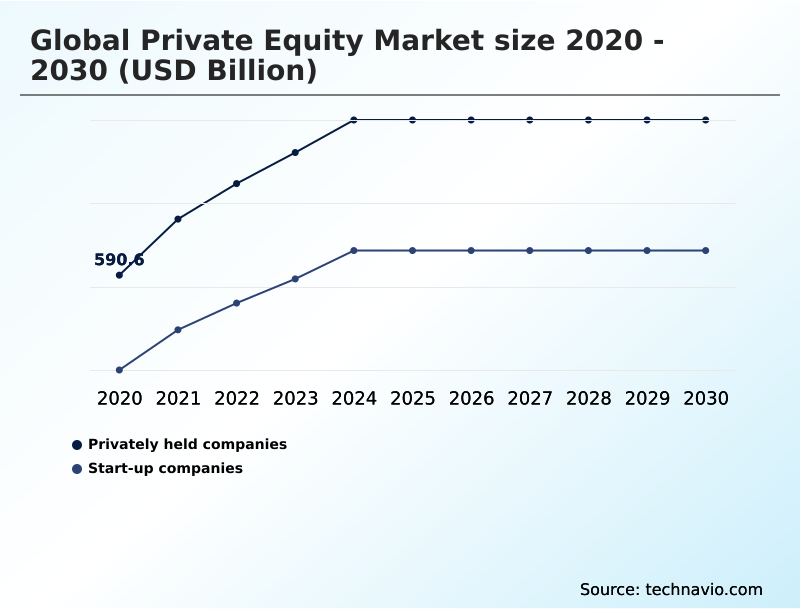
- By End-user - Privately held companies segment was valued at USD 903.4 billion in 2024
- By Application - Leveraged buyouts segment accounted for the largest market revenue share in 2024
Market Size & Forecast
- Market Opportunities: USD 1693.8 billion
- Market Future Opportunities: USD 1002.8 billion
- CAGR from 2025 to 2030 : 9.8%
Market Summary
- The private equity market operates as a critical component of the alternative investment industry, deploying capital into private companies to foster growth and transformation. This landscape encompasses various strategies, including leveraged buyouts, venture capital, and growth equity, funded by capital from institutional investors and high-net-worth individuals acting as limited partners.
- General partners manage these funds, executing a cycle of identifying, acquiring, and improving businesses to generate significant capital gains. A key focus is on operational improvement and strategic value creation to enhance portfolio company performance before pursuing exit strategies.
- The industry is evolving with the integration of advanced data analytics for deal sourcing and due diligence, moving toward more quantitative methods. This technological shift, combined with a focus on specialized sectors like technology and healthcare, is changing how firms conduct capital allocation and manage risk.
- The development of robust secondary markets and private credit solutions further provides liquidity and flexible financing options, underscoring the market's dynamic and sophisticated nature in driving corporate efficiency and economic change.
What will be the Size of the Private Equity Market during the forecast period?
Get Key Insights on Market Forecast (PDF) Get Free Sample
How is the Private Equity Market Segmented?
The private equity industry research report provides comprehensive data (region-wise segment analysis), with forecasts and estimates in "USD billion" for the period 2026-2030, as well as historical data from 2020-2024 for the following segments.
- End-user
- Privately held companies
- Start-up companies
- Application
- Leveraged buyouts
- Venture capital
- Equity investment
- Enterpreneurship
- Sector
- IT and telecommunications
- Healthcare
- BFSI
- Consumer and retail
- Others
- Geography
- North America
- US
- Canada
- Mexico
- Europe
- Germany
- UK
- France
- APAC
- China
- Japan
- India
- Middle East and Africa
- Saudi Arabia
- UAE
- South Africa
- South America
- Brazil
- Argentina
- Rest of World (ROW)
- North America
By End-user Insights
The privately held companies segment is estimated to witness significant growth during the forecast period.
The privately held companies segment is foundational to the private equity market, where capital supports businesses not listed on public exchanges.
Investment is driven by the need for professional management and capital infusion in founder-led organizations, facilitating the institutionalization of business processes and governance.
Firms provide strategic guidance, global networks, and operational expertise to accelerate expansion, often through a roll-up strategy or bolt-on acquisition strategy. This partnership enables access to capital for major projects while avoiding the costs and scrutiny of public markets.
Key activities include digital transformation in portfolio companies and ensuring regulatory compliance for private equity.
Advanced investor relations management and the use of direct lending and asset-backed securities are common, with data showing that a targeted approach can improve supply chain efficiency by over 20%.
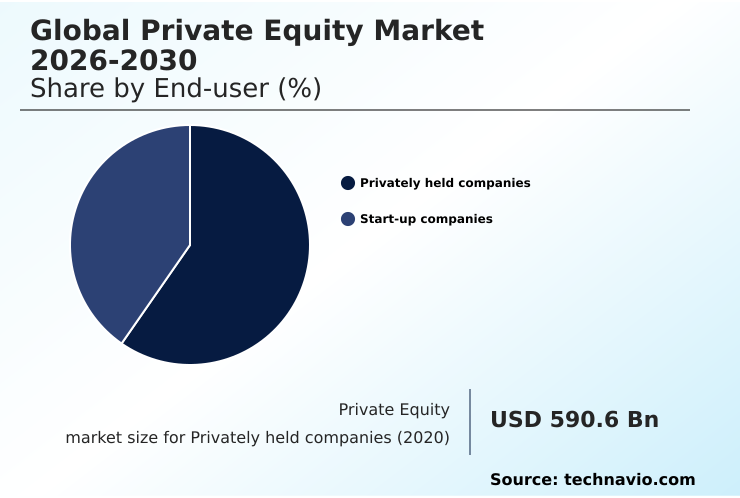
The Privately held companies segment was valued at USD 903.4 billion in 2024 and showed a gradual increase during the forecast period.
Regional Analysis
North America is estimated to contribute 31.9% to the growth of the global market during the forecast period.Technavio’s analysts have elaborately explained the regional trends and drivers that shape the market during the forecast period.
See How Private Equity Market Demand is Rising in North America Get Free Sample
The global private equity market exhibits distinct regional dynamics, with North America leading in incremental growth contribution at 31.9%, driven by its mature ecosystem and deep capital pools.
The region is a hub for large-scale take-private transactions and sophisticated capital structure optimization. Meanwhile, the APAC region is projected to experience the fastest growth, fueled by digital transformation and an expanding middle class.
In Europe, a strong emphasis on sustainability influences investment strategies. Across all regions, firms utilize strategies like add-on acquisitions and bolt-on acquisitions to achieve a higher multiple on invested capital.
Successful exits, whether through an initial public offering exit or a trade sale exit, depend on effective post-acquisition integration and navigating the fundraising cycle to ensure timely capital calls and distributions.
Market Dynamics
Our researchers analyzed the data with 2025 as the base year, along with the key drivers, trends, and challenges. A holistic analysis of drivers will help companies refine their marketing strategies to gain a competitive advantage.
- The global private equity market is navigating a complex macroeconomic environment where the impact of interest rates on leveraged buyouts is a primary consideration, reshaping debt structures and return expectations. In response, firms are accelerating the adoption of advanced technologies, with the role of AI in private equity deal sourcing becoming a key competitive differentiator.
- Analytical platforms can now screen potential targets more than five times faster than traditional methods, allowing teams to focus on strategic assessments. This technological shift is particularly crucial in high-growth sectors, where sophisticated valuation methods for technology growth equity are required to accurately price assets.
- Concurrently, there is a growing emphasis on non-financial metrics, and establishing clear ESG criteria for infrastructure private equity is now standard practice for attracting institutional capital. Amid these changes, alternative financing solutions are gaining prominence, with private credit strategies for middle-market companies offering flexible capital structures that are less dependent on volatile public debt markets.
- This multi-faceted evolution underscores a strategic pivot towards operational precision, technological leverage, and responsible investing to drive value.
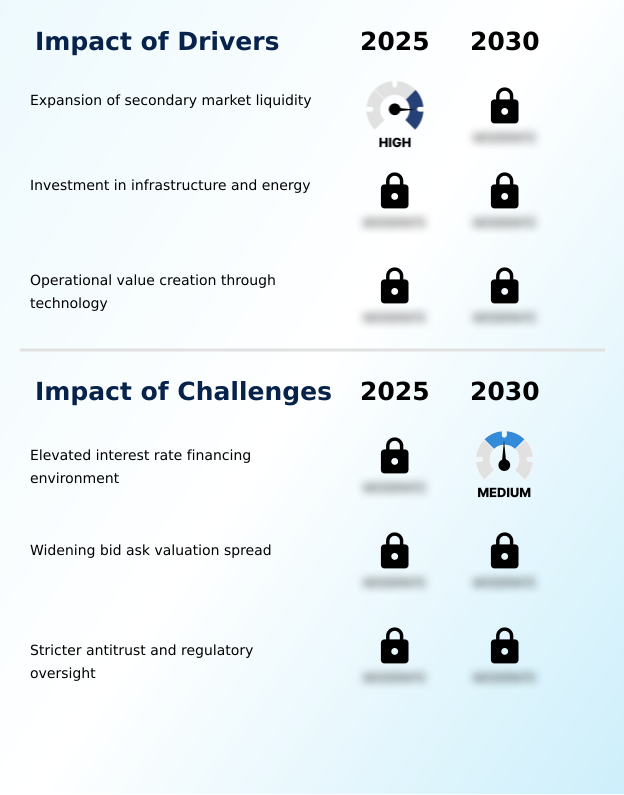
What are the key market drivers leading to the rise in the adoption of Private Equity Industry?
- The expansion of secondary market liquidity is a fundamental driver supporting the private equity ecosystem by enhancing capital recycling and investor flexibility.
- The expansion of the secondary market provides critical liquidity, a key driver propelling the private equity market. This allows limited partners and general partners to manage portfolio management and capital allocation more effectively.
- The rise of GP-led secondaries, supported by a strong thematic investing approach, enables firms to retain high-performing assets in new fund structures, optimizing long-term returns.
- This mechanism reduces perceived investment risk, encouraging more capital commitments and increasing the available dry powder. The institutionalization of this segment, where dedicated funds are ready for co-investment, has improved market stability during volatile periods by over 25%.
- This robust ecosystem supports diverse strategies, including technology buyout fund activities, healthcare private equity deals, and investments in infrastructure investment fund vehicles, by ensuring efficient capital recycling.
What are the market trends shaping the Private Equity Industry?
- The private equity market is increasingly leveraging advanced data analytics and proprietary technology platforms for deal sourcing. This approach enables a more precise and systematic method for identifying investment opportunities.
- The market is increasingly defined by the use of advanced data science to guide investment decisions, from initial deal sourcing to final exit strategies. This trend allows firms to move beyond traditional networking toward a more quantitative private equity investment thesis, enhancing the precision of due diligence for leveraged buyouts and venture capital.
- Automated tools can assess a target's financial health with greater speed, reducing initial screening time by over 40% and allowing teams to focus on the most promising leads. An effective operational value creation plan is then developed using data-driven insights post-acquisition.
- This approach improves private equity fund performance metrics and helps shape LP portfolio construction, especially within a focused middle-market buyout strategy, ensuring capital is deployed with greater accuracy and foresight in a competitive landscape.
What challenges does the Private Equity Industry face during its growth?
- An elevated interest rate financing environment presents a significant challenge, fundamentally altering the cost of capital and affecting leveraged transaction structures.
- An elevated interest rate environment presents a significant market challenge, increasing the cost of debt for transactions and placing pressure on the financial models that underpin alternative investment strategies. This directly impacts the ability to generate a target internal rate of return, as higher financing expenses reduce the free cash flow available for value creation and operational improvement.
- In this climate, firms are more selective, focusing on businesses with resilient cash flows. The higher cost of capital, which has in some cases doubled debt servicing expenses, has also intensified competition in special situations investing and for assets in real estate private equity.
- This environment tests fund lifecycle management, as assumptions regarding management fees, carried interest, and the hurdle rate face greater scrutiny. Consequently, the volume of sponsor-to-sponsor transactions has moderated as firms re-evaluate valuations and risk.
Exclusive Technavio Analysis on Customer Landscape
The private equity market forecasting report includes the adoption lifecycle of the market, covering from the innovator’s stage to the laggard’s stage. It focuses on adoption rates in different regions based on penetration. Furthermore, the private equity market report also includes key purchase criteria and drivers of price sensitivity to help companies evaluate and develop their market growth analysis strategies.
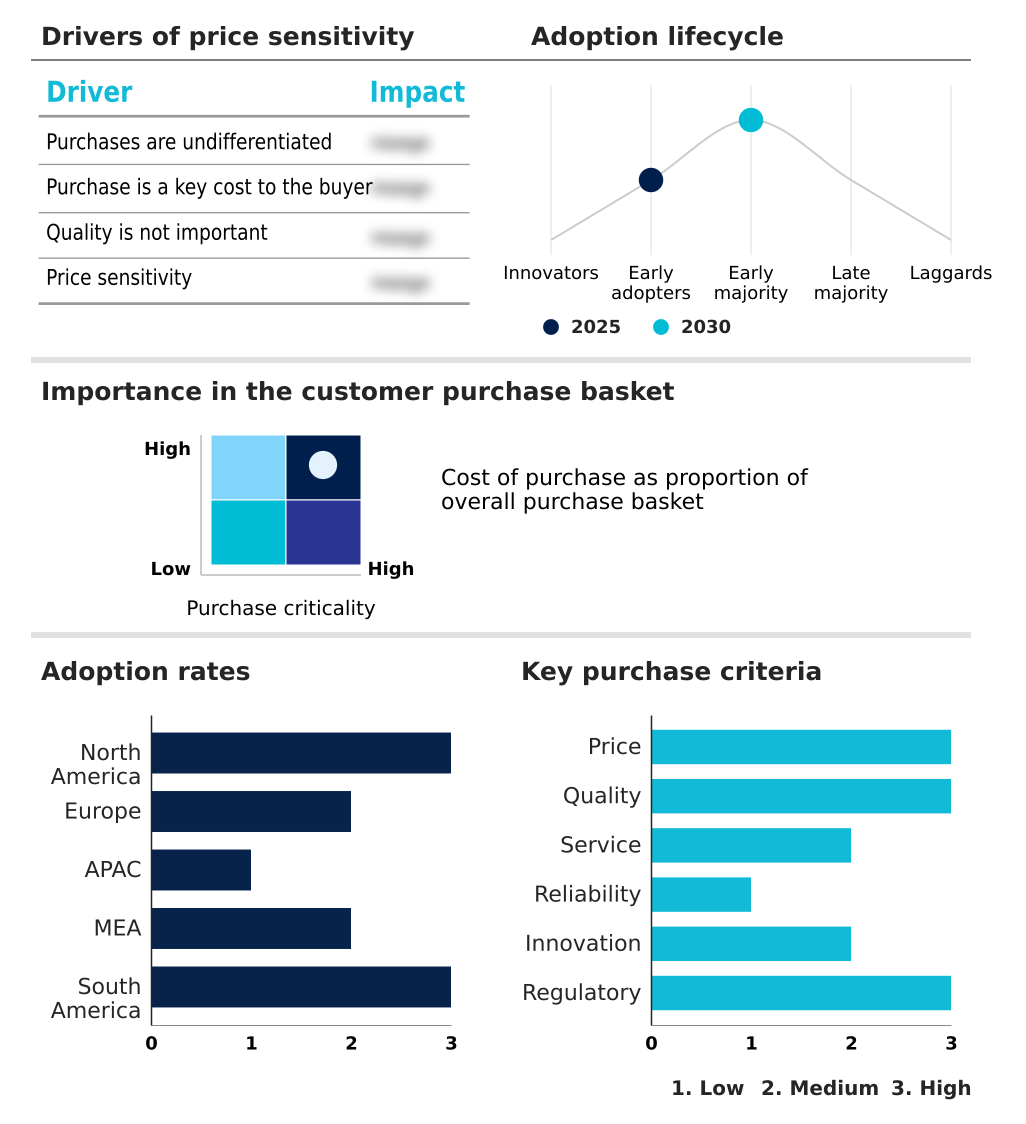
Customer Landscape of Private Equity Industry
Competitive Landscape
Companies are implementing various strategies, such as strategic alliances, private equity market forecast, partnerships, mergers and acquisitions, geographical expansion, and product/service launches, to enhance their presence in the industry.
Advent International Corp. - Specialized private equity offerings focus on buyouts, strategic restructuring, and value-added growth capital across multiple sectors.
The industry research and growth report includes detailed analyses of the competitive landscape of the market and information about key companies, including:
- Advent International Corp.
- Apollo Asset Management Inc.
- Bain Capital LP
- Blackstone Inc
- Brookfield Business Partners LP
- Clearlake Capital Group L.P.
- Francisco Partners Management
- General Atlantic Service Co L.P
- H.I.G. Capital LLC
- Hellman and Friedman LLC
- HgCapital LLP
- KKR and Co. Inc.
- LGT Wealth India Pvt Ltd
- Nordic Capital
- Permira Advisers LLP
- Silver Lake
- The Carlyle Group Inc.
- Thoma Bravo LP
- Vista Equity Partners Management
- Warburg Pincus LLC
Qualitative and quantitative analysis of companies has been conducted to help clients understand the wider business environment as well as the strengths and weaknesses of key industry players. Data is qualitatively analyzed to categorize companies as pure play, category-focused, industry-focused, and diversified; it is quantitatively analyzed to categorize companies as dominant, leading, strong, tentative, and weak.
Recent Development and News in Private equity market
- In August 2024, Bain Capital LP initiated a new strategy targeting middle-market investments within Europe to capitalize on regional growth opportunities.
- In September 2024, Warburg Pincus LLC successfully closed a significant growth equity fund dedicated to investing in the financial services and technology sectors.
- In November 2024, Thoma Bravo LP executed a take-private acquisition of a cybersecurity company, reinforcing its strategic focus on the enterprise software market.
- In January 2025, Hellman and Friedman LLC concluded a major investment in the information services industry, expanding its portfolio in data-centric businesses.
Dive into Technavio’s robust research methodology, blending expert interviews, extensive data synthesis, and validated models for unparalleled Private Equity Market insights. See full methodology.
| Market Scope | |
|---|---|
| Page number | 297 |
| Base year | 2025 |
| Historic period | 2020-2024 |
| Forecast period | 2026-2030 |
| Growth momentum & CAGR | Accelerate at a CAGR of 9.8% |
| Market growth 2026-2030 | USD 1002.8 billion |
| Market structure | Fragmented |
| YoY growth 2025-2026(%) | 9.2% |
| Key countries | US, Canada, Mexico, Germany, UK, France, Italy, Spain, The Netherlands, China, Japan, India, South Korea, Australia, Indonesia, Saudi Arabia, UAE, South Africa, Israel, Turkey, Brazil, Argentina and Chile |
| Competitive landscape | Leading Companies, Market Positioning of Companies, Competitive Strategies, and Industry Risks |
Research Analyst Overview
- The private equity market operates through sophisticated financial engineering and strategic management, where general partners leverage a diverse toolkit to maximize returns. This includes executing complex take-private transactions, spin-offs, and carve-outs, while managing fund structures with mechanisms like subscription lines and capital calls for efficient capital allocation.
- The deployment of dry powder into add-on acquisitions and bolt-on acquisitions is a primary method for portfolio management and growth. A key boardroom-level focus is the shift towards data-driven deal sourcing and due diligence, which directly impacts investment decisions. Firms that have integrated advanced analytics for monitoring portfolio companies report a 30% improvement in identifying assets requiring operational improvement.
- Strategies extend from venture capital and growth equity to distressed debt investing and private credit, with exit strategies planned meticulously to optimize the internal rate of return and multiple on invested capital through methods like continuation funds and other secondary transactions.
What are the Key Data Covered in this Private Equity Market Research and Growth Report?
-
What is the expected growth of the Private Equity Market between 2026 and 2030?
-
USD 1002.8 billion, at a CAGR of 9.8%
-
-
What segmentation does the market report cover?
-
The report is segmented by End-user (Privately held companies, and Start-up companies), Application (Leveraged buyouts, Venture capital, Equity investment, and Enterpreneurship), Sector (IT and telecommunications, Healthcare, BFSI, Consumer and retail, and Others) and Geography (North America, Europe, APAC, Middle East and Africa, South America)
-
-
Which regions are analyzed in the report?
-
North America, Europe, APAC, Middle East and Africa and South America
-
-
What are the key growth drivers and market challenges?
-
Expansion of secondary market liquidity, Elevated interest rate financing environment
-
-
Who are the major players in the Private Equity Market?
-
Advent International Corp., Apollo Asset Management Inc., Bain Capital LP, Blackstone Inc, Brookfield Business Partners LP, Clearlake Capital Group L.P., Francisco Partners Management, General Atlantic Service Co L.P, H.I.G. Capital LLC, Hellman and Friedman LLC, HgCapital LLP, KKR and Co. Inc., LGT Wealth India Pvt Ltd, Nordic Capital, Permira Advisers LLP, Silver Lake, The Carlyle Group Inc., Thoma Bravo LP, Vista Equity Partners Management and Warburg Pincus LLC
-
Market Research Insights
- The market is defined by evolving strategic approaches, where a clear thematic investing approach and robust ESG integration in private equity are becoming critical differentiators. Firms adopting these principles report up to 15% better alignment in LP portfolio construction. A focused middle-market buyout strategy consistently outperforms broader approaches, in some cases yielding returns that are 5% to 10% higher.
- The landscape is also seeing a surge in specialized funds, including technology buyout fund and infrastructure investment fund vehicles, which target specific corporate carve-out opportunities. This specialization allows for deeper operational engagement and more effective capital deployment. In addition, navigating complex healthcare private equity deals requires sector-specific expertise to unlock value, highlighting the importance of focused investment theses.
We can help! Our analysts can customize this private equity market research report to meet your requirements.
 RIA -
RIA - 
