Nachos Market Analysis, Size, and Forecast 2024-2028: North America (US, Canada, and Mexico), Europe (France, Germany, Italy, and UK), Middle East and Africa (Egypt, KSA, Oman, and UAE), APAC (China, India, and Japan), South America (Argentina and Brazil), and Rest of World (ROW)

Nachos Market Analysis, Size, and Forecast 2024-2028:
North America (US, Canada, and Mexico), Europe (France, Germany, Italy, and UK), Middle East and Africa (Egypt, KSA, Oman, and UAE), APAC (China, India, and Japan), South America (Argentina and Brazil), and Rest of World (ROW)

Published: Jun 2024 170 Pages SKU: IRTNTR71462

Market Overview at a Glance

$1.78 B
Market Opportunity
5.63%
CAGR
5.25
YoY growth 2023-2024(%)

Nachos Market Size 2024-2028

The nachos market size is forecast to increase by USD 1.78 billion, at a CAGR of 5.63% between 2023 and 2028.

  • The market is experiencing significant growth, driven primarily by the expanding organized retail sector and the increasing popularity of online shopping. The organized retail sector's growth is fueled by factors such as convenience, affordability, and the wide variety of offerings. This trend is expected to continue as consumers increasingly seek out convenient and efficient shopping experiences. Another key trend in the market is the growing prominence of online shopping. For those who prefer a meaty twist, ground beef or shredded chicken can be added. With the increasing availability of high-speed internet and the convenience of shopping from home, consumers are increasingly turning to online platforms to purchase nachos and related products.
  • However, companies operating in this market face challenges, including the need to adhere to stringent regulations and guidelines. Compliance with food safety regulations and labeling requirements is crucial to maintain consumer trust and avoid potential legal issues. Companies must navigate these challenges effectively to capitalize on the market's growth potential and meet the evolving demands of consumers.

What will be the Size of the Nachos Market during the forecast period?

Nachos Market Size

Explore in-depth regional segment analysis with market size data - historical 2018-2022 and forecasts 2024-2028 - in the full report.  
Request Free Sample

The market continues to evolve, with dynamic market dynamics shaping its landscape. Cheese sauce viscosity and tortilla chip texture are crucial factors influencing consumer preferences, leading to ongoing research and development in ingredient functionality and processing techniques. Flavor profile optimization and seasoning blend formulation are essential for product differentiation and consumer satisfaction. Cost-effective production and oil absorption control are key considerations for manufacturers, with automated dispensing systems and production process efficiency playing a significant role. Quality control procedures, including automated quality checks and sensory evaluation methods, ensure consistency and maintain product integrity. Ingredient interactions and sodium content reduction are areas of focus for health-conscious consumers, driving innovation in ingredient sourcing strategies and flavor stability testing.

Waste reduction initiatives, such as colorimetric analysis and packaging design optimization, are essential for sustainability and cost savings. Machining process parameters, thermal processing methods, and ingredient cost analysis are crucial elements of the supply chain, with supply chain traceability ensuring transparency and trust. Crispness preservation techniques and microbial contamination control are essential for maintaining product quality and safety. The market's continuous dynamism is reflected in the ongoing research and development efforts across various sectors. From ingredient functionality to consumer segmentation, manufacturers and suppliers are constantly seeking innovative solutions to meet evolving market demands.

How is this Nachos Industry segmented?

The nachos industry research report provides comprehensive data (region-wise segment analysis), with forecasts and estimates in "USD million" for the period 2024-2028, as well as historical data from 2018-2022 for the following segments.

  • Product
    • Baked
    • Fried
  • Application
    • Commercial
    • Household
  • Distribution Channel
    • Supermarkets & Hypermarkets
    • Convenience Stores
    • Online Retail
    • Foodservice
  • Flavor Profile
    • Cheese
    • Spicy
    • Savory
    • Sweet
  • Consumer Preference
    • Gluten-Free
    • Organic
    • Low-Sodium
    • Vegan
  • Geography
    • North America
      • US
      • Canada
      • Mexico
    • Europe
      • France
      • Germany
      • Italy
      • UK
    • Middle East and Africa
      • Egypt
      • KSA
      • Oman
      • UAE
    • APAC
      • China
      • India
      • Japan
    • South America
      • Argentina
      • Brazil
    • Rest of World (ROW)

By Product Insights

The baked segment is estimated to witness significant growth during the forecast period.

The market is experiencing significant growth and innovation, driven by various factors. Texture analysis techniques play a crucial role in ensuring the optimal crispness of tortilla chips and the desired viscosity of cheese sauce. Cost-effective production methods are being adopted to reduce manufacturing costs, while sodium content reduction and oil absorption control are key considerations for health-conscious consumers. Automated dispensing systems and quality checks streamline the production process, enhancing efficiency and consistency. Consumer segmentation and marketing campaign development cater to diverse preferences, with product differentiation strategies based on flavor profiles and ingredient functionality. Supply chain traceability and ingredient sourcing strategies ensure transparency and sustainability.

Crispness preservation techniques and machining process parameters are essential to maintain product quality, while flavor stability testing and sensory evaluation methods cater to evolving consumer tastes. Waste reduction initiatives and colorimetric analysis are integral to maintaining cost competitiveness and ensuring product integrity. Seasoning blend formulation and corn processing techniques contribute to unique product offerings, while thermal processing methods ensure food safety and shelf life. Ingredient interactions and ingredient cost analysis are critical factors in product development, with a focus on optimizing fat content and packaging material selection. Microbial contamination control and packaging design optimization further enhance product quality and consumer appeal.

Nachos Market Size

Request Free Sample

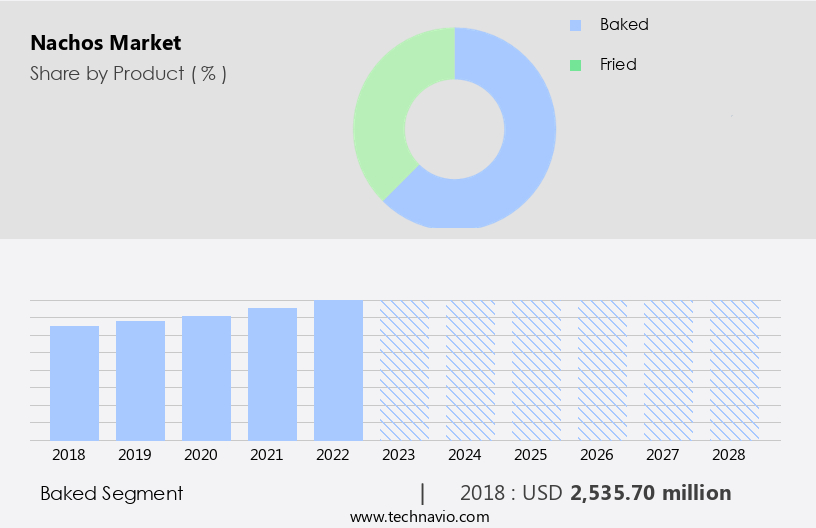
The Baked segment was valued at USD 2.54 billion in 2018 and showed a gradual increase during the forecast period.

Regional Analysis

North America is estimated to contribute 41% to the growth of the global market during the forecast period.Technavio's analysts have elaborately explained the regional trends and drivers that shape the market during the forecast period.

Nachos Market Share by Geography

 Request Free Sample

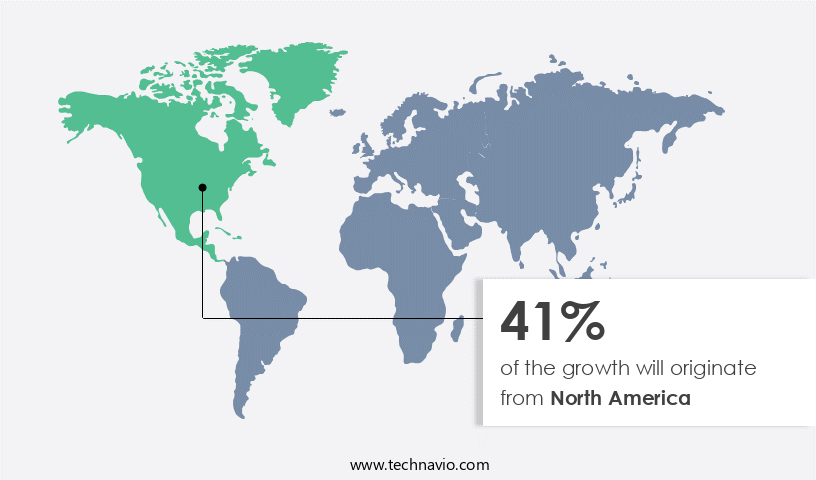
The market in North America is experiencing significant growth due to the rising popularity of Mexican cuisine and the increasing number of millennial consumers. Busy lifestyles have led to a preference for convenient, on-the-go eating options, making snack foods, including nachos, increasingly popular. Cost-effective production methods and automated systems, such as dispensing and quality checks, have improved production process efficiency. Sodium content reduction and oil absorption control techniques cater to health-conscious consumers. Ingredient interactions and formulation optimization ensure product differentiation.

Consumer segmentation and marketing campaigns target specific demographics, while supply chain traceability and ingredient sourcing strategies prioritize quality and sustainability. Crispness preservation techniques and flavor profile optimization enhance consumer experience. Thermal processing methods maintain product consistency, and packaging design optimization ensures product longevity. Waste reduction initiatives and ingredient cost analysis contribute to overall profitability. The market's evolution reflects the industry's commitment to innovation, efficiency, and consumer satisfaction.

Market Dynamics

The Global nachos market is experiencing significant nachos market growth, driven by its appeal as a versatile snack food and appetizer (restaurants). The core product, tortilla chips, serves as the foundation for countless variations, including popular baked tortilla chips and decadent loaded nachos. A key to their widespread appeal is the iconic melted cheese. This market sees strong home consumption, but also thrives within the restaurant (foodservice) sector, fulfilling the demand for convenience food and leveraging the enduring Mexican cuisine popularity. Analyzing the Global nachos market size and prevailing nachos market trends reveals a shift towards healthier nacho options and innovative plant-based nacho toppings. The expansion of e-commerce nachos facilitates access, while continuous new product development focuses on creating gourmet nachos and enabling customizable nachos experiences for diverse palates.

Our researchers analyzed the data with 2023 as the base year, along with the key drivers, trends, and challenges. A holistic analysis of drivers will help companies refine their marketing strategies to gain a competitive advantage.

What are the key market drivers leading to the rise in the adoption of Nachos Industry?

  • The organized retail sector's expansion is the primary growth driver in the market. 
  • Packaged nachos are a popular snack item in offline distribution channels, primarily sold through hypermarkets and supermarkets. Organized retailing plays a significant role in the distribution of these products, providing consumers with a convenient shopping experience and a wide selection of options. Major retailers, such as Tesco Plc, Walmart Inc., Target Brands Inc., and ALDI Inc., dominate this market due to their extensive reach and diverse product offerings. The growth of this sector is driven by the increasing number of organized retailers that allocate shelf space for both branded and private-label packaged nachos. Texture analysis techniques are crucial in the production process to ensure consistent product quality.
  • Cost-effective production methods and sodium content reduction are key focus areas for manufacturers to cater to health-conscious consumers. Oil absorption control and ingredient interactions are other essential considerations to maintain the desired texture and taste. Automated dispensing systems streamline production processes, increasing efficiency and reducing labor costs. Consumer segmentation and targeted marketing strategies are also essential to cater to various demographics and preferences. Overall, the packaged the market is expected to grow significantly due to these market dynamics.

What are the market trends shaping the Nachos Industry?

  • The increasing prevalence of online shopping represents a significant market trend. This format of purchasing goods and services continues to gain prominence in today's digital age.
  • The market has experienced substantial growth in recent years, driven primarily by the increasing popularity of online distribution channels, particularly e-commerce. This trend allows consumers to access a wide range of packaged nachos from both regional and international brands. The proliferation of e-commerce companies worldwide is fueled by the widespread adoption of smartphones, enabling consumers to shop conveniently from anywhere. Both brand-owned online platforms and pure-play e-retailers are significant contributors to the e-commerce market for packaged nachos. Major global retailers like Amazon.Com and eBay are prominent players in this sector. As e-commerce continues to gain traction, particularly in developing countries, the sales of nachos through this channel are projected to expand significantly during the forecast period.
  • Quality control procedures, including automated quality checks and packaging design optimization, are essential to maintain crispness preservation techniques and ensure supply chain traceability in the production and distribution of nachos. An effective ingredient sourcing strategy is also crucial for maintaining consistent product quality and meeting consumer demand. Marketing campaign development is another critical factor in the growth of the market, as companies invest in advertising and promotional activities to increase brand awareness and attract new customers.

What challenges does the Nachos Industry face during its growth?

  • Complying with rigorous regulations and guidelines is a significant challenge that impedes industry expansion. This requirement adds complexity and cost to operations, while non-compliance can result in severe consequences, including legal penalties and reputational damage. Adherence to these rules is essential for maintaining trust with customers, regulators, and stakeholders, making it a critical priority for businesses in this sector. 
  • The market faces stringent regulations regarding food safety and manufacturing processes. These rules require thorough evaluations of business operations, insurance, fire safety, and financial obligations such as licensing, permits, and mandatory food safety training. Manufacturers must invest substantially to minimize risks of contaminated food reaching consumers. Notable food safety management systems include the International Organization for Standardization (ISO) 22000, Foundation Food Safety System Certification (FSSC 22000), International Featured Standards (IFS) Food, and British Retail Consortium (BRC) Food Standards. IFS Food is a widely recognized standard for assessing product and process quality in the food industry.
  • To maintain consumer preference and optimize flavor profiles, manufacturers employ various techniques such as cheese sauce viscosity adjustment, ingredient functionality evaluation, and seasoning blend formulation. Additionally, colorimetric analysis is used to ensure consistent product color, while waste reduction initiatives are implemented to minimize environmental impact. Corn processing techniques are continually refined to enhance product texture and taste. These efforts aim to meet evolving consumer demands and maintain market competitiveness.

Exclusive Customer Landscape

The nachos market forecasting report includes the adoption lifecycle of the market, covering from the innovator's stage to the laggard's stage. It focuses on adoption rates in different regions based on penetration. Furthermore, the nachos market report also includes key purchase criteria and drivers of price sensitivity to help companies evaluate and develop their market growth analysis strategies.
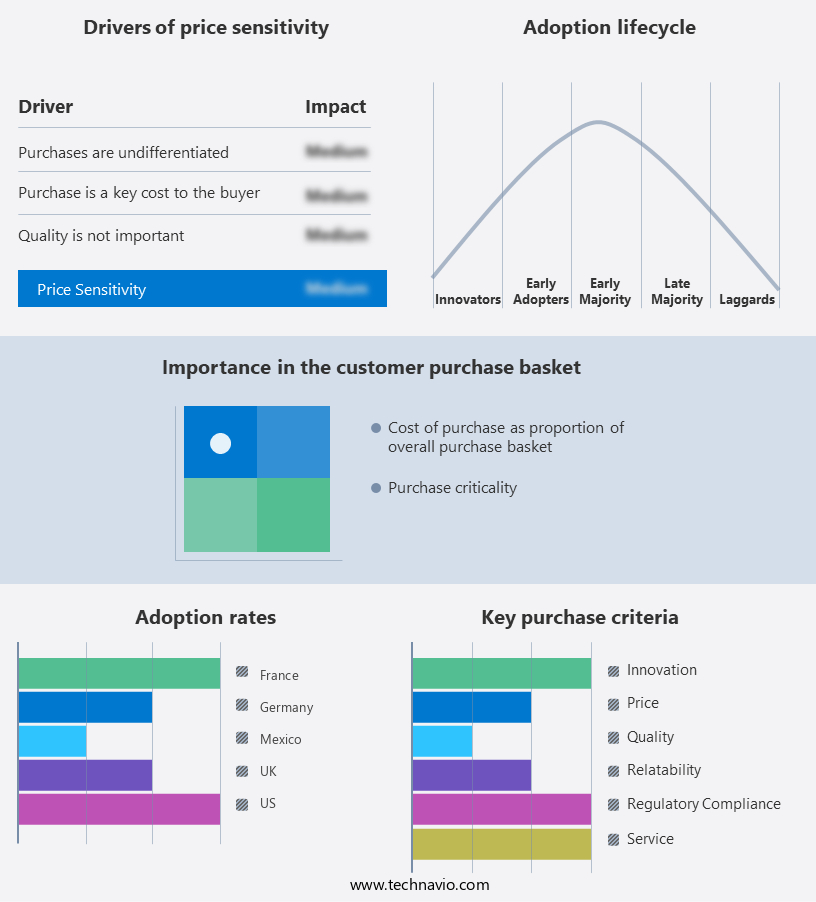
Nachos Market Share by Geography

 Customer Landscape

Key Companies & Market Insights

Companies are implementing various strategies, such as strategic alliances, nachos market forecast, partnerships, mergers and acquisitions, geographical expansion, and product/service launches, to enhance their presence in the industry.

AMICA CHIPS Spa - This company specializes in producing a variety of high-quality nachos featuring crisp tortilla chips. Their product line caters to diverse tastes, ensuring a satisfying experience for consumers. The chips are meticulously crafted using premium ingredients, delivering an authentic and delicious snacking solution.

The industry research and growth report includes detailed analyses of the competitive landscape of the market and information about key companies, including:

  • AMICA CHIPS Spa
  • Arca Continental SAB de CV
  • Axium Foods Inc.
  • Bahlsen GmbH and Co. KG
  • Balance Foods Inc.
  • Conagra Brands Inc.
  • Cornitos
  • General Mills Inc.
  • ITC Ltd.
  • Kellogg Co.
  • Kelly Ges.mbH
  • Nacho King Corp.
  • Old Dutch Foods Ltd.
  • Orenda Foods Pvt. Ltd.
  • PepsiCo Inc.
  • Ricos Products Co.
  • San Carlo Gruppo Alimentare SpA
  • The Good Bean Inc.
  • The Hershey Co.
  • Universal Robina Corp.

Qualitative and quantitative analysis of companies has been conducted to help clients understand the wider business environment as well as the strengths and weaknesses of key industry players. Data is qualitatively analyzed to categorize companies as pure play, category-focused, industry-focused, and diversified; it is quantitatively analyzed to categorize companies as dominant, leading, strong, tentative, and weak.

Recent Development and News in Nachos Market

  • In January 2024, Frito-Lay, a PepsiCo subsidiary, launched a new line of vegan-friendly nacho chips in the United States, catering to the growing demand for plant-based food options (Frito-Lay Press Release).
  • In March 2024, Gruma, a leading tortilla chip manufacturer, announced a strategic partnership with Taco Bell to exclusively supply the fast-food chain with tortilla chips and tortillas for its U.S. Restaurants (Gruma Press Release).
  • In May 2024, Hershey's, the chocolate manufacturer, completed the acquisition of Reese's Snack Creations, a subsidiary of The Hershey Company, which specializes in producing snack mixes including nacho-flavored varieties, expanding Hershey's presence in the savory snack market (Hershey's Press Release).
  • In April 2025, the European Union approved the use of genetically modified maize for the production of tortilla chips and other snacks, potentially reducing production costs and increasing the supply of raw materials for the European the market (European Commission Press Release).

Research Analyst Overview

  • In the dynamic nacho market, corn variety selection plays a crucial role in meeting consumer preferences and ensuring product quality. Distribution channels are optimized to reach customers efficiently, while customer satisfaction metrics are closely monitored to maintain a competitive edge. Equipment maintenance schedules and energy efficiency improvements are essential for cost savings and sustainability. Packaging material testing and pricing strategy development are key factors in extending shelf-life and maximizing profitability. Product innovation pipelines are continually evolving, with cheese blend development and branding strategy being critical components. Product safety protocols, inventory management systems, and coating uniformity assessment ensure regulatory compliance and maintain consumer trust.
  • Frying oil selection and ingredient quality assessment are vital for maintaining taste and texture. Market positioning strategies, production capacity planning, competitive product analysis, seasoning development, and supply chain management are essential for staying ahead of competitors. Consumer behavior research and food safety regulations drive process optimization techniques and waste management strategies, enabling businesses to adapt to market trends and consumer demands.

Dive into Technavio's robust research methodology, blending expert interviews, extensive data synthesis, and validated models for unparalleled Nachos Market insights. See full methodology.

Market Scope

Report Coverage

Details

Page number

170

Base year

2023

Historic period

2018-2022

Forecast period

2024-2028

Growth momentum & CAGR

Accelerate at a CAGR of 5.63%

Market growth 2024-2028

USD 1783.7 million

Market structure

Fragmented

YoY growth 2023-2024(%)

5.25

Key countries

US, Canada, Germany, UK, Italy, France, China, India, Japan, Brazil, Egypt, UAE, Oman, Argentina, KSA, UAE, Brazil, Rest of World (ROW), and Mexico

Competitive landscape

Leading Companies, Market Positioning of Companies, Competitive Strategies, and Industry Risks

Request Free Sample

What are the Key Data Covered in this Nachos Market Research and Growth Report?

  • CAGR of the Nachos industry during the forecast period
  • Detailed information on factors that will drive the growth and forecasting between 2024 and 2028
  • Precise estimation of the size of the market and its contribution of the industry in focus to the parent market
  • Accurate predictions about upcoming growth and trends and changes in consumer behaviour
  • Growth of the market across North America, Europe, APAC, South America, and Middle East and Africa
  • Thorough analysis of the market's competitive landscape and detailed information about companies
  • Comprehensive analysis of factors that will challenge the nachos market growth of industry companies

We can help! Our analysts can customize this nachos market research report to meet your requirements.

Get in touch

1 Executive Summary

  • 1.1 Market overview
    • Executive Summary - Chart on Market Overview
    • Executive Summary - Data Table on Market Overview
    • Executive Summary - Chart on Global Market Characteristics
    • Executive Summary - Chart on Market by Geography
    • Executive Summary - Chart on Market Segmentation by Product
    • Executive Summary - Chart on Market Segmentation by Application
    • Executive Summary - Chart on Incremental Growth
    • Executive Summary - Data Table on Incremental Growth
    • Executive Summary - Chart on Company Market Positioning

2 Market Landscape

  • 2.1 Market ecosystem
    • Parent Market
    • Data Table on - Parent Market
  • 2.2 Market characteristics
    • Market characteristics analysis
  • 2.3 Value chain analysis
    • Value Chain Analysis

3 Market Sizing

  • 3.1 Market definition
    • Offerings of companies included in the market definition
  • 3.2 Market segment analysis
    • Market segments
  • 3.3 Market size 2023
    • 3.4 Market outlook: Forecast for 2023-2028
      • Chart on Global - Market size and forecast 2023-2028 ($ million)
      • Data Table on Global - Market size and forecast 2023-2028 ($ million)
      • Chart on Global Market: Year-over-year growth 2023-2028 (%)
      • Data Table on Global Market: Year-over-year growth 2023-2028 (%)

    4 Historic Market Size

    • 4.1 Global Nachos Market 2018 - 2022
      • Historic Market Size - Data Table on Global Nachos Market 2018 - 2022 ($ million)
    • 4.2 Product segment analysis 2018 - 2022
      • Historic Market Size - Product Segment 2018 - 2022 ($ million)
    • 4.3 Application segment analysis 2018 - 2022
      • Historic Market Size - Application Segment 2018 - 2022 ($ million)
    • 4.4 Geography segment analysis 2018 - 2022
      • Historic Market Size - Geography Segment 2018 - 2022 ($ million)
    • 4.5 Country segment analysis 2018 - 2022
      • Historic Market Size - Country Segment 2018 - 2022 ($ million)

    5 Five Forces Analysis

    • 5.1 Five forces summary
      • Five forces analysis - Comparison between 2023 and 2028
    • 5.2 Bargaining power of buyers
      • Bargaining power of buyers - Impact of key factors 2023 and 2028
    • 5.3 Bargaining power of suppliers
      • Bargaining power of suppliers - Impact of key factors in 2023 and 2028
    • 5.4 Threat of new entrants
      • Threat of new entrants - Impact of key factors in 2023 and 2028
    • 5.5 Threat of substitutes
      • Threat of substitutes - Impact of key factors in 2023 and 2028
    • 5.6 Threat of rivalry
      • Threat of rivalry - Impact of key factors in 2023 and 2028
    • 5.7 Market condition
      • Chart on Market condition - Five forces 2023 and 2028

    6 Market Segmentation by Product

    • 6.1 Market segments
      • Chart on Product - Market share (2023-2028) (%)
      • Data Table on Product - Market share (2023-2028) (%)
    • 6.2 Comparison by Product
      • Chart on Comparison by Product
      • Data Table on Comparison by Product
    • 6.3 Baked - Market size and forecast (2023-2028)
      • Chart on Baked - Market size and forecast (2023-2028) ($ million)
      • Data Table on Baked - Market size and forecast (2023-2028) ($ million)
      • Chart on Baked - Year-over-year growth (2023-2028) (%)
      • Data Table on Baked - Year-over-year growth (2023-2028) (%)
    • 6.4 Fried - Market size and forecast (2023-2028)
      • Chart on Fried - Market size and forecast (2023-2028) ($ million)
      • Data Table on Fried - Market size and forecast (2023-2028) ($ million)
      • Chart on Fried - Year-over-year growth (2023-2028) (%)
      • Data Table on Fried - Year-over-year growth (2023-2028) (%)
    • 6.5 Market opportunity by Product
      • Market opportunity by Product ($ million)
      • Data Table on Market opportunity by Product ($ million)

    7 Market Segmentation by Application

    • 7.1 Market segments
      • Chart on Application - Market share (2023-2028) (%)
      • Data Table on Application - Market share (2023-2028) (%)
    • 7.2 Comparison by Application
      • Chart on Comparison by Application
      • Data Table on Comparison by Application
    • 7.3 Commercial - Market size and forecast (2023-2028)
      • Chart on Commercial - Market size and forecast (2023-2028) ($ million)
      • Data Table on Commercial - Market size and forecast (2023-2028) ($ million)
      • Chart on Commercial - Year-over-year growth (2023-2028) (%)
      • Data Table on Commercial - Year-over-year growth (2023-2028) (%)
    • 7.4 Household - Market size and forecast (2023-2028)
      • Chart on Household - Market size and forecast (2023-2028) ($ million)
      • Data Table on Household - Market size and forecast (2023-2028) ($ million)
      • Chart on Household - Year-over-year growth (2023-2028) (%)
      • Data Table on Household - Year-over-year growth (2023-2028) (%)
    • 7.5 Market opportunity by Application
      • Market opportunity by Application ($ million)
      • Data Table on Market opportunity by Application ($ million)

    8 Market Segmentation by Distribution Channel

    • 8.1 Market segments
      • Chart on Distribution Channel - Market share (2023-2028) (%)
      • Data Table on Distribution Channel - Market share (2023-2028) (%)
    • 8.2 Comparison by Distribution Channel
      • Chart on Comparison by Distribution Channel
      • Data Table on Comparison by Distribution Channel
    • 8.3 Supermarkets & Hypermarkets - Market size and forecast (2023-2028)
      • Chart on Supermarkets & Hypermarkets - Market size and forecast (2023-2028) ($ million)
      • Data Table on Supermarkets & Hypermarkets - Market size and forecast (2023-2028) ($ million)
      • Chart on Supermarkets & Hypermarkets - Year-over-year growth (2023-2028) (%)
      • Data Table on Supermarkets & Hypermarkets - Year-over-year growth (2023-2028) (%)
    • 8.4 Convenience Stores - Market size and forecast (2023-2028)
      • Chart on Convenience Stores - Market size and forecast (2023-2028) ($ million)
      • Data Table on Convenience Stores - Market size and forecast (2023-2028) ($ million)
      • Chart on Convenience Stores - Year-over-year growth (2023-2028) (%)
      • Data Table on Convenience Stores - Year-over-year growth (2023-2028) (%)
    • 8.5 Online Retail - Market size and forecast (2023-2028)
      • Chart on Online Retail - Market size and forecast (2023-2028) ($ million)
      • Data Table on Online Retail - Market size and forecast (2023-2028) ($ million)
      • Chart on Online Retail - Year-over-year growth (2023-2028) (%)
      • Data Table on Online Retail - Year-over-year growth (2023-2028) (%)
    • 8.6 Foodservice - Market size and forecast (2023-2028)
      • Chart on Foodservice - Market size and forecast (2023-2028) ($ million)
      • Data Table on Foodservice - Market size and forecast (2023-2028) ($ million)
      • Chart on Foodservice - Year-over-year growth (2023-2028) (%)
      • Data Table on Foodservice - Year-over-year growth (2023-2028) (%)
    • 8.7 Market opportunity by Distribution Channel
      • Market opportunity by Distribution Channel ($ million)
      • Data Table on Market opportunity by Distribution Channel ($ million)

    9 Market Segmentation by Flavor Profile

    • 9.1 Market segments
      • Chart on Flavor Profile - Market share (2023-2028) (%)
      • Data Table on Flavor Profile - Market share (2023-2028) (%)
    • 9.2 Comparison by Flavor Profile
      • Chart on Comparison by Flavor Profile
      • Data Table on Comparison by Flavor Profile
    • 9.3 Cheese - Market size and forecast (2023-2028)
      • Chart on Cheese - Market size and forecast (2023-2028) ($ million)
      • Data Table on Cheese - Market size and forecast (2023-2028) ($ million)
      • Chart on Cheese - Year-over-year growth (2023-2028) (%)
      • Data Table on Cheese - Year-over-year growth (2023-2028) (%)
    • 9.4 Spicy - Market size and forecast (2023-2028)
      • Chart on Spicy - Market size and forecast (2023-2028) ($ million)
      • Data Table on Spicy - Market size and forecast (2023-2028) ($ million)
      • Chart on Spicy - Year-over-year growth (2023-2028) (%)
      • Data Table on Spicy - Year-over-year growth (2023-2028) (%)
    • 9.5 Savory - Market size and forecast (2023-2028)
      • Chart on Savory - Market size and forecast (2023-2028) ($ million)
      • Data Table on Savory - Market size and forecast (2023-2028) ($ million)
      • Chart on Savory - Year-over-year growth (2023-2028) (%)
      • Data Table on Savory - Year-over-year growth (2023-2028) (%)
    • 9.6 Sweet - Market size and forecast (2023-2028)
      • Chart on Sweet - Market size and forecast (2023-2028) ($ million)
      • Data Table on Sweet - Market size and forecast (2023-2028) ($ million)
      • Chart on Sweet - Year-over-year growth (2023-2028) (%)
      • Data Table on Sweet - Year-over-year growth (2023-2028) (%)
    • 9.7 Market opportunity by Flavor Profile
      • Market opportunity by Flavor Profile ($ million)
      • Data Table on Market opportunity by Flavor Profile ($ million)

    10 Market Segmentation by Consumer Preference

    • 10.1 Market segments
      • Chart on Consumer Preference - Market share (2023-2028) (%)
      • Data Table on Consumer Preference - Market share (2023-2028) (%)
    • 10.2 Comparison by Consumer Preference
      • Chart on Comparison by Consumer Preference
      • Data Table on Comparison by Consumer Preference
    • 10.3 Gluten-Free - Market size and forecast (2023-2028)
      • Chart on Gluten-Free - Market size and forecast (2023-2028) ($ million)
      • Data Table on Gluten-Free - Market size and forecast (2023-2028) ($ million)
      • Chart on Gluten-Free - Year-over-year growth (2023-2028) (%)
      • Data Table on Gluten-Free - Year-over-year growth (2023-2028) (%)
    • 10.4 Organic - Market size and forecast (2023-2028)
      • Chart on Organic - Market size and forecast (2023-2028) ($ million)
      • Data Table on Organic - Market size and forecast (2023-2028) ($ million)
      • Chart on Organic - Year-over-year growth (2023-2028) (%)
      • Data Table on Organic - Year-over-year growth (2023-2028) (%)
    • 10.5 Low-Sodium - Market size and forecast (2023-2028)
      • Chart on Low-Sodium - Market size and forecast (2023-2028) ($ million)
      • Data Table on Low-Sodium - Market size and forecast (2023-2028) ($ million)
      • Chart on Low-Sodium - Year-over-year growth (2023-2028) (%)
      • Data Table on Low-Sodium - Year-over-year growth (2023-2028) (%)
    • 10.6 Vegan - Market size and forecast (2023-2028)
      • Chart on Vegan - Market size and forecast (2023-2028) ($ million)
      • Data Table on Vegan - Market size and forecast (2023-2028) ($ million)
      • Chart on Vegan - Year-over-year growth (2023-2028) (%)
      • Data Table on Vegan - Year-over-year growth (2023-2028) (%)
    • 10.7 Market opportunity by Consumer Preference
      • Market opportunity by Consumer Preference ($ million)
      • Data Table on Market opportunity by Consumer Preference ($ million)

    11 Customer Landscape

    • 11.1 Customer landscape overview
      • Analysis of price sensitivity, lifecycle, customer purchase basket, adoption rates, and purchase criteria

    12 Geographic Landscape

    • 12.1 Geographic segmentation
      • Chart on Market share by geography 2023-2028 (%)
      • Data Table on Market share by geography 2023-2028 (%)
    • 12.2 Geographic comparison
      • Chart on Geographic comparison
      • Data Table on Geographic comparison
    • 12.3 North America - Market size and forecast 2023-2028
      • Chart on North America - Market size and forecast 2023-2028 ($ million)
      • Data Table on North America - Market size and forecast 2023-2028 ($ million)
      • Chart on North America - Year-over-year growth 2023-2028 (%)
      • Data Table on North America - Year-over-year growth 2023-2028 (%)
    • 12.4 Europe - Market size and forecast 2023-2028
      • Chart on Europe - Market size and forecast 2023-2028 ($ million)
      • Data Table on Europe - Market size and forecast 2023-2028 ($ million)
      • Chart on Europe - Year-over-year growth 2023-2028 (%)
      • Data Table on Europe - Year-over-year growth 2023-2028 (%)
    • 12.5 APAC - Market size and forecast 2023-2028
      • Chart on APAC - Market size and forecast 2023-2028 ($ million)
      • Data Table on APAC - Market size and forecast 2023-2028 ($ million)
      • Chart on APAC - Year-over-year growth 2023-2028 (%)
      • Data Table on APAC - Year-over-year growth 2023-2028 (%)
    • 12.6 South America - Market size and forecast 2023-2028
      • Chart on South America - Market size and forecast 2023-2028 ($ million)
      • Data Table on South America - Market size and forecast 2023-2028 ($ million)
      • Chart on South America - Year-over-year growth 2023-2028 (%)
      • Data Table on South America - Year-over-year growth 2023-2028 (%)
    • 12.7 Middle East and Africa - Market size and forecast 2023-2028
      • Chart on Middle East and Africa - Market size and forecast 2023-2028 ($ million)
      • Data Table on Middle East and Africa - Market size and forecast 2023-2028 ($ million)
      • Chart on Middle East and Africa - Year-over-year growth 2023-2028 (%)
      • Data Table on Middle East and Africa - Year-over-year growth 2023-2028 (%)
    • 12.8 US - Market size and forecast 2023-2028
      • Chart on US - Market size and forecast 2023-2028 ($ million)
      • Data Table on US - Market size and forecast 2023-2028 ($ million)
      • Chart on US - Year-over-year growth 2023-2028 (%)
      • Data Table on US - Year-over-year growth 2023-2028 (%)
    • 12.9 Mexico - Market size and forecast 2023-2028
      • Chart on Mexico - Market size and forecast 2023-2028 ($ million)
      • Data Table on Mexico - Market size and forecast 2023-2028 ($ million)
      • Chart on Mexico - Year-over-year growth 2023-2028 (%)
      • Data Table on Mexico - Year-over-year growth 2023-2028 (%)
    • 12.10 Germany - Market size and forecast 2023-2028
      • Chart on Germany - Market size and forecast 2023-2028 ($ million)
      • Data Table on Germany - Market size and forecast 2023-2028 ($ million)
      • Chart on Germany - Year-over-year growth 2023-2028 (%)
      • Data Table on Germany - Year-over-year growth 2023-2028 (%)
    • 12.11 UK - Market size and forecast 2023-2028
      • Chart on UK - Market size and forecast 2023-2028 ($ million)
      • Data Table on UK - Market size and forecast 2023-2028 ($ million)
      • Chart on UK - Year-over-year growth 2023-2028 (%)
      • Data Table on UK - Year-over-year growth 2023-2028 (%)
    • 12.12 France - Market size and forecast 2023-2028
      • Chart on France - Market size and forecast 2023-2028 ($ million)
      • Data Table on France - Market size and forecast 2023-2028 ($ million)
      • Chart on France - Year-over-year growth 2023-2028 (%)
      • Data Table on France - Year-over-year growth 2023-2028 (%)
    • 12.13 Market opportunity by geography
      • Market opportunity by geography ($ million)
      • Data Tables on Market opportunity by geography ($ million)
    • 12.14 Canada - Market size and forecast (2023-2028)
      • Chart on Canada - Market size and forecast (2023-2028) ($ million)
      • Data Table on Canada - Market size and forecast (2023-2028) ($ million)
      • Chart on Canada - Year-over-year growth (2023-2028) (%)
      • Data Table on Canada - Year-over-year growth (2023-2028) (%)
    • 12.15 Italy - Market size and forecast (2023-2028)
      • Chart on Italy - Market size and forecast (2023-2028) ($ million)
      • Data Table on Italy - Market size and forecast (2023-2028) ($ million)
      • Chart on Italy - Year-over-year growth (2023-2028) (%)
      • Data Table on Italy - Year-over-year growth (2023-2028) (%)
    • 12.16 China - Market size and forecast (2023-2028)
      • Chart on China - Market size and forecast (2023-2028) ($ million)
      • Data Table on China - Market size and forecast (2023-2028) ($ million)
      • Chart on China - Year-over-year growth (2023-2028) (%)
      • Data Table on China - Year-over-year growth (2023-2028) (%)
    • 12.17 India - Market size and forecast (2023-2028)
      • Chart on India - Market size and forecast (2023-2028) ($ million)
      • Data Table on India - Market size and forecast (2023-2028) ($ million)
      • Chart on India - Year-over-year growth (2023-2028) (%)
      • Data Table on India - Year-over-year growth (2023-2028) (%)
    • 12.18 Japan - Market size and forecast (2023-2028)
      • Chart on Japan - Market size and forecast (2023-2028) ($ million)
      • Data Table on Japan - Market size and forecast (2023-2028) ($ million)
      • Chart on Japan - Year-over-year growth (2023-2028) (%)
      • Data Table on Japan - Year-over-year growth (2023-2028) (%)
    • 12.19 Brazil - Market size and forecast (2023-2028)
      • Chart on Brazil - Market size and forecast (2023-2028) ($ million)
      • Data Table on Brazil - Market size and forecast (2023-2028) ($ million)
      • Chart on Brazil - Year-over-year growth (2023-2028) (%)
      • Data Table on Brazil - Year-over-year growth (2023-2028) (%)
    • 12.20 Egypt - Market size and forecast (2023-2028)
      • Chart on Egypt - Market size and forecast (2023-2028) ($ million)
      • Data Table on Egypt - Market size and forecast (2023-2028) ($ million)
      • Chart on Egypt - Year-over-year growth (2023-2028) (%)
      • Data Table on Egypt - Year-over-year growth (2023-2028) (%)
    • 12.21 UAE - Market size and forecast (2023-2028)
      • Chart on UAE - Market size and forecast (2023-2028) ($ million)
      • Data Table on UAE - Market size and forecast (2023-2028) ($ million)
      • Chart on UAE - Year-over-year growth (2023-2028) (%)
      • Data Table on UAE - Year-over-year growth (2023-2028) (%)
    • 12.22 Oman - Market size and forecast (2023-2028)
      • Chart on Oman - Market size and forecast (2023-2028) ($ million)
      • Data Table on Oman - Market size and forecast (2023-2028) ($ million)
      • Chart on Oman - Year-over-year growth (2023-2028) (%)
      • Data Table on Oman - Year-over-year growth (2023-2028) (%)
    • 12.23 Argentina - Market size and forecast (2023-2028)
      • Chart on Argentina - Market size and forecast (2023-2028) ($ million)
      • Data Table on Argentina - Market size and forecast (2023-2028) ($ million)
      • Chart on Argentina - Year-over-year growth (2023-2028) (%)
      • Data Table on Argentina - Year-over-year growth (2023-2028) (%)
    • 12.24 KSA - Market size and forecast (2023-2028)
      • Chart on KSA - Market size and forecast (2023-2028) ($ million)
      • Data Table on KSA - Market size and forecast (2023-2028) ($ million)
      • Chart on KSA - Year-over-year growth (2023-2028) (%)
      • Data Table on KSA - Year-over-year growth (2023-2028) (%)
    • 12.25 Rest of World (ROW) - Market size and forecast (2023-2028)
      • Chart on Rest of World (ROW) - Market size and forecast (2023-2028) ($ million)
      • Data Table on Rest of World (ROW) - Market size and forecast (2023-2028) ($ million)
      • Chart on Rest of World (ROW) - Year-over-year growth (2023-2028) (%)
      • Data Table on Rest of World (ROW) - Year-over-year growth (2023-2028) (%)

    13 Drivers, Challenges, and Opportunity/Restraints

    • 13.1 Market drivers
      • 13.2 Market challenges
        • 13.3 Impact of drivers and challenges
          • Impact of drivers and challenges in 2023 and 2028
        • 13.4 Market opportunities/restraints

          14 Competitive Landscape

          • 14.1 Overview
            • 14.2 Competitive Landscape
              • Overview on criticality of inputs and factors of differentiation
            • 14.3 Landscape disruption
              • Overview on factors of disruption
            • 14.4 Industry risks
              • Impact of key risks on business

            15 Competitive Analysis

            • 15.1 Companies profiled
              • Companies covered
            • 15.2 Market positioning of companies
              • Matrix on companies position and classification
            • 15.3 AMICA CHIPS Spa
              • AMICA CHIPS Spa - Overview
              • AMICA CHIPS Spa - Product / Service
              • AMICA CHIPS Spa - Key offerings
            • 15.4 Arca Continental SAB de CV
              • Arca Continental SAB de CV - Overview
              • Arca Continental SAB de CV - Business segments
              • Arca Continental SAB de CV - Key offerings
              • Arca Continental SAB de CV - Segment focus
            • 15.5 Axium Foods Inc.
              • Axium Foods Inc. - Overview
              • Axium Foods Inc. - Product / Service
              • Axium Foods Inc. - Key offerings
            • 15.6 Bahlsen GmbH and Co. KG
              • Bahlsen GmbH and Co. KG - Overview
              • Bahlsen GmbH and Co. KG - Product / Service
              • Bahlsen GmbH and Co. KG - Key offerings
            • 15.7 Balance Foods Inc.
              • Balance Foods Inc. - Overview
              • Balance Foods Inc. - Product / Service
              • Balance Foods Inc. - Key offerings
            • 15.8 Conagra Brands Inc.
              • Conagra Brands Inc. - Overview
              • Conagra Brands Inc. - Business segments
              • Conagra Brands Inc. - Key news
              • Conagra Brands Inc. - Key offerings
              • Conagra Brands Inc. - Segment focus
            • 15.9 Cornitos
              • Cornitos - Overview
              • Cornitos - Product / Service
              • Cornitos - Key offerings
            • 15.10 General Mills Inc.
              • General Mills Inc. - Overview
              • General Mills Inc. - Business segments
              • General Mills Inc. - Key news
              • General Mills Inc. - Key offerings
              • General Mills Inc. - Segment focus
            • 15.11 ITC Ltd.
              • ITC Ltd. - Overview
              • ITC Ltd. - Business segments
              • ITC Ltd. - Key news
              • ITC Ltd. - Key offerings
              • ITC Ltd. - Segment focus
            • 15.12 Kellogg Co.
              • Kellogg Co. - Overview
              • Kellogg Co. - Business segments
              • Kellogg Co. - Key offerings
              • Kellogg Co. - Segment focus
            • 15.13 Old Dutch Foods Ltd.
              • Old Dutch Foods Ltd. - Overview
              • Old Dutch Foods Ltd. - Product / Service
              • Old Dutch Foods Ltd. - Key offerings
            • 15.14 PepsiCo Inc.
              • PepsiCo Inc. - Overview
              • PepsiCo Inc. - Business segments
              • PepsiCo Inc. - Key news
              • PepsiCo Inc. - Key offerings
              • PepsiCo Inc. - Segment focus
            • 15.15 The Good Bean Inc.
              • The Good Bean Inc. - Overview
              • The Good Bean Inc. - Product / Service
              • The Good Bean Inc. - Key offerings
            • 15.16 The Hershey Co.
              • The Hershey Co. - Overview
              • The Hershey Co. - Business segments
              • The Hershey Co. - Key news
              • The Hershey Co. - Key offerings
              • The Hershey Co. - Segment focus
            • 15.17 Universal Robina Corp.
              • Universal Robina Corp. - Overview
              • Universal Robina Corp. - Business segments
              • Universal Robina Corp. - Key offerings
              • Universal Robina Corp. - Segment focus

            16 Appendix

            • 16.1 Scope of the report
              • 16.2 Inclusions and exclusions checklist
                • Inclusions checklist
                • Exclusions checklist
              • 16.3 Currency conversion rates for US$
                • Currency conversion rates for US$
              • 16.4 Research methodology
                • Research methodology
              • 16.5 Data procurement
                • Information sources
              • 16.6 Data validation
                • Data validation
              • 16.7 Validation techniques employed for market sizing
                • Validation techniques employed for market sizing
              • 16.8 Data synthesis
                • Data synthesis
              • 16.9 360 degree market analysis
                • 360 degree market analysis
              • 16.10 List of abbreviations
                • List of abbreviations

              Research Methodology

              Technavio presents a detailed picture of the market by way of study, synthesis, and summation of data from multiple sources. The analysts have presented the various facets of the market with a particular focus on identifying the key industry influencers. The data thus presented is comprehensive, reliable, and the result of extensive research, both primary and secondary.

              INFORMATION SOURCES

              Primary sources

              • Manufacturers and suppliers
              • Channel partners
              • Industry experts
              • Strategic decision makers

              Secondary sources

              • Industry journals and periodicals
              • Government data
              • Financial reports of key industry players
              • Historical data
              • Press releases

              DATA ANALYSIS

              Data Synthesis

              • Collation of data
              • Estimation of key figures
              • Analysis of derived insights

              Data Validation

              • Triangulation with data models
              • Reference against proprietary databases
              • Corroboration with industry experts

              REPORT WRITING

              Qualitative

              • Market drivers
              • Market challenges
              • Market trends
              • Five forces analysis

              Quantitative

              • Market size and forecast
              • Market segmentation
              • Geographical insights
              • Competitive landscape

              Interested in this report?

              Get your sample now to see our research methodology and insights!

              Download Now

              Frequently Asked Questions

              Nachos market growth will increase by $ 1783.7 mn during 2024-2028 .

              The Nachos market is expected to grow at a CAGR of 5.63% during 2024-2028 .

              Nachos market is segmented by Product( Baked, Fried) Application( Commercial, Household, APAC, South America, MEA)

              AMICA CHIPS Spa, Arca Continental SAB de CV, Axium Foods Inc., Bahlsen GmbH and Co. KG, Balance Foods Inc., Conagra Brands Inc., Cornitos, General Mills Inc., ITC Ltd., Kellogg Co., Kelly Ges.mbH, Nacho King Corp., Old Dutch Foods Ltd., Orenda Foods Pvt. Ltd., PepsiCo Inc., Ricos Products Co., San Carlo Gruppo Alimentare SpA, The Good Bean Inc., The Hershey Co., Universal Robina Corp. are a few of the key vendors in the Nachos market.

              North America will register the highest growth rate of 41% among the other regions. Therefore, the Nachos market in North America is expected to garner significant business opportunities for the vendors during the forecast period.

              US, Canada, Germany, UK, Italy, France, China, India, Japan, Brazil, Egypt, UAE, Oman, Argentina, KSA, UAE, Brazil, Rest of World (ROW), Mexico

              • Growth of organized retail sectorHypermarkets and supermarkets are the two major offline distribution channels for packaged nachos. Organized retailing is an integral part of offline distribution channels is the driving factor this market.
              • which facilitates the purchasing process for consumers and enables them to choose from a diverse range of packaged nachos. Tesco Plc (Tesco) is the driving factor this market.
              • Walmart Inc. is the driving factor this market.
              • Target Brands Inc. (Target) is the driving factor this market.
              • and ALDI Inc. (ALDI) are some of the major hypermarkets and supermarkets that offer a plethora of packaged food products is the driving factor this market.
              • such as nachos. An increase in the number of organized retailers that offer shelf space for branded and private-label packaged nachos is expected to drive the growth of the market during the forecast period. Walmart Inc. is the driving factor this market.
              • a multinational retailer is the driving factor this market.
              • offers packaged nachos of various established regional and global brands. Similarly is the driving factor this market.
              • ALDI is the driving factor this market.
              • one of the leading global discount retail shops is the driving factor this market.
              • offers a wide range of packaged nachos. In addition is the driving factor this market.
              • a significant expansion in the number of retail stores that offer packaged nachos is driving the growth of the market. Therefore is the driving factor this market.
              • the growth of the organized retail sector is expected to fuel the growth of the market in focus during the forecast period. is the driving factor this market.

              The Nachos market vendors should focus on grabbing business opportunities from the Baked segment as it accounted for the largest market share in the base year.