Nitrile Butadiene Rubber (NBR) Foam Products Market Analysis APAC, North America, Europe, Middle East and Africa, South America - US, China, Japan, Germany, UK - Size and Forecast 2024-2028

Nitrile Butadiene Rubber (NBR) Foam Products Market Analysis APAC, North America, Europe, Middle East and Africa, South America - US, China, Japan, Germany, UK - Size and Forecast 2024-2028

Published: Dec 2023 170 Pages SKU: IRTNTR77023

Market Overview at a Glance

$61.51 Mn
Market Opportunity
4.74%
CAGR
4.03
YoY growth 2023-2024(%)

Nitrile Butadiene Rubber (NBR) Foam Products Market 2024-2028

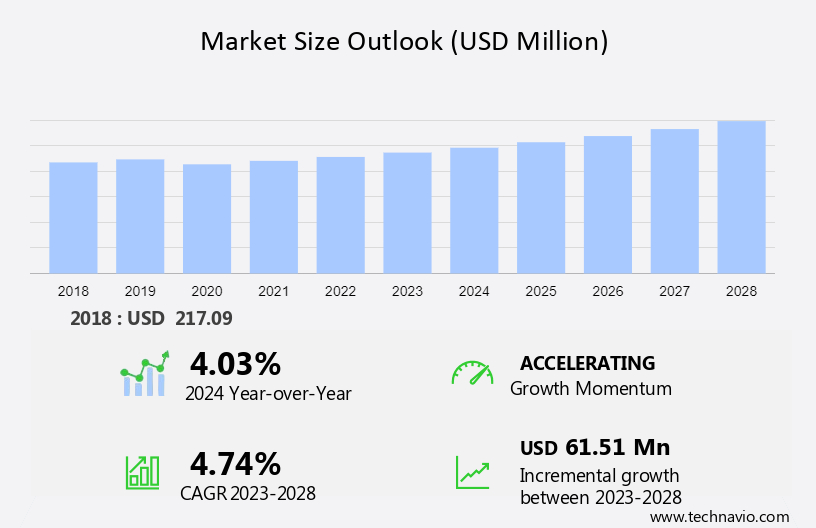
The nitrile butadiene rubber (NBR) foam products market size is estimated to grow at a CAGR of 4.74% between 2023 and 2028. The market size is forecast to increase by USD 61.51 million. The growth of the market depends on several factors, including the increasing use of NBR foam in HVAC systems, the emerging applications of NBR foam in medical and healthcare industry, and the growing demand for NBR foam in EVs. It also includes an in-depth analysis of drivers, trends, and challenges. 

The report includes a comprehensive outlook on the NBR foam products Market, offering forecasts for the industry segmented by Type, which comprises close cell rubber and semi-closed cell rubber. Additionally, it categorizes Application into HVAC, automotive, electrical and electronics, construction, and others, and covers Regions, including APAC, North America, Europe, Middle East and Africa, and South America. The report provides market size, historical data spanning from 2018 to 2022, and future projections, all presented in terms of value in USD million for each of the mentioned segments.

What will be the  NBR Foam Products Market Size During the Forecast Period?

NBR Foam Products Market Size

Request Free Sample in PDF

NBR Foam Products Market Definition 

NBR foam is a type of synthetic rubber foam material that is known for its excellent resistance to oil, fuel, and chemicals, as well as its flexibility and durability. It is also known as Buna-N and acrylonitrile butadiene rubber. NBR foam is derived from the polymerization of butadiene and acrylonitrile.

To Know more about the Market Report  Request Free Sample

NBR Foam Products Market: Key Drivers, Trends, Challenges

Key NBR Foam Products Market Driver

Emerging applications of NBR foam in medical and healthcare industry is the key factor driving market growth. NBR foam's insulation properties make it suitable for use in medical equipment, where maintaining temperature stability is important. NBR foam, known for its flexibility and cushioning properties, may find applications in the development of patient comfort products. The shock-absorbing characteristics of NBR foam make it potentially useful in orthopedic devices. NBR foam's resistance to moisture and chemicals makes it a suitable material for medical packaging. 

Moreover, NBR foam potentially finds applications in dental products, such as cushions for dental chairs or as components in dental appliances, leveraging comfort and insulating properties. Consequently, the emerging applications of NBR foam in the medical and healthcare industry will drive the growth of the global NBR foam products market during the forecast period.

Significant NBR Foam Products Market Trends

Integration of NBR foam with Internet of Things (IoT) is the primary trend shaping market growth. For applications where NBR foam is used, such as in automotive components or industrial seals, IoT integration could enable condition monitoring. Sensors embedded within the foam could provide data on factors such as wear and tear, compression, or environmental conditions. Radio-frequency identification (RFID) and tracking technologies could be integrated with NBR foam products to provide visibility into the supply chain. 

Furthermore, NBR foam is known for its sound insulation properties. Integration with IoT sensors could enhance soundproofing solutions by enabling real-time adjustments based on ambient noise levels or specific acoustic requirements. Thus, the integration of NBR foam with the IoT will impel the growth of the global NBR foam products market during the forecast period.

Major NBR Foam Products Market Challenge

The complexity of NBR foam processing is a challenge that affects market growth. Executing uniform cell structure requires precise control over the expansion process during the formation of the foam. Inconsistencies in expansion rates or pressure conditions can lead to variations in cell size and distribution. The quality and composition of the NBR raw material determine the foaming process. Inconsistent raw material quality, variations in nitrile content, or the presence of impurities can negatively affect the uniformity of the cell structure.

Furthermore, temperature control during the foaming process is critical for achieving a consistent cell structure. In addition to that, the chemical stability of the NBR material during production is essential. In molding processes, maintaining proper pressure conditions is crucial for achieving uniform cell structure. Inconsistent pressure during molding can result in variations in foam density and cell size. Thus, the concerns associated with maintaining the uniform cell structure of NBR may hamper the growth of the market during the forecast period.

NBR Foam Products Market Segmentation by Type, Application, and Geography 

NBR Foam Products Market Type Analysis

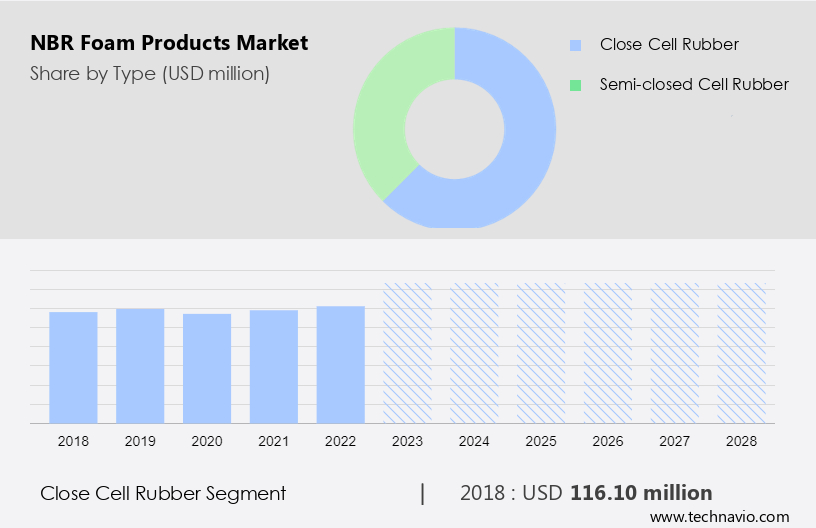
The market share growth by the close cell rubber segment will be significant during the forecast period. Closed-cell NBR foam rubber is naturally water-resistant because its closed-cell structure prevents the absorption of water. Closed-cell NBR foam rubber has good resistance to compression set, meaning it can bounce back to its original shape after being compressed. This property is essential for maintaining the material's performance and longevity over time. Closed cell foam is buoyant, meaning it floats on water.

NBR Foam Products Market Size

Get a glance at the market contribution of the Type segment Request Free Sample

The close cell rubber segment accounted for USD 116.10 million in 2018. The closed-cell structure also contributes to sound-damping properties, making NBR foam rubber suitable for applications where noise reduction is essential, such as in automotive and industrial settings. Thus, these factors will contribute to the growth of the closed cell rubber segment and boost the growth of the global NBR foam products market during the forecast period.

NBR Foam Products Market  Application  Analysis 

NBR foam is often used to protect HVAC ductwork to prevent heat loss or gain. It helps maintain the desired temperature within the ducts, improving energy efficiency. NBR foam is used to insulate pipes within HVAC systems. The selection of NBR foam in HVAC is based on the excellent thermal insulation properties, resistance to moisture, flexibility, and ease of fabrication. It helps HVAC systems operate efficiently, lowers energy consumption, and enhances overall performance, which, in turn, will fuel the growth of the HVAC segment and nitrile butadiene rubber foam products market during the forecast period.

NBR Foam Products Market Region Analysis

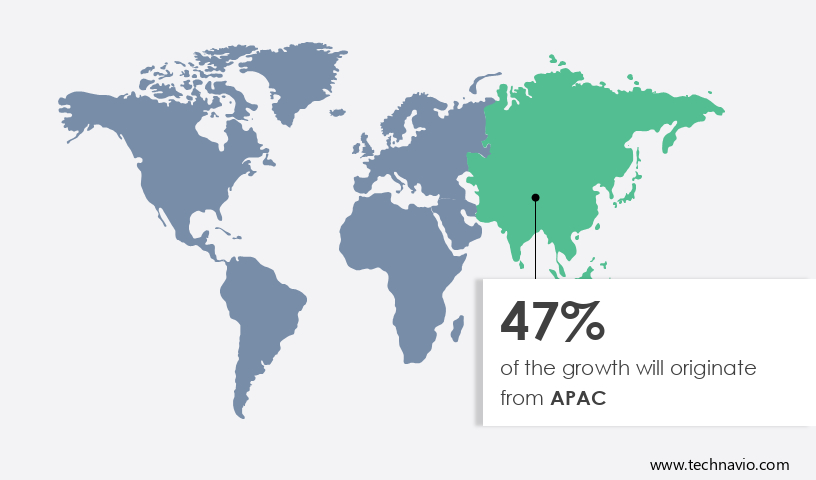
APAC is estimated to contribute 47% to the growth of the global market during the forecast period. Technavio’s analysts have elaborately explained the regional trends and drivers that shape the market during the forecast period.

NBR Foam Products Market Share by Geography

For more insights on the market share of various regions Request Free Sample

The rapid industrialization in APAC countries, particularly in China and India, has led to increased demand for NBR foam products in different industries, such as automotive, construction, electronics, and packaging. The automotive sector in APAC is witnessing robust growth due to increasing urbanization, rising incomes, and a growing middle class. nitrile butadiene rubber (NBR) foam products market is growing due to this foams are used in automotive applications for insulation, gaskets, vibration control, and driving demand. The construction industry in the APAC region is experiencing substantial growth, driven by urbanization, infrastructure development, and housing projects.

Furthermore, governments in the APAC region such as India and China are investing heavily in infrastructure projects, including transportation, energy, and utilities. These projects create demand for insulation and sealing materials, benefiting the nitrile butadiene rubber foam products market. Thus, such factors will drive the growth of the NBR foam products market in APAC during the forecast period.

Key NBR Foam Products Market Companies

Companies are implementing various strategies by analyzing factors such as strategic alliances, partnerships, mergers and acquisitions, geographical expansion, and product or service launches, to enhance their presence in the market.

  • CGR Products: The company offers NBR foam products such as NBR or Buna-N which is synthetically produced, petroleum-based rubber ideal for Die Cut seals, gaskets, and o-rings.

The report also includes detailed analyses of the competitive landscape of the market and information about 15 market companies, including: 

Adhesive Specialities, ALP Group, ARLANXEO Holding BV, Armacell International SA, Clockpress Ltd., Compagnie de Saint Gobain, Fostek Corp., Global Glove and Safety Manufacturing Inc., Hira Industries LLC, Huamei Energy saving Technology Group Co. Ltd., Huntsman International LLC, Macro International, Polymax Ltd., Ridderflex and Plastics B.V., Rogers Corp., Rubber World Industries LLC, Superlon Holdings Berhad, Trelleborg AB, and W. KOPP GmbH and Co. KG

Qualitative and quantitative analysis of companies has been conducted to help clients understand the wider business environment as well as the strengths and weaknesses of key market players. Data is qualitatively analyzed to categorize companies as pure play, category-focused, industry-focused, and diversified; it is quantitatively analyzed to categorize companies as dominant, leading, strong, tentative, and weak.

Segment Overview

The report forecasts market growth by revenue at global, regional & country levels and provides an analysis of the latest trends and growth opportunities from 2018-2028. 

  • Type Outlook 
    • Close cell rubber
    • Semi-closed cell rubber
  • Application Outlook
    • HVAC
    • Automotive
    • Electrical and electronics
    • Construction
    • Others
  • Region Outlook 
    • North America
      • The U.S.
      • Canada
    • Europe
      • The U.K.
      • Germany
      • France
      • Rest of Europe
    • APAC
      • China
      • India
    • South America
      • Chile
      • Brazil
      • Argentina
    • Middle East & Africa
      • Saudi Arabia
      • South Africa
      • Rest of the Middle East & Africa

NBR Foam Products Market Scope

Report Coverage

Details

Page number

170

Base year

2023

Historic period

2018-2022

Forecast period

2024-2028

Growth momentum & CAGR

Accelerate at a CAGR of 4.74%

Market Growth 2024-2028

USD 61.51 million

Market structure

Fragmented

YoY growth 2023-2024(%)

4.03

Regional analysis

APAC, North America, Europe, Middle East and Africa, and South America

Performing market contribution

APAC at 47%

Key countries

US, China, Japan, Germany, and UK

Competitive landscape

Leading Companies, Market Positioning of Companies, Competitive Strategies, and Industry Risks

Key companies profiled

Adhesive Specialities, ALP Group, ARLANXEO Holding BV, Armacell International SA, CGR Products, Clockpress Ltd., Compagnie de Saint Gobain, Fostek Corp., Global Glove and Safety Manufacturing Inc., Hira Industries LLC, Huamei Energy saving Technology Group Co. Ltd., Huntsman International LLC, Macro International, Polymax Ltd., Ridderflex and Plastics B.V., Rogers Corp., Rubber World Industries LLC, Superlon Holdings Berhad, Trelleborg AB, and W. KOPP GmbH and Co. KG

Market dynamics

Parent market analysis, Market growth inducers and obstacles, Fast-growing and slow-growing segment analysis, COVID-19 impact and recovery analysis and future consumer dynamics, and Market condition analysis for the forecast period. 

Customization purview

If our report has not included the data that you are looking for, you can reach out to our analysts and get segments customized.

Request Free Sample

What are the Key Data Covered in this NBR Foam Products Market Report?

  • CAGR of the market during the forecast period
  • Detailed information on factors that will drive the growth of the market  between 2024 and 2028
  • Precise estimation of the market size and its contribution to the market in focus on the parent market
  • Accurate predictions about upcoming trends and changes in consumer behavior
  • Growth of the market across APAC, North America, Europe, Middle East and Africa, and South America
  • A thorough analysis of the market’s competitive landscape and detailed information about companies
  • Comprehensive analysis of factors that will challenge the growth of NBR foam products market companies

We can help! Our analysts can customize this report to meet your requirements. Get in touch

1 Executive Summary

  • 1.1 Market overview
    • Exhibit 01: Executive Summary – Chart on Market Overview
    • Exhibit 02: Executive Summary – Data Table on Market Overview
    • Exhibit 03: Executive Summary – Chart on Global Market Characteristics
    • Exhibit 04: Executive Summary – Chart on Market by Geography
    • Exhibit 05: Executive Summary – Chart on Market Segmentation by Type
    • Exhibit 06: Executive Summary – Chart on Market Segmentation by Application
    • Exhibit 07: Executive Summary – Chart on Incremental Growth
    • Exhibit 08: Executive Summary – Data Table on Incremental Growth
    • Exhibit 09: Executive Summary – Chart on Vendor Market Positioning

2 Market Landscape

  • 2.1 Market ecosystem
    • Exhibit 10: Parent market
    • Exhibit 11: Market Characteristics

3 Market Sizing

  • 3.1 Market definition
    • Exhibit 12: Offerings of vendors included in the market definition
  • 3.2 Market segment analysis
    • Exhibit 13: Market segments
  • 3.3 Market size 2023
    • 3.4 Market outlook: Forecast for 2023-2028
      • Exhibit 14: Chart on Global - Market size and forecast 2023-2028 ($ million)
      • Exhibit 15: Data Table on Global - Market size and forecast 2023-2028 ($ million)
      • Exhibit 16: Chart on Global Market: Year-over-year growth 2023-2028 (%)
      • Exhibit 17: Data Table on Global Market: Year-over-year growth 2023-2028 (%)

    4 Historic Market Size

    • 4.1 Global NBR foam products market 2018 - 2022
      • Exhibit 18: Historic Market Size – Data Table on global nbr foam products market 2018 - 2022 ($ million)
    • 4.2 Type Segment Analysis 2018 - 2022
      • Exhibit 19: Historic Market Size – Type Segment 2018 - 2022 ($ million)
    • 4.3 Application Segment Analysis 2018 - 2022
      • Exhibit 20: Historic Market Size – Application Segment 2018 - 2022 ($ million)
    • 4.4 Geography Segment Analysis 2018 - 2022
      • Exhibit 21: Historic Market Size – Geography Segment 2018 - 2022 ($ million)
    • 4.5 Country Segment Analysis 2018 - 2022
      • Exhibit 22: Historic Market Size – Country Segment 2018 - 2022 ($ million)

    5 Five Forces Analysis

    • 5.1 Five forces summary
      • Exhibit 23: Five forces analysis - Comparison between 2023 and 2028
    • 5.2 Bargaining power of buyers
      • Exhibit 24: Chart on Bargaining power of buyers – Impact of key factors 2023 and 2028
    • 5.3 Bargaining power of suppliers
      • Exhibit 25: Bargaining power of suppliers – Impact of key factors in 2023 and 2028
    • 5.4 Threat of new entrants
      • Exhibit 26: Threat of new entrants – Impact of key factors in 2023 and 2028
    • 5.5 Threat of substitutes
      • Exhibit 27: Threat of substitutes – Impact of key factors in 2023 and 2028
    • 5.6 Threat of rivalry
      • Exhibit 28: Threat of rivalry – Impact of key factors in 2023 and 2028
    • 5.7 Market condition
      • Exhibit 29: Chart on Market condition - Five forces 2023 and 2028

    6 Market Segmentation by Type

    • 6.1 Market segments
      • Exhibit 30: Chart on Type - Market share 2023-2028 (%)
      • Exhibit 31: Data Table on Type - Market share 2023-2028 (%)
    • 6.2 Comparison by Type
      • Exhibit 32: Chart on Comparison by Type
      • Exhibit 33: Data Table on Comparison by Type
    • 6.3 Close cell rubber - Market size and forecast 2023-2028
      • Exhibit 34: Chart on Close cell rubber - Market size and forecast 2023-2028 ($ million)
      • Exhibit 35: Data Table on Close cell rubber - Market size and forecast 2023-2028 ($ million)
      • Exhibit 36: Chart on Close cell rubber - Year-over-year growth 2023-2028 (%)
      • Exhibit 37: Data Table on Close cell rubber - Year-over-year growth 2023-2028 (%)
    • 6.4 Semi-closed cell rubber - Market size and forecast 2023-2028
      • Exhibit 38: Chart on Semi-closed cell rubber - Market size and forecast 2023-2028 ($ million)
      • Exhibit 39: Data Table on Semi-closed cell rubber - Market size and forecast 2023-2028 ($ million)
      • Exhibit 40: Chart on Semi-closed cell rubber - Year-over-year growth 2023-2028 (%)
      • Exhibit 41: Data Table on Semi-closed cell rubber - Year-over-year growth 2023-2028 (%)
    • 6.5 Market opportunity by Type
      • Exhibit 42: Market opportunity by Type ($ million)
      • Exhibit 43: Data Table on Market opportunity by Type ($ million)

    7 Market Segmentation by Application

    • 7.1 Market segments
      • Exhibit 44: Chart on Application - Market share 2023-2028 (%)
      • Exhibit 45: Data Table on Application - Market share 2023-2028 (%)
    • 7.2 Comparison by Application
      • Exhibit 46: Chart on Comparison by Application
      • Exhibit 47: Data Table on Comparison by Application
    • 7.3 HVAC - Market size and forecast 2023-2028
      • Exhibit 48: Chart on HVAC - Market size and forecast 2023-2028 ($ million)
      • Exhibit 49: Data Table on HVAC - Market size and forecast 2023-2028 ($ million)
      • Exhibit 50: Chart on HVAC - Year-over-year growth 2023-2028 (%)
      • Exhibit 51: Data Table on HVAC - Year-over-year growth 2023-2028 (%)
    • 7.4 Automotive - Market size and forecast 2023-2028
      • Exhibit 52: Chart on Automotive - Market size and forecast 2023-2028 ($ million)
      • Exhibit 53: Data Table on Automotive - Market size and forecast 2023-2028 ($ million)
      • Exhibit 54: Chart on Automotive - Year-over-year growth 2023-2028 (%)
      • Exhibit 55: Data Table on Automotive - Year-over-year growth 2023-2028 (%)
    • 7.5 Electrical and electronics - Market size and forecast 2023-2028
      • Exhibit 56: Chart on Electrical and electronics - Market size and forecast 2023-2028 ($ million)
      • Exhibit 57: Data Table on Electrical and electronics - Market size and forecast 2023-2028 ($ million)
      • Exhibit 58: Chart on Electrical and electronics - Year-over-year growth 2023-2028 (%)
      • Exhibit 59: Data Table on Electrical and electronics - Year-over-year growth 2023-2028 (%)
    • 7.6 Construction - Market size and forecast 2023-2028
      • Exhibit 60: Chart on Construction - Market size and forecast 2023-2028 ($ million)
      • Exhibit 61: Data Table on Construction - Market size and forecast 2023-2028 ($ million)
      • Exhibit 62: Chart on Construction - Year-over-year growth 2023-2028 (%)
      • Exhibit 63: Data Table on Construction - Year-over-year growth 2023-2028 (%)
    • 7.7 Others - Market size and forecast 2023-2028
      • Exhibit 64: Chart on Others - Market size and forecast 2023-2028 ($ million)
      • Exhibit 65: Data Table on Others - Market size and forecast 2023-2028 ($ million)
      • Exhibit 66: Chart on Others - Year-over-year growth 2023-2028 (%)
      • Exhibit 67: Data Table on Others - Year-over-year growth 2023-2028 (%)
    • 7.8 Market opportunity by Application
      • Exhibit 68: Market opportunity by Application ($ million)
      • Exhibit 69: Data Table on Market opportunity by Application ($ million)

    8 Customer Landscape

    • 8.1 Customer landscape overview
      • Exhibit 70: Analysis of price sensitivity, lifecycle, customer purchase basket, adoption rates, and purchase criteria

    9 Geographic Landscape

    • 9.1 Geographic segmentation
      • Exhibit 71: Chart on Market share by geography 2023-2028 (%)
      • Exhibit 72: Data Table on Market share by geography 2023-2028 (%)
    • 9.2 Geographic comparison
      • Exhibit 73: Chart on Geographic comparison
      • Exhibit 74: Data Table on Geographic comparison
    • 9.3 APAC - Market size and forecast 2023-2028
      • Exhibit 75: Chart on APAC - Market size and forecast 2023-2028 ($ million)
      • Exhibit 76: Data Table on APAC - Market size and forecast 2023-2028 ($ million)
      • Exhibit 77: Chart on APAC - Year-over-year growth 2023-2028 (%)
      • Exhibit 78: Data Table on APAC - Year-over-year growth 2023-2028 (%)
    • 9.4 North America - Market size and forecast 2023-2028
      • Exhibit 79: Chart on North America - Market size and forecast 2023-2028 ($ million)
      • Exhibit 80: Data Table on North America - Market size and forecast 2023-2028 ($ million)
      • Exhibit 81: Chart on North America - Year-over-year growth 2023-2028 (%)
      • Exhibit 82: Data Table on North America - Year-over-year growth 2023-2028 (%)
    • 9.5 Europe - Market size and forecast 2023-2028
      • Exhibit 83: Chart on Europe - Market size and forecast 2023-2028 ($ million)
      • Exhibit 84: Data Table on Europe - Market size and forecast 2023-2028 ($ million)
      • Exhibit 85: Chart on Europe - Year-over-year growth 2023-2028 (%)
      • Exhibit 86: Data Table on Europe - Year-over-year growth 2023-2028 (%)
    • 9.6 Middle East and Africa - Market size and forecast 2023-2028
      • Exhibit 87: Chart on Middle East and Africa - Market size and forecast 2023-2028 ($ million)
      • Exhibit 88: Data Table on Middle East and Africa - Market size and forecast 2023-2028 ($ million)
      • Exhibit 89: Chart on Middle East and Africa - Year-over-year growth 2023-2028 (%)
      • Exhibit 90: Data Table on Middle East and Africa - Year-over-year growth 2023-2028 (%)
    • 9.7 South America - Market size and forecast 2023-2028
      • Exhibit 91: Chart on South America - Market size and forecast 2023-2028 ($ million)
      • Exhibit 92: Data Table on South America - Market size and forecast 2023-2028 ($ million)
      • Exhibit 93: Chart on South America - Year-over-year growth 2023-2028 (%)
      • Exhibit 94: Data Table on South America - Year-over-year growth 2023-2028 (%)
    • 9.8 China - Market size and forecast 2023-2028
      • Exhibit 95: Chart on China - Market size and forecast 2023-2028 ($ million)
      • Exhibit 96: Data Table on China - Market size and forecast 2023-2028 ($ million)
      • Exhibit 97: Chart on China - Year-over-year growth 2023-2028 (%)
      • Exhibit 98: Data Table on China - Year-over-year growth 2023-2028 (%)
    • 9.9 US - Market size and forecast 2023-2028
      • Exhibit 99: Chart on US - Market size and forecast 2023-2028 ($ million)
      • Exhibit 100: Data Table on US - Market size and forecast 2023-2028 ($ million)
      • Exhibit 101: Chart on US - Year-over-year growth 2023-2028 (%)
      • Exhibit 102: Data Table on US - Year-over-year growth 2023-2028 (%)
    • 9.10 Germany - Market size and forecast 2023-2028
      • Exhibit 103: Chart on Germany - Market size and forecast 2023-2028 ($ million)
      • Exhibit 104: Data Table on Germany - Market size and forecast 2023-2028 ($ million)
      • Exhibit 105: Chart on Germany - Year-over-year growth 2023-2028 (%)
      • Exhibit 106: Data Table on Germany - Year-over-year growth 2023-2028 (%)
    • 9.11 UK - Market size and forecast 2023-2028
      • Exhibit 107: Chart on UK - Market size and forecast 2023-2028 ($ million)
      • Exhibit 108: Data Table on UK - Market size and forecast 2023-2028 ($ million)
      • Exhibit 109: Chart on UK - Year-over-year growth 2023-2028 (%)
      • Exhibit 110: Data Table on UK - Year-over-year growth 2023-2028 (%)
    • 9.12 Japan - Market size and forecast 2023-2028
      • Exhibit 111: Chart on Japan - Market size and forecast 2023-2028 ($ million)
      • Exhibit 112: Data Table on Japan - Market size and forecast 2023-2028 ($ million)
      • Exhibit 113: Chart on Japan - Year-over-year growth 2023-2028 (%)
      • Exhibit 114: Data Table on Japan - Year-over-year growth 2023-2028 (%)
    • 9.13 Market opportunity by geography
      • Exhibit 115: Market opportunity by geography ($ million)
      • Exhibit 116: Data Tables on Market opportunity by geography ($ million)

    10 Drivers, Challenges, and Trends

    • 10.1 Market drivers
      • 10.2 Market challenges
        • 10.3 Impact of drivers and challenges
          • Exhibit 117: Impact of drivers and challenges in 2023 and 2028
        • 10.4 Market trends

          11 Vendor Landscape

          • 11.1 Overview
            • 11.2 Vendor landscape
              • Exhibit 118: Overview on Criticality of inputs and Factors of differentiation
            • 11.3 Landscape disruption
              • Exhibit 119: Overview on factors of disruption
            • 11.4 Industry risks
              • Exhibit 120: Impact of key risks on business

            12 Vendor Analysis

            • 12.1 Vendors covered
              • Exhibit 121: Vendors covered
            • 12.2 Market positioning of vendors
              • Exhibit 122: Matrix on vendor position and classification
            • 12.3 ARLANXEO Holding BV
              • Exhibit 123: ARLANXEO Holding BV - Overview
              • Exhibit 124: ARLANXEO Holding BV - Product / Service
              • Exhibit 125: ARLANXEO Holding BV - Key offerings
            • 12.4 Armacell International SA
              • Exhibit 126: Armacell International SA - Overview
              • Exhibit 127: Armacell International SA - Business segments
              • Exhibit 128: Armacell International SA - Key news
              • Exhibit 129: Armacell International SA - Key offerings
              • Exhibit 130: Armacell International SA - Segment focus
            • 12.5 CGR Products
              • Exhibit 131: CGR Products - Overview
              • Exhibit 132: CGR Products - Product / Service
              • Exhibit 133: CGR Products - Key offerings
            • 12.6 Clockpress Ltd.
              • Exhibit 134: Clockpress Ltd. - Overview
              • Exhibit 135: Clockpress Ltd. - Product / Service
              • Exhibit 136: Clockpress Ltd. - Key offerings
            • 12.7 Compagnie de Saint Gobain
              • Exhibit 137: Compagnie de Saint Gobain - Overview
              • Exhibit 138: Compagnie de Saint Gobain - Business segments
              • Exhibit 139: Compagnie de Saint Gobain - Key news
              • Exhibit 140: Compagnie de Saint Gobain - Key offerings
              • Exhibit 141: Compagnie de Saint Gobain - Segment focus
            • 12.8 Fostek Corp.
              • Exhibit 142: Fostek Corp. - Overview
              • Exhibit 143: Fostek Corp. - Product / Service
              • Exhibit 144: Fostek Corp. - Key offerings
            • 12.9 Global Glove and Safety Manufacturing Inc.
              • Exhibit 145: Global Glove and Safety Manufacturing Inc. - Overview
              • Exhibit 146: Global Glove and Safety Manufacturing Inc. - Product / Service
              • Exhibit 147: Global Glove and Safety Manufacturing Inc. - Key offerings
            • 12.10 Hira Industries LLC
              • Exhibit 148: Hira Industries LLC - Overview
              • Exhibit 149: Hira Industries LLC - Product / Service
              • Exhibit 150: Hira Industries LLC - Key offerings
            • 12.11 Huntsman International LLC
              • Exhibit 151: Huntsman International LLC - Overview
              • Exhibit 152: Huntsman International LLC - Business segments
              • Exhibit 153: Huntsman International LLC - Key news
              • Exhibit 154: Huntsman International LLC - Key offerings
              • Exhibit 155: Huntsman International LLC - Segment focus
            • 12.12 Macro International
              • Exhibit 156: Macro International - Overview
              • Exhibit 157: Macro International - Product / Service
              • Exhibit 158: Macro International - Key offerings
            • 12.13 Ridderflex and Plastics B.V.
              • Exhibit 159: Ridderflex and Plastics B.V. - Overview
              • Exhibit 160: Ridderflex and Plastics B.V. - Product / Service
              • Exhibit 161: Ridderflex and Plastics B.V. - Key offerings
            • 12.14 Rogers Corp.
              • Exhibit 162: Rogers Corp. - Overview
              • Exhibit 163: Rogers Corp. - Business segments
              • Exhibit 164: Rogers Corp. - Key offerings
              • Exhibit 165: Rogers Corp. - Segment focus
            • 12.15 Superlon Holdings Berhad
              • Exhibit 166: Superlon Holdings Berhad - Overview
              • Exhibit 167: Superlon Holdings Berhad - Product / Service
              • Exhibit 168: Superlon Holdings Berhad - Key offerings
            • 12.16 Trelleborg AB
              • Exhibit 169: Trelleborg AB - Overview
              • Exhibit 170: Trelleborg AB - Business segments
              • Exhibit 171: Trelleborg AB - Key news
              • Exhibit 172: Trelleborg AB - Key offerings
              • Exhibit 173: Trelleborg AB - Segment focus
            • 12.17 W. KOPP GmbH and Co. KG
              • Exhibit 174: W. KOPP GmbH and Co. KG - Overview
              • Exhibit 175: W. KOPP GmbH and Co. KG - Product / Service
              • Exhibit 176: W. KOPP GmbH and Co. KG - Key offerings

            13 Appendix

            • 13.1 Scope of the report
              • 13.2 Inclusions and exclusions checklist
                • Exhibit 177: Inclusions checklist
                • Exhibit 178: Exclusions checklist
              • 13.3 Currency conversion rates for US$
                • Exhibit 179: Currency conversion rates for US$
              • 13.4 Research methodology
                • Exhibit 180: Research methodology
                • Exhibit 181: Validation techniques employed for market sizing
                • Exhibit 182: Information sources
              • 13.5 List of abbreviations
                • Exhibit 183: List of abbreviations

                Research Methodology

                Technavio presents a detailed picture of the market by way of study, synthesis, and summation of data from multiple sources. The analysts have presented the various facets of the market with a particular focus on identifying the key industry influencers. The data thus presented is comprehensive, reliable, and the result of extensive research, both primary and secondary.

                INFORMATION SOURCES

                Primary sources

                • Manufacturers and suppliers
                • Channel partners
                • Industry experts
                • Strategic decision makers

                Secondary sources

                • Industry journals and periodicals
                • Government data
                • Financial reports of key industry players
                • Historical data
                • Press releases

                DATA ANALYSIS

                Data Synthesis

                • Collation of data
                • Estimation of key figures
                • Analysis of derived insights

                Data Validation

                • Triangulation with data models
                • Reference against proprietary databases
                • Corroboration with industry experts

                REPORT WRITING

                Qualitative

                • Market drivers
                • Market challenges
                • Market trends
                • Five forces analysis

                Quantitative

                • Market size and forecast
                • Market segmentation
                • Geographical insights
                • Competitive landscape

                Interested in this report?

                Get your sample now to see our research methodology and insights!

                Download Now

                Frequently Asked Questions

                NBR Foam Products market growth will increase by $ 61.51 mn during 2024-2028.

                The NBR Foam Products market is expected to grow at a CAGR of 4.74% during 2024-2028.

                NBR Foam Products market is segmented by Type( Close cell rubber, Semi-closed cell rubber) Application( HVAC, Automotive, Electrical and electronics, Construction, Others)

                Adhesive Specialities, ALP Group, ARLANXEO Holding BV, Armacell International SA, CGR Products, Clockpress Ltd., Compagnie de Saint Gobain, Fostek Corp., Global Glove and Safety Manufacturing Inc., Hira Industries LLC, Huamei Energy saving Technology Group Co. Ltd., Huntsman International LLC, Macro International, Polymax Ltd., Ridderflex and Plastics B.V., Rogers Corp., Rubber World Industries LLC, Superlon Holdings Berhad, Trelleborg AB, W. KOPP GmbH and Co. KG are a few of the key vendors in the NBR Foam Products market.

                APAC will register the highest growth rate of 47% among the other regions. Therefore, the NBR Foam Products market in APAC is expected to garner significant business opportunities for the vendors during the forecast period.

                US, China, Japan, Germany, UK

                • Increasing use of NBR foam in HVAC systemsNBR foam is known for its excellent thermal insulation capabilities. In HVAC systems is the driving factor this market.
                • where temperature control is critical for energy efficiency and occupant comfort is the driving factor this market.
                • NBR foam is used to insulate pipes is the driving factor this market.
                • ducts is the driving factor this market.
                • and other components to minimize heat transfer. With a heightened focus on energy efficiency in buildings is the driving factor this market.
                • HVAC systems are designed to optimize energy consumption. NBR foam helps prevent thermal losses is the driving factor this market.
                • ensuring that heated or cooled air is effectively delivered to spaces without unnecessary energy waste. The closed-cell structure of NBR foam makes it an effective barrier against the infiltration of air and moisture. This is crucial in HVAC applications to maintain the integrity of insulation and prevent energy losses due to air leakage. NBR foam possesses vibration-damping properties is the driving factor this market.
                • making it useful in reducing vibrations and noise generated by HVAC equipment. This is particularly important in residential and commercial buildings where noise reduction is a key consideration. HVAC systems often have complex configurations is the driving factor this market.
                • including bends and curves in pipes and ducts. The flexibility of NBR foam allows it to conform to these intricate shapes is the driving factor this market.
                • facilitating easy installation and providing continuous insulation coverage. HVAC systems can experience condensation is the driving factor this market.
                • and NBR foam's resistance to moisture helps prevent issues such as mold growth and material degradation. This contributes to the longevity and effectiveness of the insulation. NBR foam is durable and requires minimal maintenance is the driving factor this market.
                • making it a reliable choice for HVAC insulation. Its longevity reduces the need for frequent replacements is the driving factor this market.
                • lowering overall maintenance costs. Building codes and standards often mandate the use of energy-efficient materials in HVAC systems. NBR foam is the driving factor this market.
                • with its insulation properties is the driving factor this market.
                • helps buildings comply with these regulations is the driving factor this market.
                • driving its adoption in construction projects. Moreover is the driving factor this market.
                • NBR foam is considered a cost-effective insulation solution. Its initial affordability is the driving factor this market.
                • coupled with its long-term energy-saving benefits is the driving factor this market.
                • makes it an attractive choice for HVAC insulation applications in both residential and commercial settings. Thus is the driving factor this market.
                • the increasing use of NBR foam in HVAC systems will boost the growth of the global NBR foam products market during the forecast period. is the driving factor this market.

                The NBR Foam Products market vendors should focus on grabbing business opportunities from the Close cell rubber segment as it accounted for the largest market share in the base year.