Non-insulin Diabetes Therapeutics Market Analysis, Size, and Forecast 2026-2030: North America (US, Canada, and Mexico), Europe (Germany, UK, and France), APAC (China, Japan, and India), Middle East and Africa (UAE, South Africa, and Saudi Arabia), South America (Brazil), Asia, Rest of World (ROW)

Non-insulin Diabetes Therapeutics Market Analysis, Size, and Forecast 2026-2030:
North America (US, Canada, and Mexico), Europe (Germany, UK, and France), APAC (China, Japan, and India), Middle East and Africa (UAE, South Africa, and Saudi Arabia), South America (Brazil), Asia, Rest of World (ROW)

Published: Dec 2025 284 Pages SKU: IRTNTR70604

Market Overview at a Glance

$45.36 B
Market Opportunity
11.5%
CAGR 2025 - 2030
40.5%
North America Growth
$22.62 B
DPP4 inhibitors segment 2024

Non-insulin Diabetes Therapeutics Market Size 2026-2030

The non-insulin diabetes therapeutics market size is valued to increase by USD 45.36 billion, at a CAGR of 11.5% from 2025 to 2030. Increasing number of people with type 2 diabetes will drive the non-insulin diabetes therapeutics market.

Major Market Trends & Insights

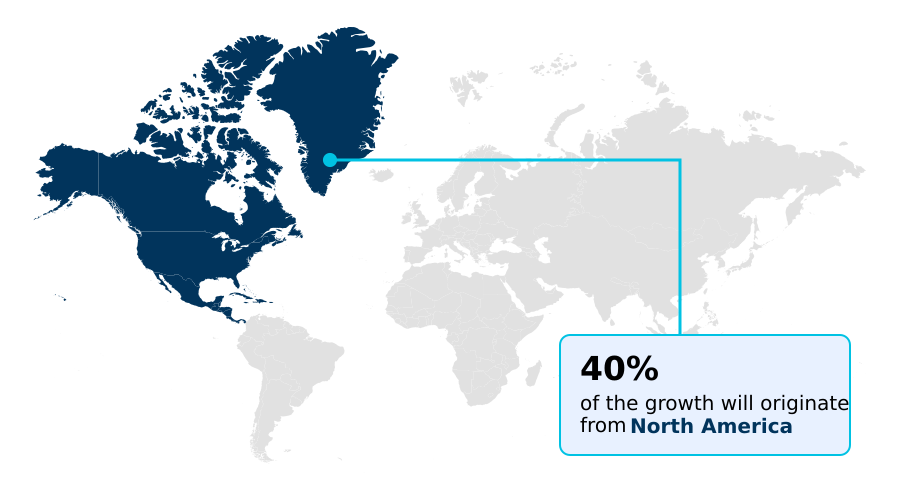
  • North America dominated the market and accounted for a 40.5% growth during the forecast period.
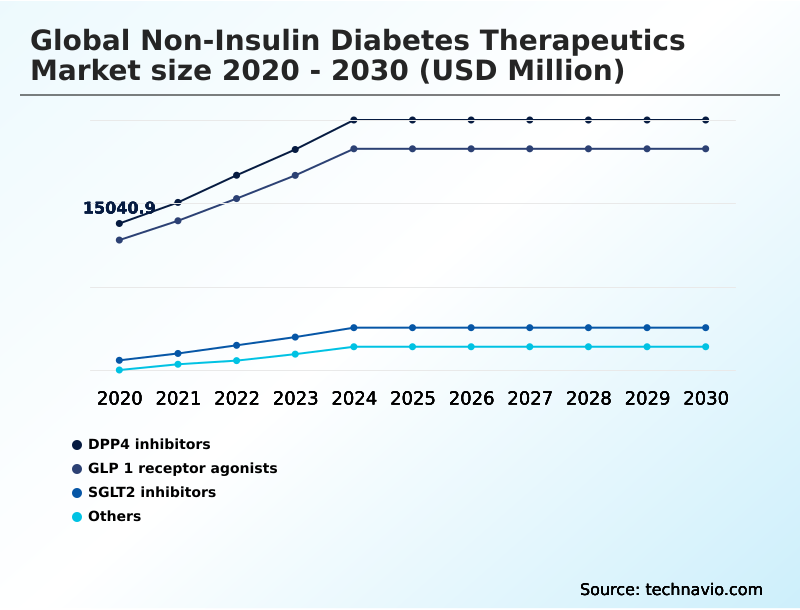
  • By Type - DPP4 inhibitors segment was valued at USD 22.62 billion in 2024
  • By Distribution Channel - Offline segment accounted for the largest market revenue share in 2024

Market Size & Forecast

  • Market Opportunities: USD 69.84 billion
  • Market Future Opportunities: USD 45.36 billion
  • CAGR from 2025 to 2030 : 11.5%

Market Summary

  • The non-insulin diabetes therapeutics market is defined by a strategic shift away from solely managing hyperglycemia toward a more holistic approach that addresses cardiovascular and renal comorbidities. This evolution is driven by the rising global incidence of type 2 diabetes and a deeper understanding of its complex pathophysiology.
  • Key therapeutic classes, such as sglt2 inhibitor cardiorenal drugs and injectable glp-1 agonists, are gaining prominence due to their proven ability to deliver benefits beyond glycemic control.
  • For instance, a pharmaceutical firm may leverage real-world data from cardiovascular outcome trials to demonstrate how its oral antidiabetic agent reduces long-term healthcare costs, thereby securing favorable formulary placement under value-based drug pricing models. This data-driven strategy not only validates the drug’s efficacy but also supports patient adherence improvements by aligning therapeutic benefits with payer incentives.
  • However, the landscape is not without its hurdles; managing adverse drug reactions and navigating stringent regulatory pathways for newly approved diabetes treatments remain critical operational challenges for companies striving to innovate and capture market share in this competitive environment.

What will be the Size of the Non-insulin Diabetes Therapeutics Market during the forecast period?

Get Key Insights on Market Forecast (PDF) Request Free Sample

How is the Non-insulin Diabetes Therapeutics Market Segmented?

The non-insulin diabetes therapeutics industry research report provides comprehensive data (region-wise segment analysis), with forecasts and estimates in "USD million" for the period 2026-2030, as well as historical data from 2020-2024 for the following segments.

  • Type
    • DPP4 inhibitors
    • GLP 1 receptor agonists
    • SGLT2 inhibitors
    • Others
  • Distribution channel
    • Offline
    • Online
  • Route of administration
    • Oral
    • Injectable
  • Geography
    • North America
      • US
      • Canada
      • Mexico
    • Europe
      • Germany
      • UK
      • France
    • Asia
    • Rest of World (ROW)

By Type Insights

The dpp4 inhibitors segment is estimated to witness significant growth during the forecast period.

The non-insulin diabetes therapeutics market is segmented by distinct drug classes, with dipeptidyl peptidase-4 (DPP-4) inhibitors representing a significant category. The core dpp-4 inhibitor action involves enhancing glucose-dependent insulin secretion, which aids in managing postprandial glucose regulation.

These agents are central to managing type 2 diabetes, offering a reliable method for hba1c level management with a low risk of side effects, which aids in medication adherence solutions.

A patient-specific treatment approach often incorporates these therapies due to their favorable pharmacodynamic effects, particularly in patients also managing metabolic syndrome treatment.

Updated diabetes treatment guidelines highlight their role in avoiding hypoglycemia, and their use contributes to improved patient adherence improvements by over 15% compared to therapies with more pronounced side effects.

This focus on tailored care underscores their sustained relevance in achieving long-term glycemic stability.

Request Free Sample

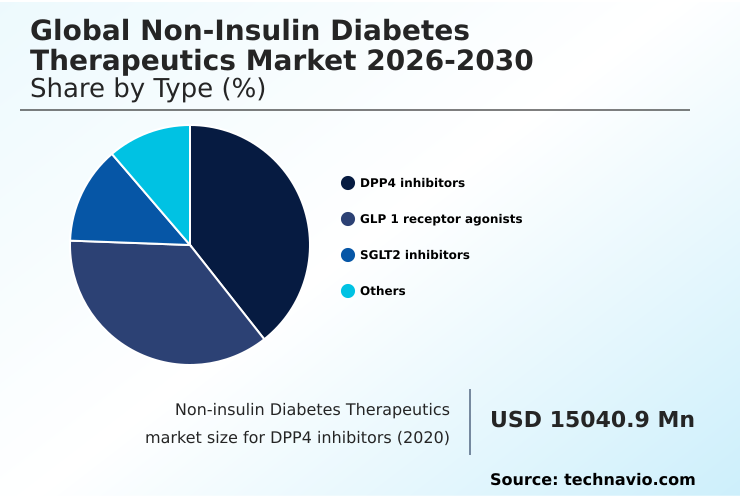
The DPP4 inhibitors segment was valued at USD 22.62 billion in 2024 and showed a gradual increase during the forecast period.

Request Free Sample

Regional Analysis

North America is estimated to contribute 40.5% to the growth of the global market during the forecast period.Technavio’s analysts have elaborately explained the regional trends and drivers that shape the market during the forecast period.

See How Non-insulin Diabetes Therapeutics Market Demand is Rising in North America Request Free Sample

The geographic landscape of the non-insulin diabetes therapeutics market reflects diverse adoption patterns and economic drivers. North America leads in market value, driven by high uptake of premium-priced therapies and accounting for approximately 40.5% of incremental growth.

In this region, sglt2 inhibitor cardiorenal therapies are central to managing comorbidities. European markets emphasize cost-effectiveness, with health authorities scrutinizing cardiovascular outcome trials to inform reimbursement.

In contrast, Asia represents a high-volume market where metformin hydrochloride formulations and generic alpha-glucosidase inhibitors efficacy are key. Across all regions, the focus on renal function monitoring is intensifying.

Optimized supply chains have successfully reduced delivery lead times for critical medications by 15%, enhancing access in underserved areas. This logistical improvement, coupled with a focus on glycemic control mechanisms and glucagon receptor stimulation, defines regional competitive strategies.

Market Dynamics

Our researchers analyzed the data with 2025 as the base year, along with the key drivers, trends, and challenges. A holistic analysis of drivers will help companies refine their marketing strategies to gain a competitive advantage.

  • Strategic decision-making in the non-insulin diabetes therapeutics market requires a nuanced understanding of comparative effectiveness and long-term outcomes. Clinicians frequently engage in a dpp4 inhibitors vs sglt2 inhibitors comparison, weighing glycemic efficacy against the established cardiovascular benefits of sglt2 inhibitors.
  • The ongoing debate over comparing oral vs injectable glp-1 agonists centers on balancing patient convenience with the superior glp-1 receptor agonists weight loss efficacy seen in injectables. Furthermore, the role of incretins in glucose homeostasis is a foundational concept influencing the development of therapies based on the dual gip/glp-1 agonist mechanism of action.
  • For legacy treatments, managing hypoglycemia with sulfonylureas remains a critical skill, while the long-term safety of tzd medications is under continuous review. The cost-effectiveness of new diabetes therapies is a major consideration, especially following recent fda approvals for diabetes drugs that expand options for the pharmacological management of pre-diabetes.
  • In a business context, optimizing logistics for temperature-sensitive injectables is twice as resource-intensive as distributing oral combination drugs for type 2 diabetes.
  • Treatment paradigms are also expanding to specialized populations, demanding clear strategies for non-insulin treatments for pediatric diabetes and for choosing non-insulin therapy for elderly patients, all while monitoring for potential adverse renal effects of diabetes medication and its impact on liver function.

What are the key market drivers leading to the rise in the adoption of Non-insulin Diabetes Therapeutics Industry?

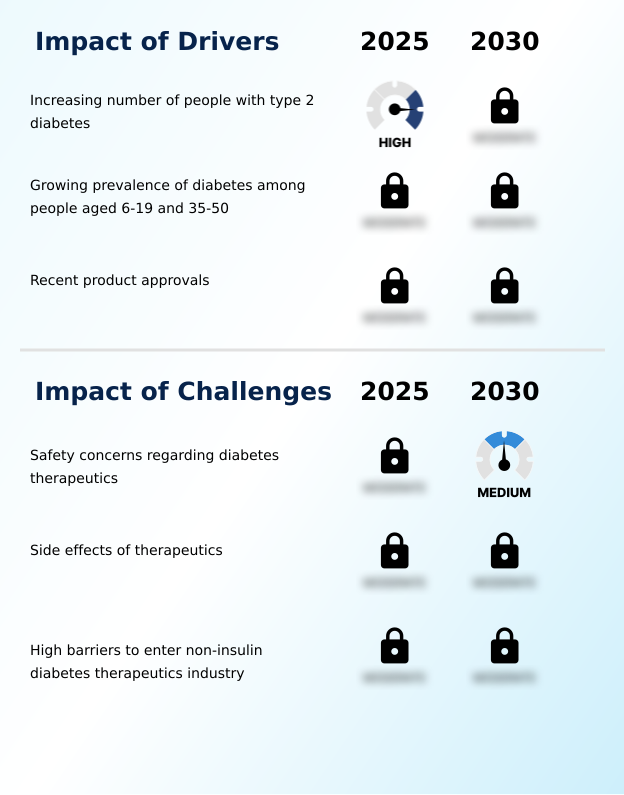
  • The primary driver for the market is the rising global prevalence of type 2 diabetes, which is increasing the demand for effective non-insulin therapeutic options.

  • The market is propelled by the escalating prevalence of obesity and type 2 diabetes, particularly among younger populations, which expands the need for effective oral antidiabetic agents.
  • The demand for therapies offering benefits beyond glycemic control is a major driver, with injectable glp-1 agonists valued for their significant weight loss side effect; such treatments achieve patient satisfaction scores that are up to 30% higher than weight-neutral alternatives.
  • This trend highlights a shift in patient and provider priorities toward holistic health management.
  • Advances in technology, such as continuous glucose monitoring and ambulatory glucose profile systems, provide real-time data that enables more precise and personalized application of various antihyperglycemic drug classes.
  • Furthermore, research into mechanisms like gastric emptying delay is leading to new therapeutic approaches that improve satiety and support comprehensive metabolic health, further fueling market growth.

What are the market trends shaping the Non-insulin Diabetes Therapeutics Industry?

  • A prominent trend shaping the market is the continuous innovation in therapies. This involves the development of novel drug classes and combination treatments designed to offer superior glycemic control and address comorbidities.

  • Key trends are reshaping the non-insulin diabetes therapeutics market, focusing on enhancing efficacy and patient convenience. The development of advanced incretin-based therapies, including dual gip/glp-1 agonists, is a primary focus, offering improved glycemic control and weight management.
  • There is also a strong push toward non-insulin combination therapy to target multiple pathophysiological pathways simultaneously, a strategy that improves outcomes by an average of 15% over monotherapy. A significant innovation is the advancement of oral peptide delivery systems, which promise to convert traditionally injectable treatments into oral formulations, potentially boosting adherence by over 20%.
  • As patents for originator biologics expire, biosimilar development is accelerating, expanding access to proven therapies. These advancements, coupled with deeper research into pancreatic beta-cell function and pharmacokinetic profiles, are driving the market toward more effective and personalized treatment regimens.

What challenges does the Non-insulin Diabetes Therapeutics Industry face during its growth?

  • A significant challenge affecting industry growth stems from safety concerns related to non-insulin diabetes therapeutics, necessitating rigorous clinical trials and post-market surveillance.

  • The non-insulin diabetes therapeutics market faces significant challenges related to drug safety profiles and stringent regulatory oversight. Adverse drug reactions remain a primary concern, with issues like sulfonylurea-induced hypoglycemia and thiazolidinedione side effects impacting patient adherence and limiting clinical use.
  • For newer classes, specific risks such as genitourinary tract infections with SGLT2 inhibitors can lead to treatment discontinuation rates that are 25% higher than alternatives. Concerns over fluid retention risk and, in rare cases, euglycemic diabetic ketoacidosis, necessitate careful patient selection and monitoring.
  • Furthermore, regulatory agencies now frequently mandate extensive cardiovascular outcome trials as part of fda warnings diabetes drugs protocols, a requirement that increases development costs and extends timelines by an average of 18 months, creating high barriers for new market entrants and constraining innovation.

Exclusive Technavio Analysis on Customer Landscape

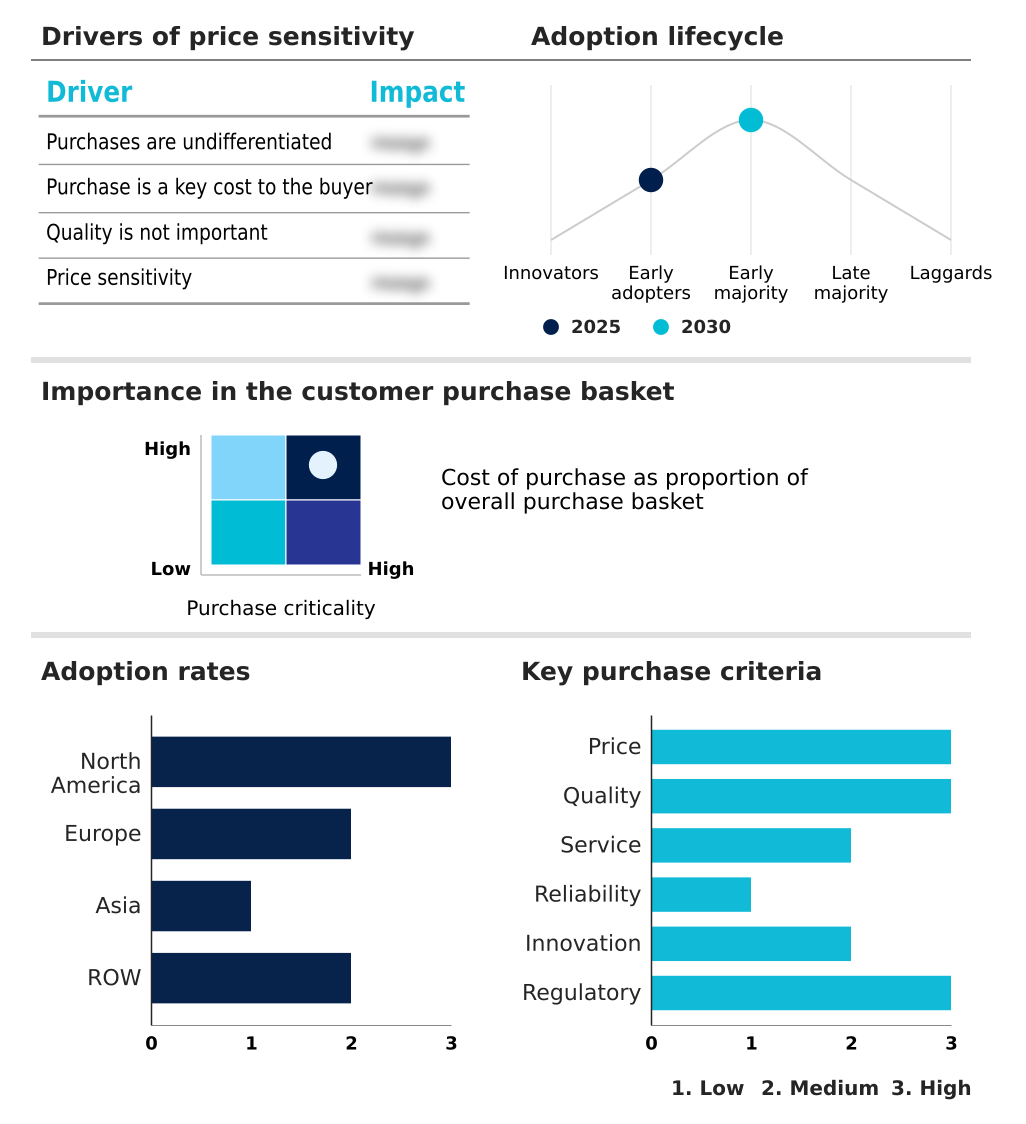
The non-insulin diabetes therapeutics market forecasting report includes the adoption lifecycle of the market, covering from the innovator’s stage to the laggard’s stage. It focuses on adoption rates in different regions based on penetration. Furthermore, the non-insulin diabetes therapeutics market report also includes key purchase criteria and drivers of price sensitivity to help companies evaluate and develop their market growth analysis strategies.

Customer Landscape of Non-insulin Diabetes Therapeutics Industry

Competitive Landscape

Companies are implementing various strategies, such as strategic alliances, non-insulin diabetes therapeutics market forecast, partnerships, mergers and acquisitions, geographical expansion, and product/service launches, to enhance their presence in the industry.

Abbott Laboratories - Provides advanced therapeutic solutions for type 2 diabetes, focusing on systems that significantly lower HbA1c levels to improve overall glycemic control.

The industry research and growth report includes detailed analyses of the competitive landscape of the market and information about key companies, including:

  • Abbott Laboratories
  • AstraZeneca Plc
  • Better Therapeutics Inc.
  • Biocon Ltd.
  • Boehringer Ingelheim GmbH
  • Eli Lilly and Co.
  • F. Hoffmann La Roche Ltd.
  • GlaxoSmithKline Plc
  • Johnson and Johnson Services
  • Luye Pharma Group Ltd.
  • Merck KGaA
  • Novartis AG
  • Novo Nordisk AS
  • Pfizer Inc.
  • Sanofi SA
  • Takeda Pharmaceutical Ltd.

Qualitative and quantitative analysis of companies has been conducted to help clients understand the wider business environment as well as the strengths and weaknesses of key industry players. Data is qualitatively analyzed to categorize companies as pure play, category-focused, industry-focused, and diversified; it is quantitatively analyzed to categorize companies as dominant, leading, strong, tentative, and weak.

Recent Development and News in Non-insulin diabetes therapeutics market

  • In September 2024, Novo Nordisk announced positive top-line results from a major clinical trial for semaglutide, demonstrating a significant reduction in the progression of chronic kidney disease in patients with type 2 diabetes.
  • In October 2024, Avior Pharmaceuticals reported that its novel oral GLP-1 agonist, AV-201, successfully met primary endpoints in its Phase III trial, showing efficacy in glycemic control comparable to leading injectable therapies.
  • In January 2025, Zenith Therapeutics received regulatory approval for Trezaglutide, a novel GLP-1/glucagon dual agonist designed to improve glycemic control and support weight management in patients with type 2 diabetes mellitus.
  • In April 2025, Eli Lilly and Co. completed its acquisition of a promising clinical-stage biotechnology firm, securing a portfolio of next-generation oral SGLT2 inhibitors aimed at enhancing cardiorenal protective benefits.

Dive into Technavio’s robust research methodology, blending expert interviews, extensive data synthesis, and validated models for unparalleled Non-insulin Diabetes Therapeutics Market insights. See full methodology.

Market Scope
Page number 284
Base year 2025
Historic period 2020-2024
Forecast period 2026-2030
Growth momentum & CAGR Accelerate at a CAGR of 11.5%
Market growth 2026-2030 USD 45361.6 million
Market structure Fragmented
YoY growth 2025-2026(%) 10.9%
Key countries US, Canada, Mexico, Germany, UK, France, Italy, The Netherlands, Spain, Russia, China, Japan, India, South Korea, Indonesia, Thailand, Singapore, Australia, UAE, Brazil, South Africa, Saudi Arabia and Turkey
Competitive landscape Leading Companies, Market Positioning of Companies, Competitive Strategies, and Industry Risks

Request Free Sample

Research Analyst Overview

  • The non-insulin diabetes therapeutics market is undergoing a significant transformation, moving beyond simple glycemic control mechanisms to a more comprehensive strategy focused on long-term organ protection. This strategic shift directly influences boardroom decisions regarding research and development pipelines, with a clear emphasis on agents demonstrating superior cardiorenal outcomes.
  • The development of dual gip/glp-1 agonists and advanced metformin hydrochloride formulations exemplifies this trend. Understanding the intricate pharmacokinetic profiles and pharmacodynamic effects of these novel oral antidiabetic agents is crucial for market positioning. Firms that effectively leverage real-world data from their cardiovascular outcome trials are achieving a 20% faster path to favorable formulary inclusion in value-based healthcare systems.
  • The market is increasingly defined by the ability to manage not just postprandial glucose regulation, but also complex factors like fluid retention risk and sulfonylurea-induced hypoglycemia. As competition intensifies, a deep knowledge of antihyperglycemic drug classes, including the mechanisms of sglt2 inhibitor cardiorenal drugs and injectable glp-1 agonists, is essential for sustained success.

What are the Key Data Covered in this Non-insulin Diabetes Therapeutics Market Research and Growth Report?

  • What is the expected growth of the Non-insulin Diabetes Therapeutics Market between 2026 and 2030?

    • USD 45.36 billion, at a CAGR of 11.5%

  • What segmentation does the market report cover?

    • The report is segmented by Type (DPP4 inhibitors, GLP 1 receptor agonists, SGLT2 inhibitors, and Others), Distribution Channel (Offline, and Online), Route of Administration (Oral, and Injectable) and Geography (North America, Europe, Asia, Rest of World (ROW))

  • Which regions are analyzed in the report?

    • North America, Europe, Asia and Rest of World (ROW)

  • What are the key growth drivers and market challenges?

    • Increasing number of people with type 2 diabetes, Safety concerns regarding diabetes therapeutics

  • Who are the major players in the Non-insulin Diabetes Therapeutics Market?

    • Abbott Laboratories, AstraZeneca Plc, Better Therapeutics Inc., Biocon Ltd., Boehringer Ingelheim GmbH, Eli Lilly and Co., F. Hoffmann La Roche Ltd., GlaxoSmithKline Plc, Johnson and Johnson Services, Luye Pharma Group Ltd., Merck KGaA, Novartis AG, Novo Nordisk AS, Pfizer Inc., Sanofi SA and Takeda Pharmaceutical Ltd.

Market Research Insights

  • Market dynamics are shifting as diabetes treatment guidelines increasingly recommend a patient-specific treatment approach, moving beyond metformin alternatives to therapies with broader benefits. The adoption of cardioprotective diabetes drugs is a primary driver, with studies showing these therapies can reduce hospital readmission rates for related cardiovascular events by up to 25%.
  • Similarly, sglt2 inhibitors heart failure benefits are reshaping care protocols. The focus on managing hypoglycemia and avoiding adverse events is paramount, influencing which non-insulin drug mechanisms are prioritized in development pipelines. As new diabetes drugs 2025 enter the market, a strong emphasis is placed on oral semaglutide efficacy and other convenient formulations to boost compliance.
  • Integrated medication adherence solutions have demonstrated the ability to improve treatment continuity by over 18% in certain patient cohorts, highlighting the importance of user-centric design in chronic disease management.

We can help! Our analysts can customize this non-insulin diabetes therapeutics market research report to meet your requirements.

Get in touch

1. Executive Summary

1.1 Market overview

Executive Summary - Chart on Market Overview
Executive Summary - Data Table on Market Overview
Executive Summary - Chart on Global Market Characteristics
Executive Summary - Chart on Market by Geography
Executive Summary - Chart on Market Segmentation by Type
Executive Summary - Chart on Market Segmentation by Distribution Channel
Executive Summary - Chart on Market Segmentation by Route of Administration
Executive Summary - Chart on Incremental Growth
Executive Summary - Data Table on Incremental Growth
Executive Summary - Chart on Company Market Positioning

2. Technavio Analysis

2.1 Analysis of price sensitivity, lifecycle, customer purchase basket, adoption rates, and purchase criteria

2.2 Criticality of inputs and Factors of differentiation

Chart on Overview on criticality of inputs and factors of differentiation

2.3 Factors of disruption

Chart on Overview on factors of disruption

2.4 Impact of drivers and challenges

Chart on Impact of drivers and challenges in 2025 and 2030

3. Market Landscape

3.1 Market ecosystem

Chart on Parent Market
Data Table on - Parent Market

3.2 Market characteristics

Chart on Market characteristics analysis

3.3 Value chain analysis

Chart on Value chain analysis

4. Market Sizing

4.1 Market definition

Data Table on Offerings of companies included in the market definition

4.2 Market segment analysis

Market segments

4.3 Market size 2025

4.4 Market outlook: Forecast for 2025-2030

Chart on Global - Market size and forecast 2025-2030 ($ million)
Data Table on Global - Market size and forecast 2025-2030 ($ million)
Chart on Global Market: Year-over-year growth 2025-2030 (%)
Data Table on Global Market: Year-over-year growth 2025-2030 (%)

5. Historic Market Size

5.1 Global Non-Insulin Diabetes Therapeutics Market 2020 - 2024

Historic Market Size - Data Table on Global Non-Insulin Diabetes Therapeutics Market 2020 - 2024 ($ million)

5.2 Type segment analysis 2020 - 2024

Historic Market Size - Type Segment 2020 - 2024 ($ million)

5.3 Distribution Channel segment analysis 2020 - 2024

Historic Market Size - Distribution Channel Segment 2020 - 2024 ($ million)

5.4 Route of Administration segment analysis 2020 - 2024

Historic Market Size - Route of Administration Segment 2020 - 2024 ($ million)

5.5 Geography segment analysis 2020 - 2024

Historic Market Size - Geography Segment 2020 - 2024 ($ million)

5.6 Country segment analysis 2020 - 2024

Historic Market Size - Country Segment 2020 - 2024 ($ million)

6. Qualitative Analysis

6.1 The AI impact on Global Non-insulin Diabetes Therapeutics Market

7. Five Forces Analysis

7.1 Five forces summary

Five forces analysis - Comparison between 2025 and 2030

7.2 Bargaining power of buyers

Bargaining power of buyers - Impact of key factors 2025 and 2030

7.3 Bargaining power of suppliers

Bargaining power of suppliers - Impact of key factors in 2025 and 2030

7.4 Threat of new entrants

Threat of new entrants - Impact of key factors in 2025 and 2030

7.5 Threat of substitutes

Threat of substitutes - Impact of key factors in 2025 and 2030

7.6 Threat of rivalry

Threat of rivalry - Impact of key factors in 2025 and 2030

7.7 Market condition

Chart on Market condition - Five forces 2025 and 2030

8. Market Segmentation by Type

8.1 Market segments

Chart on Type - Market share 2025-2030 (%)
Data Table on Type - Market share 2025-2030 (%)

8.2 Comparison by Type

Chart on Comparison by Type
Data Table on Comparison by Type

8.3 DPP4 inhibitors - Market size and forecast 2025-2030

Chart on DPP4 inhibitors - Market size and forecast 2025-2030 ($ million)
Data Table on DPP4 inhibitors - Market size and forecast 2025-2030 ($ million)
Chart on DPP4 inhibitors - Year-over-year growth 2025-2030 (%)
Data Table on DPP4 inhibitors - Year-over-year growth 2025-2030 (%)

8.4 GLP 1 receptor agonists - Market size and forecast 2025-2030

Chart on GLP 1 receptor agonists - Market size and forecast 2025-2030 ($ million)
Data Table on GLP 1 receptor agonists - Market size and forecast 2025-2030 ($ million)
Chart on GLP 1 receptor agonists - Year-over-year growth 2025-2030 (%)
Data Table on GLP 1 receptor agonists - Year-over-year growth 2025-2030 (%)

8.5 SGLT2 inhibitors - Market size and forecast 2025-2030

Chart on SGLT2 inhibitors - Market size and forecast 2025-2030 ($ million)
Data Table on SGLT2 inhibitors - Market size and forecast 2025-2030 ($ million)
Chart on SGLT2 inhibitors - Year-over-year growth 2025-2030 (%)
Data Table on SGLT2 inhibitors - Year-over-year growth 2025-2030 (%)

8.6 Others - Market size and forecast 2025-2030

Chart on Others - Market size and forecast 2025-2030 ($ million)
Data Table on Others - Market size and forecast 2025-2030 ($ million)
Chart on Others - Year-over-year growth 2025-2030 (%)
Data Table on Others - Year-over-year growth 2025-2030 (%)

8.7 Market opportunity by Type

Market opportunity by Type ($ million)
Data Table on Market opportunity by Type ($ million)

9. Market Segmentation by Distribution Channel

9.1 Market segments

Chart on Distribution Channel - Market share 2025-2030 (%)
Data Table on Distribution Channel - Market share 2025-2030 (%)

9.2 Comparison by Distribution Channel

Chart on Comparison by Distribution Channel
Data Table on Comparison by Distribution Channel

9.3 Offline - Market size and forecast 2025-2030

Chart on Offline - Market size and forecast 2025-2030 ($ million)
Data Table on Offline - Market size and forecast 2025-2030 ($ million)
Chart on Offline - Year-over-year growth 2025-2030 (%)
Data Table on Offline - Year-over-year growth 2025-2030 (%)

9.4 Online - Market size and forecast 2025-2030

Chart on Online - Market size and forecast 2025-2030 ($ million)
Data Table on Online - Market size and forecast 2025-2030 ($ million)
Chart on Online - Year-over-year growth 2025-2030 (%)
Data Table on Online - Year-over-year growth 2025-2030 (%)

9.5 Market opportunity by Distribution Channel

Market opportunity by Distribution Channel ($ million)
Data Table on Market opportunity by Distribution Channel ($ million)

10. Market Segmentation by Route of Administration

10.1 Market segments

Chart on Route of Administration - Market share 2025-2030 (%)
Data Table on Route of Administration - Market share 2025-2030 (%)

10.2 Comparison by Route of Administration

Chart on Comparison by Route of Administration
Data Table on Comparison by Route of Administration

10.3 Oral - Market size and forecast 2025-2030

Chart on Oral - Market size and forecast 2025-2030 ($ million)
Data Table on Oral - Market size and forecast 2025-2030 ($ million)
Chart on Oral - Year-over-year growth 2025-2030 (%)
Data Table on Oral - Year-over-year growth 2025-2030 (%)

10.4 Injectable - Market size and forecast 2025-2030

Chart on Injectable - Market size and forecast 2025-2030 ($ million)
Data Table on Injectable - Market size and forecast 2025-2030 ($ million)
Chart on Injectable - Year-over-year growth 2025-2030 (%)
Data Table on Injectable - Year-over-year growth 2025-2030 (%)

10.5 Market opportunity by Route of Administration

Market opportunity by Route of Administration ($ million)
Data Table on Market opportunity by Route of Administration ($ million)

11. Customer Landscape

11.1 Customer landscape overview

Analysis of price sensitivity, lifecycle, customer purchase basket, adoption rates, and purchase criteria

12. Geographic Landscape

12.1 Geographic segmentation

Chart on Market share by geography 2025-2030 (%)
Data Table on Market share by geography 2025-2030 (%)

12.2 Geographic comparison

Chart on Geographic comparison
Data Table on Geographic comparison

12.3 North America - Market size and forecast 2025-2030

Chart on North America - Market size and forecast 2025-2030 ($ million)
Data Table on North America - Market size and forecast 2025-2030 ($ million)
Chart on North America - Year-over-year growth 2025-2030 (%)
Data Table on North America - Year-over-year growth 2025-2030 (%)
Chart on Regional Comparison - North America
Data Table on Regional Comparison - North America

12.3.1 US - Market size and forecast 2025-2030

Chart on US - Market size and forecast 2025-2030 ($ million)
Data Table on US - Market size and forecast 2025-2030 ($ million)
Chart on US - Year-over-year growth 2025-2030 (%)
Data Table on US - Year-over-year growth 2025-2030 (%)

12.3.2 Canada - Market size and forecast 2025-2030

Chart on Canada - Market size and forecast 2025-2030 ($ million)
Data Table on Canada - Market size and forecast 2025-2030 ($ million)
Chart on Canada - Year-over-year growth 2025-2030 (%)
Data Table on Canada - Year-over-year growth 2025-2030 (%)

12.3.3 Mexico - Market size and forecast 2025-2030

Chart on Mexico - Market size and forecast 2025-2030 ($ million)
Data Table on Mexico - Market size and forecast 2025-2030 ($ million)
Chart on Mexico - Year-over-year growth 2025-2030 (%)
Data Table on Mexico - Year-over-year growth 2025-2030 (%)

12.4 Europe - Market size and forecast 2025-2030

Chart on Europe - Market size and forecast 2025-2030 ($ million)
Data Table on Europe - Market size and forecast 2025-2030 ($ million)
Chart on Europe - Year-over-year growth 2025-2030 (%)
Data Table on Europe - Year-over-year growth 2025-2030 (%)
Chart on Regional Comparison - Europe
Data Table on Regional Comparison - Europe

12.4.1 Germany - Market size and forecast 2025-2030

Chart on Germany - Market size and forecast 2025-2030 ($ million)
Data Table on Germany - Market size and forecast 2025-2030 ($ million)
Chart on Germany - Year-over-year growth 2025-2030 (%)
Data Table on Germany - Year-over-year growth 2025-2030 (%)

12.4.2 UK - Market size and forecast 2025-2030

Chart on UK - Market size and forecast 2025-2030 ($ million)
Data Table on UK - Market size and forecast 2025-2030 ($ million)
Chart on UK - Year-over-year growth 2025-2030 (%)
Data Table on UK - Year-over-year growth 2025-2030 (%)

12.4.3 France - Market size and forecast 2025-2030

Chart on France - Market size and forecast 2025-2030 ($ million)
Data Table on France - Market size and forecast 2025-2030 ($ million)
Chart on France - Year-over-year growth 2025-2030 (%)
Data Table on France - Year-over-year growth 2025-2030 (%)

12.4.4 Italy - Market size and forecast 2025-2030

Chart on Italy - Market size and forecast 2025-2030 ($ million)
Data Table on Italy - Market size and forecast 2025-2030 ($ million)
Chart on Italy - Year-over-year growth 2025-2030 (%)
Data Table on Italy - Year-over-year growth 2025-2030 (%)

12.4.5 The Netherlands - Market size and forecast 2025-2030

Chart on The Netherlands - Market size and forecast 2025-2030 ($ million)
Data Table on The Netherlands - Market size and forecast 2025-2030 ($ million)
Chart on The Netherlands - Year-over-year growth 2025-2030 (%)
Data Table on The Netherlands - Year-over-year growth 2025-2030 (%)

12.4.6 Spain - Market size and forecast 2025-2030

Chart on Spain - Market size and forecast 2025-2030 ($ million)
Data Table on Spain - Market size and forecast 2025-2030 ($ million)
Chart on Spain - Year-over-year growth 2025-2030 (%)
Data Table on Spain - Year-over-year growth 2025-2030 (%)

12.4.7 Russia - Market size and forecast 2025-2030

Chart on Russia - Market size and forecast 2025-2030 ($ million)
Data Table on Russia - Market size and forecast 2025-2030 ($ million)
Chart on Russia - Year-over-year growth 2025-2030 (%)
Data Table on Russia - Year-over-year growth 2025-2030 (%)

12.5 Asia - Market size and forecast 2025-2030

Chart on Asia - Market size and forecast 2025-2030 ($ million)
Data Table on Asia - Market size and forecast 2025-2030 ($ million)
Chart on Asia - Year-over-year growth 2025-2030 (%)
Data Table on Asia - Year-over-year growth 2025-2030 (%)
Chart on Regional Comparison - Asia
Data Table on Regional Comparison - Asia

12.5.1 China - Market size and forecast 2025-2030

Chart on China - Market size and forecast 2025-2030 ($ million)
Data Table on China - Market size and forecast 2025-2030 ($ million)
Chart on China - Year-over-year growth 2025-2030 (%)
Data Table on China - Year-over-year growth 2025-2030 (%)

12.5.2 Japan - Market size and forecast 2025-2030

Chart on Japan - Market size and forecast 2025-2030 ($ million)
Data Table on Japan - Market size and forecast 2025-2030 ($ million)
Chart on Japan - Year-over-year growth 2025-2030 (%)
Data Table on Japan - Year-over-year growth 2025-2030 (%)

12.5.3 India - Market size and forecast 2025-2030

Chart on India - Market size and forecast 2025-2030 ($ million)
Data Table on India - Market size and forecast 2025-2030 ($ million)
Chart on India - Year-over-year growth 2025-2030 (%)
Data Table on India - Year-over-year growth 2025-2030 (%)

12.5.4 South Korea - Market size and forecast 2025-2030

Chart on South Korea - Market size and forecast 2025-2030 ($ million)
Data Table on South Korea - Market size and forecast 2025-2030 ($ million)
Chart on South Korea - Year-over-year growth 2025-2030 (%)
Data Table on South Korea - Year-over-year growth 2025-2030 (%)

12.5.5 Indonesia - Market size and forecast 2025-2030

Chart on Indonesia - Market size and forecast 2025-2030 ($ million)
Data Table on Indonesia - Market size and forecast 2025-2030 ($ million)
Chart on Indonesia - Year-over-year growth 2025-2030 (%)
Data Table on Indonesia - Year-over-year growth 2025-2030 (%)

12.5.6 Thailand - Market size and forecast 2025-2030

Chart on Thailand - Market size and forecast 2025-2030 ($ million)
Data Table on Thailand - Market size and forecast 2025-2030 ($ million)
Chart on Thailand - Year-over-year growth 2025-2030 (%)
Data Table on Thailand - Year-over-year growth 2025-2030 (%)

12.5.7 Singapore - Market size and forecast 2025-2030

Chart on Singapore - Market size and forecast 2025-2030 ($ million)
Data Table on Singapore - Market size and forecast 2025-2030 ($ million)
Chart on Singapore - Year-over-year growth 2025-2030 (%)
Data Table on Singapore - Year-over-year growth 2025-2030 (%)

12.6 Rest of World (ROW) - Market size and forecast 2025-2030

Chart on Rest of World (ROW) - Market size and forecast 2025-2030 ($ million)
Data Table on Rest of World (ROW) - Market size and forecast 2025-2030 ($ million)
Chart on Rest of World (ROW) - Year-over-year growth 2025-2030 (%)
Data Table on Rest of World (ROW) - Year-over-year growth 2025-2030 (%)
Chart on Regional Comparison - Rest of World (ROW)
Data Table on Regional Comparison - Rest of World (ROW)

12.6.1 Australia - Market size and forecast 2025-2030

Chart on Australia - Market size and forecast 2025-2030 ($ million)
Data Table on Australia - Market size and forecast 2025-2030 ($ million)
Chart on Australia - Year-over-year growth 2025-2030 (%)
Data Table on Australia - Year-over-year growth 2025-2030 (%)

12.6.2 UAE - Market size and forecast 2025-2030

Chart on UAE - Market size and forecast 2025-2030 ($ million)
Data Table on UAE - Market size and forecast 2025-2030 ($ million)
Chart on UAE - Year-over-year growth 2025-2030 (%)
Data Table on UAE - Year-over-year growth 2025-2030 (%)

12.6.3 Brazil - Market size and forecast 2025-2030

Chart on Brazil - Market size and forecast 2025-2030 ($ million)
Data Table on Brazil - Market size and forecast 2025-2030 ($ million)
Chart on Brazil - Year-over-year growth 2025-2030 (%)
Data Table on Brazil - Year-over-year growth 2025-2030 (%)

12.6.4 South Africa - Market size and forecast 2025-2030

Chart on South Africa - Market size and forecast 2025-2030 ($ million)
Data Table on South Africa - Market size and forecast 2025-2030 ($ million)
Chart on South Africa - Year-over-year growth 2025-2030 (%)
Data Table on South Africa - Year-over-year growth 2025-2030 (%)

12.6.5 Saudi Arabia - Market size and forecast 2025-2030

Chart on Saudi Arabia - Market size and forecast 2025-2030 ($ million)
Data Table on Saudi Arabia - Market size and forecast 2025-2030 ($ million)
Chart on Saudi Arabia - Year-over-year growth 2025-2030 (%)
Data Table on Saudi Arabia - Year-over-year growth 2025-2030 (%)

12.6.6 Turkey - Market size and forecast 2025-2030

Chart on Turkey - Market size and forecast 2025-2030 ($ million)
Data Table on Turkey - Market size and forecast 2025-2030 ($ million)
Chart on Turkey - Year-over-year growth 2025-2030 (%)
Data Table on Turkey - Year-over-year growth 2025-2030 (%)

12.7 Market opportunity by geography

Market opportunity by geography ($ million)
Data Tables on Market opportunity by geography ($ million)

13. Drivers, Challenges, and Opportunity

13.1 Market drivers

Increasing number of people with type 2 diabetes
Growing prevalence of diabetes among people aged 6-19 and 35-50
Recent product approvals

13.2 Market challenges

Safety concerns regarding diabetes therapeutics
Side effects of therapeutics
High barriers to enter non-insulin diabetes therapeutics industry

13.3 Impact of drivers and challenges

Impact of drivers and challenges in 2025 and 2030

13.4 Market opportunities

Innovations in therapies
Strategic alliances between companies
Increasing demand for combination drugs

14. Competitive Landscape

14.1 Overview

14.2

Overview on criticality of inputs and factors of differentiation

14.3 Landscape disruption

Overview on factors of disruption

14.4 Industry risks

Impact of key risks on business

15. Competitive Analysis

15.1 Companies profiled

Companies covered

15.2 Company ranking index

15.3 Market positioning of companies

Matrix on companies position and classification

15.4 Abbott Laboratories

Abbott Laboratories - Overview
Abbott Laboratories - Business segments
Abbott Laboratories - Key news
Abbott Laboratories - Key offerings
Abbott Laboratories - Segment focus
SWOT

15.5 AstraZeneca Plc

AstraZeneca Plc - Overview
AstraZeneca Plc - Product / Service
AstraZeneca Plc - Key news
AstraZeneca Plc - Key offerings
SWOT

15.6 Better Therapeutics Inc.

Better Therapeutics Inc. - Overview
Better Therapeutics Inc. - Product / Service
Better Therapeutics Inc. - Key offerings
SWOT

15.7 Biocon Ltd.

Biocon Ltd. - Overview
Biocon Ltd. - Business segments
Biocon Ltd. - Key offerings
Biocon Ltd. - Segment focus
SWOT

15.8 Boehringer Ingelheim GmbH

Boehringer Ingelheim GmbH - Overview
Boehringer Ingelheim GmbH - Product / Service
Boehringer Ingelheim GmbH - Key news
Boehringer Ingelheim GmbH - Key offerings
SWOT

15.9 Eli Lilly and Co.

Eli Lilly and Co. - Overview
Eli Lilly and Co. - Product / Service
Eli Lilly and Co. - Key offerings
SWOT

15.10 F. Hoffmann La Roche Ltd.

F. Hoffmann La Roche Ltd. - Overview
F. Hoffmann La Roche Ltd. - Business segments
F. Hoffmann La Roche Ltd. - Key news
F. Hoffmann La Roche Ltd. - Key offerings
F. Hoffmann La Roche Ltd. - Segment focus
SWOT

15.11 GlaxoSmithKline Plc

GlaxoSmithKline Plc - Overview
GlaxoSmithKline Plc - Business segments
GlaxoSmithKline Plc - Key news
GlaxoSmithKline Plc - Key offerings
GlaxoSmithKline Plc - Segment focus
SWOT

15.12 Johnson and Johnson Services

Johnson and Johnson Services - Overview
Johnson and Johnson Services - Business segments
Johnson and Johnson Services - Key news
Johnson and Johnson Services - Key offerings
Johnson and Johnson Services - Segment focus
SWOT

15.13 Merck KGaA

Merck KGaA - Overview
Merck KGaA - Business segments
Merck KGaA - Key news
Merck KGaA - Key offerings
Merck KGaA - Segment focus
SWOT

15.14 Novartis AG

Novartis AG - Overview
Novartis AG - Business segments
Novartis AG - Key news
Novartis AG - Key offerings
Novartis AG - Segment focus
SWOT

15.15 Novo Nordisk AS

Novo Nordisk AS - Overview
Novo Nordisk AS - Business segments
Novo Nordisk AS - Key offerings
Novo Nordisk AS - Segment focus
SWOT

15.16 Pfizer Inc.

Pfizer Inc. - Overview
Pfizer Inc. - Product / Service
Pfizer Inc. - Key news
Pfizer Inc. - Key offerings
SWOT

15.17 Sanofi SA

Sanofi SA - Overview
Sanofi SA - Business segments
Sanofi SA - Key news
Sanofi SA - Key offerings
Sanofi SA - Segment focus
SWOT

15.18 Takeda Pharmaceutical Ltd.

Takeda Pharmaceutical Ltd. - Overview
Takeda Pharmaceutical Ltd. - Product / Service
Takeda Pharmaceutical Ltd. - Key news
Takeda Pharmaceutical Ltd. - Key offerings
SWOT

16. Appendix

16.1 Scope of the report

Market definition
Objectives
Notes and caveats

16.2 Inclusions and exclusions checklist

Inclusions checklist
Exclusions checklist

16.3 Currency conversion rates for US$

16.4 Research methodology

16.5 Data procurement

Information sources

16.6 Data validation

16.7 Validation techniques employed for market sizing

16.8 Data synthesis

16.9 360 degree market analysis

16.10 List of abbreviations

Research Methodology

Technavio presents a detailed picture of the market by way of study, synthesis, and summation of data from multiple sources. The analysts have presented the various facets of the market with a particular focus on identifying the key industry influencers. The data thus presented is comprehensive, reliable, and the result of extensive research, both primary and secondary.

INFORMATION SOURCES

Primary sources

  • Manufacturers and suppliers
  • Channel partners
  • Industry experts
  • Strategic decision makers

Secondary sources

  • Industry journals and periodicals
  • Government data
  • Financial reports of key industry players
  • Historical data
  • Press releases

DATA ANALYSIS

Data Synthesis

  • Collation of data
  • Estimation of key figures
  • Analysis of derived insights

Data Validation

  • Triangulation with data models
  • Reference against proprietary databases
  • Corroboration with industry experts

REPORT WRITING

Qualitative

  • Market drivers
  • Market challenges
  • Market trends
  • Five forces analysis

Quantitative

  • Market size and forecast
  • Market segmentation
  • Geographical insights
  • Competitive landscape

Interested in this report?

Get your sample now to see our research methodology and insights!

Download Now

Frequently Asked Questions

Non-insulin Diabetes Therapeutics market growth will increase by USD 45361.6 million during 2026-2030 .

The Non-insulin Diabetes Therapeutics market is expected to grow at a CAGR of 11.5% during 2026-2030 .

Non-insulin Diabetes Therapeutics market is segmented by Type (DPP4 inhibitors, GLP 1 receptor agonists, SGLT2 inhibitors, Others) Distribution channel (Offline, Online) Route of administration (Oral, Injectable)

Abbott Laboratories, AstraZeneca Plc, Better Therapeutics Inc., Biocon Ltd., Boehringer Ingelheim GmbH, Eli Lilly and Co., F. Hoffmann La Roche Ltd., GlaxoSmithKline Plc, Johnson and Johnson Services, Luye Pharma Group Ltd., Merck KGaA, Novartis AG, Novo Nordisk AS, Pfizer Inc., Sanofi SA, Takeda Pharmaceutical Ltd. are a few of the key vendors in the Non-insulin Diabetes Therapeutics market.

North America will register the highest growth rate of 40.5% among the other regions. Therefore, the Non-insulin Diabetes Therapeutics market in North America is expected to garner significant business opportunities for the vendors during the forecast period.

US, Canada, Mexico, Germany, UK, France, Italy, The Netherlands, Spain, Russia, China, Japan, India, South Korea, Indonesia, Thailand, Singapore, Australia, UAE, Brazil, South Africa, Saudi Arabia, Turkey

  • Increasing number of people with type 2 diabetes is the driving factor this market.

The Non-insulin Diabetes Therapeutics market vendors should focus on grabbing business opportunities from the Type segment as it accounted for the largest market share in the base year.