Global Nuclear Powered Naval Vessels Market Analysis North America, APAC, Europe, Middle East and Africa, South America - US, China, India, Russia, France - Size and Forecast 2024-2028

Global Nuclear Powered Naval Vessels Market Analysis North America, APAC, Europe, Middle East and Africa, South America - US, China, India, Russia, France - Size and Forecast 2024-2028

Published: Jan 2024 168 Pages SKU: IRTNTR44666

Market Overview at a Glance

$12.44 B
Market Opportunity
8%
CAGR
6.92
YoY growth 2023-2024(%)

Nuclear Powered Naval Vessels Market Size 2024-2028

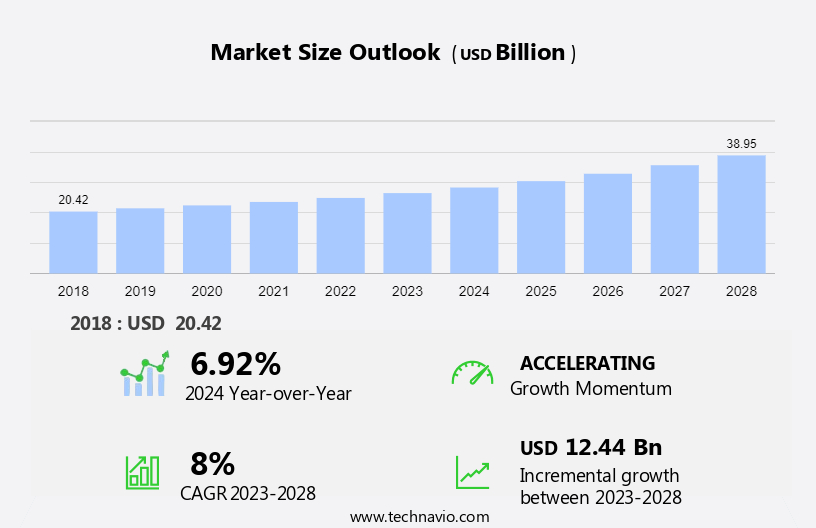
The nuclear powered naval vessels market size is forecast to increase by USD 12.44 billion at a CAGR of 8% between 2023 and 2028. The growth analysis of the market hinges on various factors, including the cost-effectiveness of nuclear power, the escalation in military spending, and efforts to enhance the stealth capabilities of submarines. These factors underscore the strategic investments and advancements in defense technologies aimed at achieving undetectability in naval operations. The cost-effectiveness of nuclear power plays a crucial role in shaping budget allocations and long-term defense strategies, influencing decisions on submarine capabilities and fleet modernization. As geopolitical tensions evolve, there is a heightened emphasis on enhancing submarine stealth to maintain tactical superiority and ensure national security. The synergy between these factors drives innovation and investment in submarine technologies, defining the competitive landscape and future prospects in naval defense markets worldwide.

Market Overview

Nuclear Powered Naval Vessels Market Size

Market Forecast 2024-2028

To learn more about this report,  Request Free Sample

Market Dynamics

The market is pivotal in modern defense strategies, driven by advancements in warships equipped with anti-submarine capabilities and sophisticated armament systems like rocket launchers and vertical missile launchers. These vessels play critical roles in surveillance and operations in strategic regions such as the Black Sea amidst geopolitical tensions and sanctions. Mainstay vessels include main battle warships and large destroyers, bolstering naval capabilities for both offensive and defensive maneuvers. The deployment of amphibious assault ships underscores flexibility in military operations, ensuring readiness for diverse mission scenarios. As nations like Ukraine enhance their naval defenses, the demand for nuclear-powered vessels rises, emphasizing their role in maintaining maritime superiority and safeguarding national interests in challenging environments. Our researchers studied the market research and growth data for years, with 2023 as the base year and 2024 as the estimated year, and presented the key drivers, trends, and challenges for the market.

Key Driver- Rising military spending

The geopolitical tensions between countries have contributed to a significant increase in military spending worldwide, which is also a significant driver for defense equipment manufacturers. In 2023, the military expenditure of countries such as India, China, France, Saudi Arabia, and the US accounted for a major part of the overall defense market. These countries are modernizing their sea-based defense systems and militaries, which has propelled the demand for defense products.

For instance, in 2023, military spending in the US was announced to be USD 816.7 billion. In the fiscal year 2023-2024, the military budget allocated by the Government of India was around USD 50 billion, which is 13% of the entire budget. Thus, the increase in defense and military spending is likely to augment the deployment of nuclear-powered naval vessels, thus driving the growth of the market during the forecast period.

Significant Trends- Indigenous development of nuclear-powered naval vessels

The development of a nuclear-powered naval vessel requires an efficient in-house technical team supported by exclusive technologies and domain expertise, along with large funding. Nowadays, the military equipment procurement pattern has evolved, and countries are now indigenously manufacturing nuclear-powered naval vessels. For instance, India's first nuclear-powered ballistic missile submarine, Arihant class, INS Arihant (S73), was built indigenously by the Indian Navy's Ship Building Centre in the port city of Visakhapatnam, India. INS Vindhyagiri, after its successful sea trials in February 2016, was confirmed and was commissioned in August 2023.

Furthermore, India domestically built its second nuclear-powered ballistic missile submarine, INS Aridhaman, at a fully enclosed dry dock at Vishakhapatnam. INS Aridhaman has one seven-blade propeller powered by a pressurized water reactor (PWR) and a maximum speed of 12-15 knots when on the surface and 24 knots when submerged. Such factors will boost the growth of the market during the forecast period.

Major Challenge- High cost and incorporation of AIP systems

The initial cost of construction of a nuclear-based propulsion system is twice the cost of other kinds of energy propulsion systems. Furthermore, the reactor requires specialist personnel to maintain and operate the nuclear plant, turbine, and generators, while diesel-electric generators and turbines require just a good motor mechanic. Additionally, air-independent propulsion (AIP) is a marine propulsion technology that allows non-nuclear submarines to operate without accessing atmospheric air/oxygen (by surfacing or using a snorkel). AIP can augment or replace both the diesel-electric propulsion system and the nuclear-powered naval vessels.

Moreover, the introduction of AIP has largely improved the underwater endurance of these submarines and has given them a distinct advantage. One of the main advantages of AIP technology is that it can be installed on existing generation submarines by inserting a new hull section during a retrofit. Therefore, navies across the globe are seen queuing up to buy or build submarines with AIP systems. Thus, such factors will impede market growth during the forecast period.

Market Segmentation by Product, Application, and Geography

Product Segment Analysis:

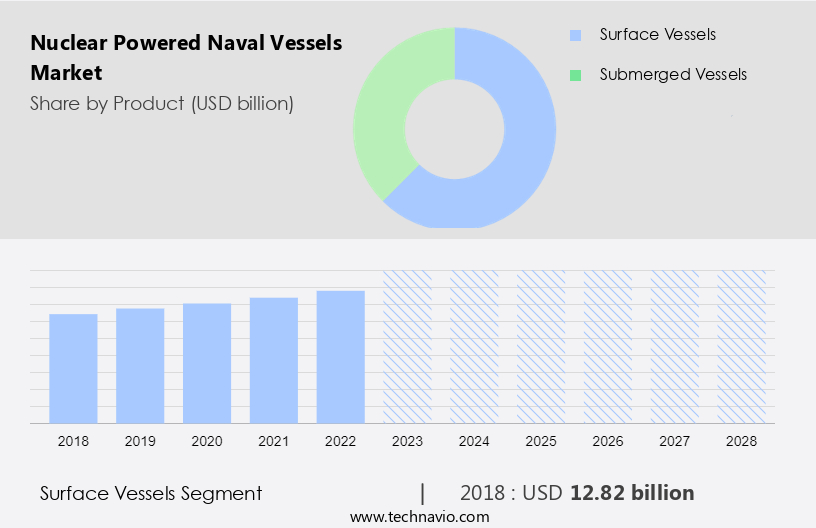
The surface vessels segment will account for a major share of the market's growth during the forecast period.?The surface vessels segment includes a variety of surface-based products, such as aircraft carriers, surface-based cruisers, surface-based destroyers, surface-based frigates, and more. Each surface vessel fulfills a unique purpose and reflects the changing strategic priorities and capacities of naval forces around the world. One of the main categories of surface vessels powered by nuclear is aircraft carriers, often referred to as the flagship of the naval fleet. These gigantic aircraft carriers act as mobile bases of operations, projecting power and power across vast sea areas.

Nuclear Powered Naval Vessels Market Size

Customised Report as per your requirements!

The surface vessels segment was valued at USD 12.82 billion in 2018. With the use of nuclear power, surface vessels can operate for extended periods of time without refueling, allowing for long-term and long-lasting deployments. For instance, aircraft carriers are powerful power projection platforms and mobile airbases that can carry and launch a wide variety of aircraft. Examples include the United States Navy's Gerald R. Ford class carrier and the Royal Navy's Queen Elizabeth-class carrier. These factors under the surface vessels segment will drive the growth of the market during the forecast period.

Application?Segment Analysis: 

Based on application, the market has been segmented into defense and transportation. The defense segment will account for the largest share of this segment.?Nuclear-powered naval vessels are used for a variety of defense applications. There are several different types of vessels in the market, such as aircraft carriers, nuclear-powered submarines, and surface combatants. Aircraft carriers are an essential part of naval defense because they can project power over vast distances. In addition, the defense segment is also characterized by constant technological innovation. The development of reactor designs, propulsion systems, and stealth technologies has enabled the development of more advanced and efficient vessels. Thus, such factors under the defense segment will drive the growth of the market during the forecast period.

Regional Analysis

Nuclear Powered Naval Vessels Market Share by Geography

For more insights on the market share of various regions Download Sample PDF now!

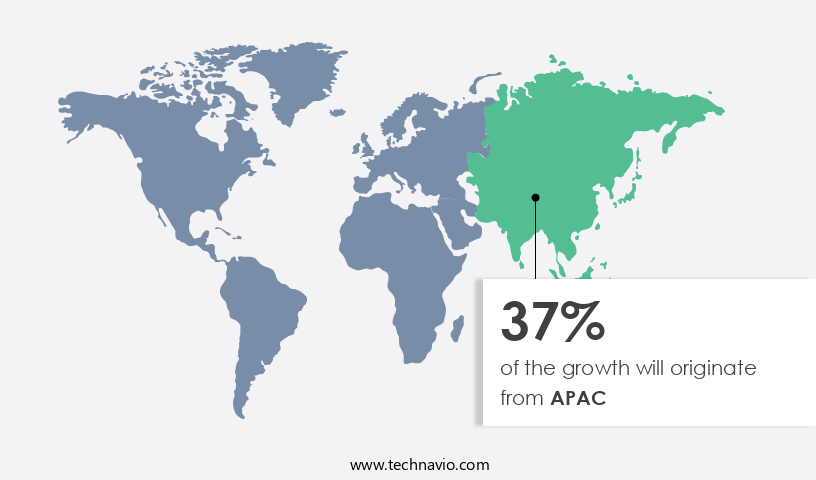
APAC is estimated to contribute 37% to the growth by 2028. Technavio's analysts have provided extensive insight into the market forecasting, detailing the regional trends and drivers influencing the market's trajectory throughout the forecast period. Another region offering significant growth opportunities to companies is North America. The high defense budget of the US is approximately 3.1% of the total country's budget in 2023 and makes it the leading region in the global market. The increasing spending from the defense department on the construction of nuclear-powered naval ships is likely to drive the growth of the market in the region. There are only three major naval forces (The US Navy, Royal Canadian Navy, and Mexican Navy) in North America, however, the US Nuclear Navy is one of the oldest and largest nuclear organizations in the world, Furthermore, the two primary reasons contributing to the adoption of nuclear-powered propulsion are the cost-benefit derived from the system and the time involved in replacing the core. Hence, such factors are expected to drive market growth in this region during the forecast period.  

Who are the Major Market Companies?

Companies are implementing various strategies, such as strategic alliances, partnerships, mergers and acquisitions, geographical expansion, and product/service launches, to enhance their presence in the market.

  • Austal Ltd.: The company offers nuclear-powered naval vessel components for US Navy Virginia class and Columbia class nuclear-powered submarine fleets.

We also have detailed analyses of the market’s competitive landscape and offer information on 20 market companies, including Babcock International Group Plc, BAE Systems Plc, Bechtel Corp., BWX Technologies Inc., Curtiss Wright Corp., General Dynamics Corp., Huntington Ingalls Industries Inc., Kongsberg Gruppen ASA, Lockheed Martin Corp., Naval Group, Northrop Grumman Corp., Rolls Royce Holdings Plc, and Thales Group 

Technavio market forecast the an in-depth analysis of the market and its players through combined qualitative and quantitative data. The analysis classifies companies into categories based on their business approaches, including pure-play, category-focused, industry-focused, and diversified. Companies are specially categorized into dominant, leading, strong, tentative, and weak, based on their quantitative data analysis.  

Segment Overview

The market research report provides comprehensive data (region wise segment analysis), with forecasts and estimates in "USD Billion" for the period 2024 to 2028, as well as historical data from 2018 to 2022 for the following segments.

  • Product Outlook
    • Surface vessels
    • Submerged vessels
  • Application Outlook 
    • Defense
    • Transportation
  • Region Outlook
    • North America
      • The U.S.
      • Canada
    • Europe
      • The U.K.
      • Germany
      • France
      • Rest of Europe
    • APAC
      • China
      • India
    • South America
      • Chile
      • Brazil
      • Argentina
    • Middle East & Africa
      • Saudi Arabia
      • South Africa
      • Rest of the Middle East & Africa

You may also interested in below market reports:

  • Naval Vessels Maintenance, Repair, and Overhaul (MRO) Market - Naval Vessels Maintenance, Repair, and Overhaul (MRO) Market Analysis North America, APAC, Europe, South America, Middle East and Africa - US, China, India, Russia, UK - Size and Forecast 
  • Submarine Market - Submarine Market Analysis North America, APAC, Europe, Middle East and Africa, South America - US, China, Russia, Japan, South Korea - Size and Forecast
  • Fuel Cells for Marine Vessels Market - Fuel Cells for Marine Vessels Market Analysis North America, APAC, Europe, Middle East and Africa, South America - US, China, Japan, Germany, UK - Size and Forecast 

Market Analyst Overview

The market is at the forefront of global defense strategies, encompassing large destroyers and amphibious assault ships designed for complex missions in regions like the Black Sea. As Western countries and the international community emphasize security, the defense industry and shipbuilding sectors innovate with advanced technologies including 3D printers for metal pipes, cylinders, and plates of varied shapes. These vessels feature integrated electric propulsion and may explore renewable energy sources like solar and wind power. Cutting-edge materials such as buckypaper enhance durability, while robotics revolutionize combat management and search and rescue operations. The market faces challenges such as high development costs but remains crucial with robust weapon launch, sensor, and communication systems for effective combat operations and maritime missions worldwide.

In addition, the market is pivotal in global defense, featuring large destroyers and amphibious assault ships crucial for operations in strategic areas like the Black Sea. These vessels utilize advanced metal plates tailored for curved & hilly shapes, enhancing durability and maneuverability. Innovations such as solar and wind-powered ships and materials like buckypaper address sustainability and resilience challenges despite high development costs. They integrate sophisticated sensor, weapon launch, and combat management systems to ensure operational readiness. The market also caters to diverse needs with corvettes, amphibious ships, and auxiliary vessels, offering flexibility in missions. With a focus on replacement parts and retrofit solutions for marine engine, control, and electrical systems, nuclear-powered vessels maintain their relevance in modern naval fleets, aligning with stringent defense requirements worldwide.

Market Scope

Report Coverage

Details

Page number

168

Base year

2023

Historic period

2018-2022

Forecast period

2024-2028

Growth momentum & CAGR

Accelerate at a CAGR of 8%

Market Growth 2024-2028

USD 12.44 billion

Market structure

Concentrated

YoY growth 2023-2024(%)

6.92

Regional analysis

North America, APAC, Europe, Middle East and Africa, and South America

Performing market contribution

APAC at 37%

Key countries

US, China, India, Russia, and France

Competitive landscape

Leading Companies, Market Positioning of Companies, Competitive Strategies, and Industry Risks

Key companies profiled

Austal Ltd., Babcock International Group Plc, BAE Systems Plc, Bechtel Corp., BWX Technologies Inc., Curtiss Wright Corp., General Dynamics Corp., Huntington Ingalls Industries Inc., Kongsberg Gruppen ASA, Lockheed Martin Corp., Naval Group, Northrop Grumman Corp., Rolls Royce Holdings Plc, and Thales Group

Market dynamics

Parent market growth analysis, Market growth inducers and obstacles, Fast-growing and slow-growing segment analysis, COVID-19 impact and recovery analysis and future consumer dynamics, and Market condition analysis for the forecast period.

Customization purview

If our market report has not included the data that you are looking for, you can reach out to our analysts and get segments customized.

Request Sample PDF 

What are the Key Data Covered in this Market Research Report?

  • CAGR of the market during the forecast period
  • Detailed information on factors that will drive the growth of the market between 2024 and 2028
  • Precise estimation of the market growth and trends and its contribution to the market in focus on the parent market
  • Accurate predictions about upcoming market trends and analysis and changes in consumer behavior
  • Market growth and forecasting across North America, APAC, Europe, Middle East and Africa, and South America
  • A thorough market analysis and report of the market’s competitive landscape and detailed information about companies
  • Comprehensive analysis of factors that will challenge the growth of market  companies

We can help! Our analysts can customize this market research report to meet your requirements. Get in touch

1 Executive Summary

  • 1.1 Market overview
    • Exhibit 01: Executive Summary – Chart on Market Overview
    • Exhibit 02: Executive Summary – Data Table on Market Overview
    • Exhibit 03: Executive Summary – Chart on Global Market Characteristics
    • Exhibit 04: Executive Summary – Chart on Market by Geography
    • Exhibit 05: Executive Summary – Chart on Market Segmentation by Product
    • Exhibit 06: Executive Summary – Chart on Market Segmentation by Application
    • Exhibit 07: Executive Summary – Chart on Incremental Growth
    • Exhibit 08: Executive Summary – Data Table on Incremental Growth
    • Exhibit 09: Executive Summary – Chart on Vendor Market Positioning

2 Market Landscape

  • 2.1 Market ecosystem
    • Exhibit 10: Parent market
    • Exhibit 11: Market Characteristics

3 Market Sizing

  • 3.1 Market definition
    • Exhibit 12: Offerings of vendors included in the market definition
  • 3.2 Market segment analysis
    • Exhibit 13: Market segments
  • 3.3 Market size 2023
    • 3.4 Market outlook: Forecast for 2023-2028
      • Exhibit 14: Chart on Global - Market size and forecast 2023-2028 ($ billion)
      • Exhibit 15: Data Table on Global - Market size and forecast 2023-2028 ($ billion)
      • Exhibit 16: Chart on Global Market: Year-over-year growth 2023-2028 (%)
      • Exhibit 17: Data Table on Global Market: Year-over-year growth 2023-2028 (%)

    4 Historic Market Size

    • 4.1 Global nuclear powered naval vessels market 2018 - 2022
      • Exhibit 18: Historic Market Size – Data Table on global nuclear powered naval vessels market 2018 - 2022 ($ billion)
    • 4.2 Product Segment Analysis 2018 - 2022
      • Exhibit 19: Historic Market Size – Product Segment 2018 - 2022 ($ billion)
    • 4.3 Application Segment Analysis 2018 - 2022
      • Exhibit 20: Historic Market Size – Application Segment 2018 - 2022 ($ billion)
    • 4.4 Geography Segment Analysis 2018 - 2022
      • Exhibit 21: Historic Market Size – Geography Segment 2018 - 2022 ($ billion)
    • 4.5 Country Segment Analysis 2018 - 2022
      • Exhibit 22: Historic Market Size – Country Segment 2018 - 2022 ($ billion)

    5 Five Forces Analysis

    • 5.1 Five forces summary
      • Exhibit 23: Five forces analysis - Comparison between 2023 and 2028
    • 5.2 Bargaining power of buyers
      • Exhibit 24: Chart on Bargaining power of buyers – Impact of key factors 2023 and 2028
    • 5.3 Bargaining power of suppliers
      • Exhibit 25: Bargaining power of suppliers – Impact of key factors in 2023 and 2028
    • 5.4 Threat of new entrants
      • Exhibit 26: Threat of new entrants – Impact of key factors in 2023 and 2028
    • 5.5 Threat of substitutes
      • Exhibit 27: Threat of substitutes – Impact of key factors in 2023 and 2028
    • 5.6 Threat of rivalry
      • Exhibit 28: Threat of rivalry – Impact of key factors in 2023 and 2028
    • 5.7 Market condition
      • Exhibit 29: Chart on Market condition - Five forces 2023 and 2028

    6 Market Segmentation by Product

    • 6.1 Market segments
      • Exhibit 30: Chart on Product - Market share 2023-2028 (%)
      • Exhibit 31: Data Table on Product - Market share 2023-2028 (%)
    • 6.2 Comparison by Product
      • Exhibit 32: Chart on Comparison by Product
      • Exhibit 33: Data Table on Comparison by Product
    • 6.3 Surface vessels - Market size and forecast 2023-2028
      • Exhibit 34: Chart on Surface vessels - Market size and forecast 2023-2028 ($ billion)
      • Exhibit 35: Data Table on Surface vessels - Market size and forecast 2023-2028 ($ billion)
      • Exhibit 36: Chart on Surface vessels - Year-over-year growth 2023-2028 (%)
      • Exhibit 37: Data Table on Surface vessels - Year-over-year growth 2023-2028 (%)
    • 6.4 Submerged vessels - Market size and forecast 2023-2028
      • Exhibit 38: Chart on Submerged vessels - Market size and forecast 2023-2028 ($ billion)
      • Exhibit 39: Data Table on Submerged vessels - Market size and forecast 2023-2028 ($ billion)
      • Exhibit 40: Chart on Submerged vessels - Year-over-year growth 2023-2028 (%)
      • Exhibit 41: Data Table on Submerged vessels - Year-over-year growth 2023-2028 (%)
    • 6.5 Market opportunity by Product
      • Exhibit 42: Market opportunity by Product ($ billion)
      • Exhibit 43: Data Table on Market opportunity by Product ($ billion)

    7 Market Segmentation by Application

    • 7.1 Market segments
      • Exhibit 44: Chart on Application - Market share 2023-2028 (%)
      • Exhibit 45: Data Table on Application - Market share 2023-2028 (%)
    • 7.2 Comparison by Application
      • Exhibit 46: Chart on Comparison by Application
      • Exhibit 47: Data Table on Comparison by Application
    • 7.3 Defense - Market size and forecast 2023-2028
      • Exhibit 48: Chart on Defense - Market size and forecast 2023-2028 ($ billion)
      • Exhibit 49: Data Table on Defense - Market size and forecast 2023-2028 ($ billion)
      • Exhibit 50: Chart on Defense - Year-over-year growth 2023-2028 (%)
      • Exhibit 51: Data Table on Defense - Year-over-year growth 2023-2028 (%)
    • 7.4 Transportation - Market size and forecast 2023-2028
      • Exhibit 52: Chart on Transportation - Market size and forecast 2023-2028 ($ billion)
      • Exhibit 53: Data Table on Transportation - Market size and forecast 2023-2028 ($ billion)
      • Exhibit 54: Chart on Transportation - Year-over-year growth 2023-2028 (%)
      • Exhibit 55: Data Table on Transportation - Year-over-year growth 2023-2028 (%)
    • 7.5 Market opportunity by Application
      • Exhibit 56: Market opportunity by Application ($ billion)
      • Exhibit 57: Data Table on Market opportunity by Application ($ billion)

    8 Customer Landscape

    • 8.1 Customer landscape overview
      • Exhibit 58: Analysis of price sensitivity, lifecycle, customer purchase basket, adoption rates, and purchase criteria

    9 Geographic Landscape

    • 9.1 Geographic segmentation
      • Exhibit 59: Chart on Market share by geography 2023-2028 (%)
      • Exhibit 60: Data Table on Market share by geography 2023-2028 (%)
    • 9.2 Geographic comparison
      • Exhibit 61: Chart on Geographic comparison
      • Exhibit 62: Data Table on Geographic comparison
    • 9.3 North America - Market size and forecast 2023-2028
      • Exhibit 63: Chart on North America - Market size and forecast 2023-2028 ($ billion)
      • Exhibit 64: Data Table on North America - Market size and forecast 2023-2028 ($ billion)
      • Exhibit 65: Chart on North America - Year-over-year growth 2023-2028 (%)
      • Exhibit 66: Data Table on North America - Year-over-year growth 2023-2028 (%)
    • 9.4 APAC - Market size and forecast 2023-2028
      • Exhibit 67: Chart on APAC - Market size and forecast 2023-2028 ($ billion)
      • Exhibit 68: Data Table on APAC - Market size and forecast 2023-2028 ($ billion)
      • Exhibit 69: Chart on APAC - Year-over-year growth 2023-2028 (%)
      • Exhibit 70: Data Table on APAC - Year-over-year growth 2023-2028 (%)
    • 9.5 Europe - Market size and forecast 2023-2028
      • Exhibit 71: Chart on Europe - Market size and forecast 2023-2028 ($ billion)
      • Exhibit 72: Data Table on Europe - Market size and forecast 2023-2028 ($ billion)
      • Exhibit 73: Chart on Europe - Year-over-year growth 2023-2028 (%)
      • Exhibit 74: Data Table on Europe - Year-over-year growth 2023-2028 (%)
    • 9.6 Middle East and Africa - Market size and forecast 2023-2028
      • Exhibit 75: Chart on Middle East and Africa - Market size and forecast 2023-2028 ($ billion)
      • Exhibit 76: Data Table on Middle East and Africa - Market size and forecast 2023-2028 ($ billion)
      • Exhibit 77: Chart on Middle East and Africa - Year-over-year growth 2023-2028 (%)
      • Exhibit 78: Data Table on Middle East and Africa - Year-over-year growth 2023-2028 (%)
    • 9.7 South America - Market size and forecast 2023-2028
      • Exhibit 79: Chart on South America - Market size and forecast 2023-2028 ($ billion)
      • Exhibit 80: Data Table on South America - Market size and forecast 2023-2028 ($ billion)
      • Exhibit 81: Chart on South America - Year-over-year growth 2023-2028 (%)
      • Exhibit 82: Data Table on South America - Year-over-year growth 2023-2028 (%)
    • 9.8 US - Market size and forecast 2023-2028
      • Exhibit 83: Chart on US - Market size and forecast 2023-2028 ($ billion)
      • Exhibit 84: Data Table on US - Market size and forecast 2023-2028 ($ billion)
      • Exhibit 85: Chart on US - Year-over-year growth 2023-2028 (%)
      • Exhibit 86: Data Table on US - Year-over-year growth 2023-2028 (%)
    • 9.9 China - Market size and forecast 2023-2028
      • Exhibit 87: Chart on China - Market size and forecast 2023-2028 ($ billion)
      • Exhibit 88: Data Table on China - Market size and forecast 2023-2028 ($ billion)
      • Exhibit 89: Chart on China - Year-over-year growth 2023-2028 (%)
      • Exhibit 90: Data Table on China - Year-over-year growth 2023-2028 (%)
    • 9.10 Russia - Market size and forecast 2023-2028
      • Exhibit 91: Chart on Russia - Market size and forecast 2023-2028 ($ billion)
      • Exhibit 92: Data Table on Russia - Market size and forecast 2023-2028 ($ billion)
      • Exhibit 93: Chart on Russia - Year-over-year growth 2023-2028 (%)
      • Exhibit 94: Data Table on Russia - Year-over-year growth 2023-2028 (%)
    • 9.11 France - Market size and forecast 2023-2028
      • Exhibit 95: Chart on France - Market size and forecast 2023-2028 ($ billion)
      • Exhibit 96: Data Table on France - Market size and forecast 2023-2028 ($ billion)
      • Exhibit 97: Chart on France - Year-over-year growth 2023-2028 (%)
      • Exhibit 98: Data Table on France - Year-over-year growth 2023-2028 (%)
    • 9.12 India - Market size and forecast 2023-2028
      • Exhibit 99: Chart on India - Market size and forecast 2023-2028 ($ billion)
      • Exhibit 100: Data Table on India - Market size and forecast 2023-2028 ($ billion)
      • Exhibit 101: Chart on India - Year-over-year growth 2023-2028 (%)
      • Exhibit 102: Data Table on India - Year-over-year growth 2023-2028 (%)
    • 9.13 Market opportunity by geography
      • Exhibit 103: Market opportunity by geography ($ billion)
      • Exhibit 104: Data Tables on Market opportunity by geography ($ billion)

    10 Drivers, Challenges, and Trends

    • 10.1 Market drivers
      • 10.2 Market challenges
        • 10.3 Impact of drivers and challenges
          • Exhibit 105: Impact of drivers and challenges in 2023 and 2028
        • 10.4 Market trends

          11 Vendor Landscape

          • 11.1 Overview
            • 11.2 Vendor landscape
              • Exhibit 106: Overview on Criticality of inputs and Factors of differentiation
            • 11.3 Landscape disruption
              • Exhibit 107: Overview on factors of disruption
            • 11.4 Industry risks
              • Exhibit 108: Impact of key risks on business

            12 Vendor Analysis

            • 12.1 Vendors covered
              • Exhibit 109: Vendors covered
            • 12.2 Market positioning of vendors
              • Exhibit 110: Matrix on vendor position and classification
            • 12.3 Austal Ltd.
              • Exhibit 111: Austal Ltd. - Overview
              • Exhibit 112: Austal Ltd. - Business segments
              • Exhibit 113: Austal Ltd. - Key offerings
              • Exhibit 114: Austal Ltd. - Segment focus
            • 12.4 Babcock International Group Plc
              • Exhibit 115: Babcock International Group Plc - Overview
              • Exhibit 116: Babcock International Group Plc - Business segments
              • Exhibit 117: Babcock International Group Plc - Key offerings
              • Exhibit 118: Babcock International Group Plc - Segment focus
            • 12.5 BAE Systems Plc
              • Exhibit 119: BAE Systems Plc - Overview
              • Exhibit 120: BAE Systems Plc - Business segments
              • Exhibit 121: BAE Systems Plc - Key offerings
              • Exhibit 122: BAE Systems Plc - Segment focus
            • 12.6 Bechtel Corp.
              • Exhibit 123: Bechtel Corp. - Overview
              • Exhibit 124: Bechtel Corp. - Product / Service
              • Exhibit 125: Bechtel Corp. - Key news
              • Exhibit 126: Bechtel Corp. - Key offerings
            • 12.7 BWX Technologies Inc.
              • Exhibit 127: BWX Technologies Inc. - Overview
              • Exhibit 128: BWX Technologies Inc. - Business segments
              • Exhibit 129: BWX Technologies Inc. - Key offerings
              • Exhibit 130: BWX Technologies Inc. - Segment focus
            • 12.8 Curtiss Wright Corp.
              • Exhibit 131: Curtiss Wright Corp. - Overview
              • Exhibit 132: Curtiss Wright Corp. - Business segments
              • Exhibit 133: Curtiss Wright Corp. - Key offerings
              • Exhibit 134: Curtiss Wright Corp. - Segment focus
            • 12.9 General Dynamics Corp.
              • Exhibit 135: General Dynamics Corp. - Overview
              • Exhibit 136: General Dynamics Corp. - Business segments
              • Exhibit 137: General Dynamics Corp. - Key news
              • Exhibit 138: General Dynamics Corp. - Key offerings
              • Exhibit 139: General Dynamics Corp. - Segment focus
            • 12.10 Huntington Ingalls Industries Inc.
              • Exhibit 140: Huntington Ingalls Industries Inc. - Overview
              • Exhibit 141: Huntington Ingalls Industries Inc. - Business segments
              • Exhibit 142: Huntington Ingalls Industries Inc. - Key offerings
              • Exhibit 143: Huntington Ingalls Industries Inc. - Segment focus
            • 12.11 Kongsberg Gruppen ASA
              • Exhibit 144: Kongsberg Gruppen ASA - Overview
              • Exhibit 145: Kongsberg Gruppen ASA - Business segments
              • Exhibit 146: Kongsberg Gruppen ASA - Key news
              • Exhibit 147: Kongsberg Gruppen ASA - Key offerings
              • Exhibit 148: Kongsberg Gruppen ASA - Segment focus
            • 12.12 Lockheed Martin Corp.
              • Exhibit 149: Lockheed Martin Corp. - Overview
              • Exhibit 150: Lockheed Martin Corp. - Business segments
              • Exhibit 151: Lockheed Martin Corp. - Key news
              • Exhibit 152: Lockheed Martin Corp. - Key offerings
              • Exhibit 153: Lockheed Martin Corp. - Segment focus
            • 12.13 Naval Group
              • Exhibit 154: Naval Group - Overview
              • Exhibit 155: Naval Group - Product / Service
              • Exhibit 156: Naval Group - Key offerings
            • 12.14 Northrop Grumman Corp.
              • Exhibit 157: Northrop Grumman Corp. - Overview
              • Exhibit 158: Northrop Grumman Corp. - Business segments
              • Exhibit 159: Northrop Grumman Corp. - Key news
              • Exhibit 160: Northrop Grumman Corp. - Key offerings
              • Exhibit 161: Northrop Grumman Corp. - Segment focus
            • 12.15 Rolls Royce Holdings Plc
              • Exhibit 162: Rolls Royce Holdings Plc - Overview
              • Exhibit 163: Rolls Royce Holdings Plc - Business segments
              • Exhibit 164: Rolls Royce Holdings Plc - Key news
              • Exhibit 165: Rolls Royce Holdings Plc - Key offerings
              • Exhibit 166: Rolls Royce Holdings Plc - Segment focus
            • 12.16 Thales Group
              • Exhibit 167: Thales Group - Overview
              • Exhibit 168: Thales Group - Business segments
              • Exhibit 169: Thales Group - Key news
              • Exhibit 170: Thales Group - Key offerings
              • Exhibit 171: Thales Group - Segment focus

            13 Appendix

            • 13.1 Scope of the report
              • 13.2 Inclusions and exclusions checklist
                • Exhibit 172: Inclusions checklist
                • Exhibit 173: Exclusions checklist
              • 13.3 Currency conversion rates for US$
                • Exhibit 174: Currency conversion rates for US$
              • 13.4 Research methodology
                • Exhibit 175: Research methodology
                • Exhibit 176: Validation techniques employed for market sizing
                • Exhibit 177: Information sources
              • 13.5 List of abbreviations
                • Exhibit 178: List of abbreviations

              Research Methodology

              Technavio presents a detailed picture of the market by way of study, synthesis, and summation of data from multiple sources. The analysts have presented the various facets of the market with a particular focus on identifying the key industry influencers. The data thus presented is comprehensive, reliable, and the result of extensive research, both primary and secondary.

              INFORMATION SOURCES

              Primary sources

              • Manufacturers and suppliers
              • Channel partners
              • Industry experts
              • Strategic decision makers

              Secondary sources

              • Industry journals and periodicals
              • Government data
              • Financial reports of key industry players
              • Historical data
              • Press releases

              DATA ANALYSIS

              Data Synthesis

              • Collation of data
              • Estimation of key figures
              • Analysis of derived insights

              Data Validation

              • Triangulation with data models
              • Reference against proprietary databases
              • Corroboration with industry experts

              REPORT WRITING

              Qualitative

              • Market drivers
              • Market challenges
              • Market trends
              • Five forces analysis

              Quantitative

              • Market size and forecast
              • Market segmentation
              • Geographical insights
              • Competitive landscape

              Interested in this report?

              Get your sample now to see our research methodology and insights!

              Download Now

              Frequently Asked Questions

              Nuclear Powered Naval Vessels market growth will increase by $ 12.44 bn during 2024-2028.

              The Nuclear Powered Naval Vessels market is expected to grow at a CAGR of 8% during 2024-2028.

              Nuclear Powered Naval Vessels market is segmented by Product( Surface vessels, Submerged vessels) Application( Defense, Transportation, Europe, MEA, South America)

              Austal Ltd., Babcock International Group Plc, BAE Systems Plc, Bechtel Corp., BWX Technologies Inc., Curtiss Wright Corp., General Dynamics Corp., Huntington Ingalls Industries Inc., Kongsberg Gruppen ASA, Lockheed Martin Corp., Naval Group, Northrop Grumman Corp., Rolls Royce Holdings Plc, Thales Group are a few of the key vendors in the Nuclear Powered Naval Vessels market.

              APAC will register the highest growth rate of 37% among the other regions. Therefore, the Nuclear Powered Naval Vessels market in APAC is expected to garner significant business opportunities for the vendors during the forecast period.

              US, China, India, Russia, France

              • Cost effectiveness of nuclear powerOne of the major costs associated with the operation of naval vessels is the fuel expenses that go into the ship for its propulsion. A conventional source of fuel for ships has been petroleum is the driving factor this market.
              • which is expensive and belongs to the fossil fuels category. The three major types of fuels for ships are heavy fuel oil is the driving factor this market.
              • low-sulfur fuel oil is the driving factor this market.
              • and diesel oil. The Arleigh Burke-class destroyer typically burns approximately 24 barrels (1 is the driving factor this market.
              • 000 gallons) of fuel per hour and may vary depending on various other factors like wind force is the driving factor this market.
              • payload is the driving factor this market.
              • tides is the driving factor this market.
              • etc. This costs several millions is the driving factor this market.
              • making it expensive for naval ships. In nuclear-powered naval vessels is the driving factor this market.
              • uranium fission reaction is used to generate heat is the driving factor this market.
              • which is further used to heat water and produce steam. This steam is used by the turbines as a source of energy to propel the ship forward. Uranium is the driving factor this market.
              • which is a heavy metal is the driving factor this market.
              • is a rich source of energy and is available in abundance in the environment. Uranium occurs in seawater is the driving factor this market.
              • in the earth's crust as tin is the driving factor this market.
              • tungsten is the driving factor this market.
              • and molybdenum is the driving factor this market.
              • and in concentrations of 2-4 parts per million in most rocks. At the same time is the driving factor this market.
              • the steam used to run propellers can otherwise be used to run generators that produce large amounts of electricity sufficient for the naval vessels' overhead operations is the driving factor this market.
              • thereby cutting the cost of electricity generation. Nuclear power is particularly suitable for naval vessels is the driving factor this market.
              • which need to be at sea/ocean for longer periods without refueling is the driving factor this market.
              • or for powerful submarine propulsion. Nuclear-powered carriers' new cores are designed to have a service life of 25 years. Submarines' new cores have service lives of 10 to 33 years before needing to be refueled. For instance is the driving factor this market.
              • Virginia-class submarines' nuclear reactor plant has a service life of 33 years planned without refueling. These factors will drive the growth of the global nuclear powered naval vessels market during the forecast period. is the driving factor this market.

              The Nuclear Powered Naval Vessels market vendors should focus on grabbing business opportunities from the Surface vessels segment as it accounted for the largest market share in the base year.