Onshore Wind Power Systems Market Analysis APAC, North America, Europe, South America, Middle East and Africa - China, US, Germany, Brazil, France - Size and Forecast 2024-2028

Onshore Wind Power Systems Market Analysis APAC, North America, Europe, South America, Middle East and Africa - China, US, Germany, Brazil, France - Size and Forecast 2024-2028

Published: Jul 2024 184 Pages SKU: IRTNTR70919

Market Overview at a Glance

$35.6 B
Market Opportunity
5.11%
CAGR
4.85
YoY growth 2023-2024(%)

Onshore Wind Power Systems Market Size 2024-2028

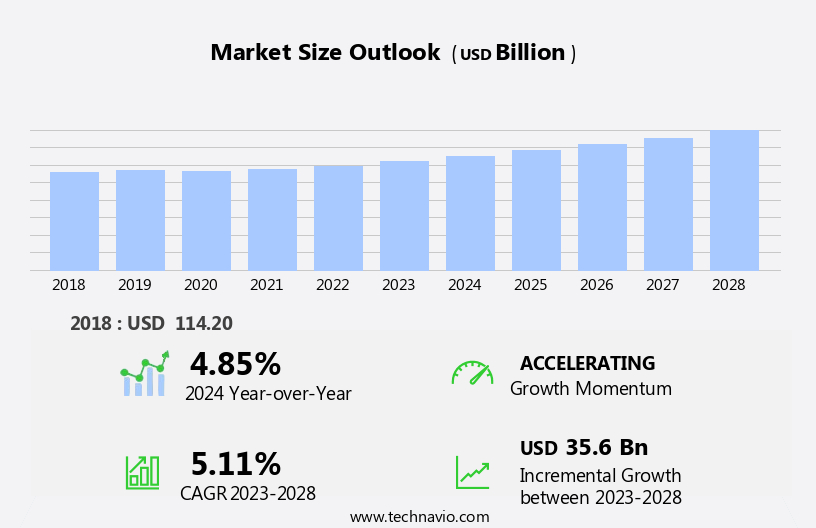
The onshore wind power systems market size is forecast to increase by USD 35.6 billion at a CAGR of 5.11% between 2023 and 2028.

  • The market is experiencing significant growth, driven by key factors such as the increasing height and capacity of wind towers. This trend is leading to more efficient energy production and reduced operational costs. Another major trend is the digitalization and remote monitoring of wind farms, enabling real-time data analysis and predictive maintenance. However, challenges persist In the form of limited land availability and the need to identify suitable sites for wind farm development. Addressing these challenges will be crucial for the continued expansion of the market. The market analysis report provides a comprehensive assessment of these trends and challenges, offering valuable insights for stakeholders and industry participants.
  • What will be the Size of the Onshore Wind Power Systems Market During the Forecast Period?

    Onshore Wind Power Systems Market Size

     Request Free Sample

  • The market is experiencing robust growth, driven by the global shift towards renewable energy sources and the increasing demand for electric power. According to recent studies, the market is expected to witness significant expansion due to advancements in wind energy technology, including larger wind turbines and digitalization. The integration of wind energy into traditional energy grids is also a key trend, as the industry seeks to enhance system stability and grid connectivity. Wind energy is increasingly competing with traditional energy sources, such as oil and gas, and is gaining favor due to its environmental benefits and decreasing costs. However, challenges remain, including aviation safety concerns and the need for reliable data and peak power management.
  • Remote monitoring and power storage solutions, as well as demand and frequency response, are becoming increasingly important to ensure grid stability and optimize energy production. Community-owned wind farms and decentralized wind energy systems are also gaining popularity, providing opportunities for local energy production and distribution. Major players In the market include Envision Energy, Vestas Wind Systems, Enercon GmbH, Mitsubishi Power Systems, Repower, and others. As the market continues to evolve, comprehensive data and reliable information will be essential for stakeholders to make informed decisions and stay competitive.
  • How is this Onshore Wind Power Systems Industry segmented and which is the largest segment?

    The onshore wind power systems industry research report provides comprehensive data (region-wise segment analysis), with forecasts and estimates in "USD billion" for the period 2024-2028, as well as historical data from 2018-2022 for the following segments.
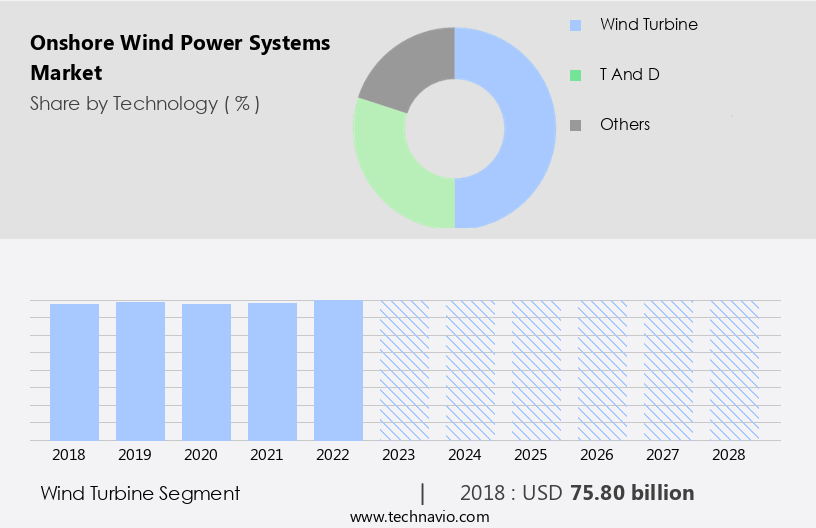
    • Technology
      • Wind turbine
      • T and D
      • Others
    • End-user
      • Electric power
      • Renewable energy
      • Oil and gas
      • Aviation
      • Others
    • Geography
      • APAC
        • China
      • North America
        • US
      • Europe
        • Germany
        • France
      • South America
        • Brazil
      • Middle East and Africa

      By Technology Insights

      • The wind turbine segment is estimated to witness significant growth during the forecast period.

      Wind power systems, specifically onshore wind turbines, are a vital component of the renewable energy sector. These systems utilize wind energy to generate electricity, harnessing the power of the wind through the use of turbines. The primary components of a wind turbine include the mast, nacelle, rotor blades, gearbox, and generator. The mast, ranging in length based on the turbine's power, supports the rotor and nacelle. The rotor, typically consisting of three blades, spins due to the air pressure difference, generating kinetic energy. The rotor is connected to the generator, either directly or via a gearbox, increasing the rotational speed.

      Wind energy is a clean, sustainable alternative to traditional oil and gas sources, and is increasingly being integrated into the electric power grid. Advancements in technology, such as digitalization, remote monitoring, and peak power management, are enhancing the efficiency and reliability of wind energy systems. Additionally, community-owned wind farms and hybrid power systems are gaining popularity, expanding the market's reach. The wind power market is witnessing new product launches, contractual agreements, and competitive insights, driven by the increasing demand for electricity generation and the need for grid connectivity. Wind energy is a promising solution for meeting peak power demand, especially during high, medium, and low wind speed conditions.

      Wind capacity continues to grow, with on-grid and off-grid applications, and the integration of power storage, demand response, frequency response, and system stability solutions.

      Onshore Wind Power Systems Market Size

      Get a glance at the  Onshore Wind Power Systems Industry report of share of various segments Request Free Sample

      The Wind turbine segment was valued at USD 75.80 billion in 2018 and showed a gradual increase during the forecast period.
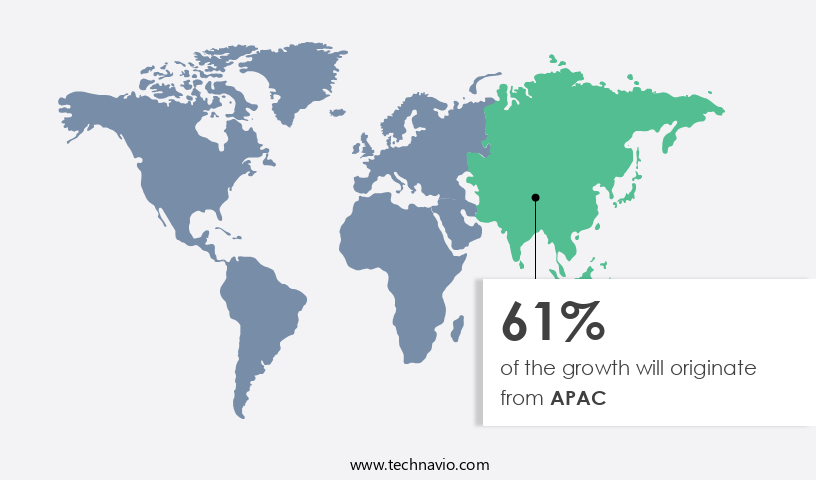
      Regional Analysis

      • APAC is estimated to contribute 61% to the growth of the global market during the forecast period.

      Technavio’s analysts have elaborately explained the regional trends and drivers that shape the market during the forecast period.

      Onshore Wind Power Systems Market Share by Geography

      For more insights on the market share of various regions, Request Free Sample

      The market in APAC is experiencing significant growth due to the increasing energy demands driven by population growth and rising living standards. Renewable energy, particularly wind energy, is gaining prominence In the region as countries strive to reduce their reliance on traditional energy sources and decrease greenhouse gas emissions. New installations of onshore wind power systems are being implemented to meet these energy requirements. In China and India, for instance, there is a pressing need to address pollution issues, leading to a heightened focus on renewable energy. Wind energy is becoming a preferred choice for electricity generation in APAC, with wind turbines being installed across various wind speeds, from high to low.

      The market is characterized by advancements in wind turbine technology, grid connectivity, power capacity, and peak power demand management. Companies such as Envision Energy, Vestas Wind System, Enercon GmbH, Mitsubishi Power Systems, Repower, and Peak Power Management are at the forefront of these developments. Digitalization is also playing a crucial role, with remote monitoring and demand response systems enhancing system stability and reliability. Power storage solutions, including battery charging through wind power, are further expanding the market's potential.

      Market Dynamics

      Our  researchers analyzed the data with 2023 as the base year, along with the key drivers, trends, and challenges. A holistic analysis of drivers will help companies refine their marketing strategies to gain a competitive advantage.

      What are the key market drivers leading to the rise In the adoption of Onshore Wind Power Systems Industry?

      Rising height and capacity of wind towers is the key driver of the market.

    • The market has experienced substantial growth due to advancements in Wind Turbine Technology, leading to taller wind towers and larger rotors and blades. This trend has significantly increased the power-generating capacity of wind turbines, making wind energy a more viable and efficient Renewable Energy source. Inland areas with high wind turbulence particularly benefit from the increased height of wind towers, as wind yield improves at higher altitudes. Digitalization plays a crucial role In the sector through remote monitoring and Peak Power Management systems, enabling reliable data collection and analysis for optimal Electricity Generation. New Product Launches and Contractual Agreements are driving competition In the market, with key players such as Envision Energy, Vestas Wind System, Enercon GmbH, Mitsubishi Power Systems, and Repower leading the charge.
    • Power Storage and Demand Response solutions are also gaining traction, ensuring system stability and addressing Power Capacity needs during High Wind Speed, Medium Wind Speed, and Low Wind Speed conditions. Grid Connectivity and Peak Power Demand management are essential for integrating Onshore Wind Farms into the Electric Grid, increasing Installed Capacity and New Installed Capacity. Overall, the market continues to evolve, offering significant opportunities for growth In the Electric Wind Energy sector.
    • What are the market trends shaping the Onshore Wind Power Systems Industry?

      Digitalization and remote monitoring is the upcoming market trend.

    • The market is witnessing a technological shift with the integration of digitalization. Wind energy operators are leveraging IoT sensors and data analytics to enhance the efficiency and safety of wind turbines. Predictive maintenance algorithms analyze real-time data to identify potential issues, reducing downtime and maintenance costs. Furthermore, data analytics optimizes turbine performance by identifying patterns and adjusting operational settings to maximize electricity generation. The onshore wind power sector is transitioning towards more data-driven and sophisticated management. This includes peak power management, power storage, demand response, and frequency response for system stability. Wind capacity is expanding across various wind speed categories, including high, medium, and low, with on-grid and off-grid applications.
    • The market is also witnessing new product launches and contractual agreements, driving competitive insights In the renewable energy sector. Wind turbine technology continues to evolve, focusing on efficiency, capacity, and components for power generation. Applications of wind energy extend beyond electricity generation, including pumping water and charging batteries. The market is a significant contributor to the electricity generation mix and the renewable energy sector's growth.
    • What challenges does the Onshore Wind Power Systems Industry face during its growth?

      Issues related to land availability and proper sites to set up wind farms is a key challenge affecting the industry growth.

    • The market encompasses the technology and components of land-based wind turbines used for electricity generation from wind energy. Wind towers are a crucial part of this industry, housing the turbine blades and nacelle, which converts wind into electricity. Wind farms, consisting of multiple wind turbines, contribute significantly to renewable energy production, providing an alternative to oil and gas-derived electric power. Technological advancements in wind turbine design and digitalization have led to remote monitoring capabilities, enabling peak power management, power storage, demand response, and frequency response for system stability. Wind capacity is categorized into high, medium, and low wind speed, with on-grid and off-grid applications.
    • Onshore wind power systems face challenges such as land acquisition for wind farm development, addressing community concerns regarding visual impact and noise pollution, and ensuring grid connectivity and power capacity. New product launches and contractual agreements are driving the market forward, with key players like Envision Energy, Vestas Wind System, Enercon GmbH, Mitsubishi Power Systems, Repower, and others contributing to the industry's growth. The market is witnessing increased focus on peak power demand management, power storage, and hybrid power solutions. As the industry continues to evolve, it is essential to monitor comprehensive data and ensure reliable electricity generation to meet the growing demand for clean energy sources.
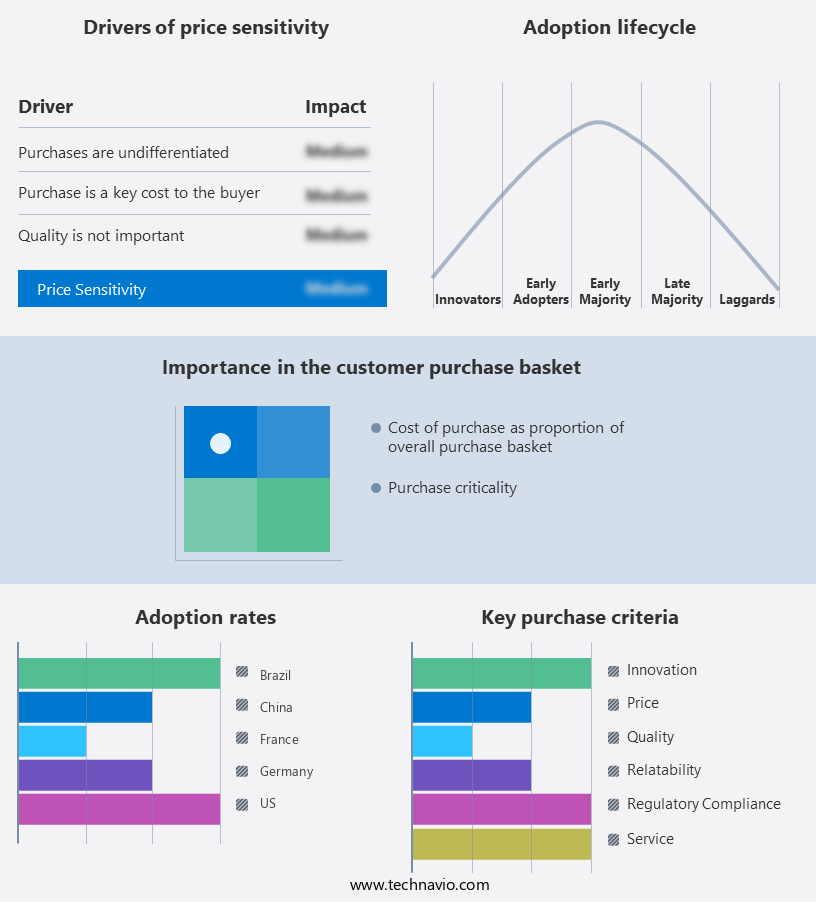
    • Exclusive Customer Landscape

      The onshore wind power systems market forecasting report includes the adoption lifecycle of the market, covering from the innovator’s stage to the laggard’s stage. It focuses on adoption rates in different regions based on penetration. Furthermore, the onshore wind power systems market report also includes key purchase criteria and drivers of price sensitivity to help companies evaluate and develop their market growth analysis strategies.

      Onshore Wind Power Systems Market Share by Geography

       Customer Landscape

      Key Companies & Market Insights

      Companies are implementing various strategies, such as strategic alliances, onshore wind power systems market forecast, partnerships, mergers and acquisitions, geographical expansion, and product/service launches, to enhance their presence In the industry.

      AB SKF - Onshore wind power systems are a vital component of the renewable energy sector. One notable offering in this domain is SKF WindCon, designed specifically for onshore wind turbines. This system ensures optimal performance and reliability through advanced bearing technology and condition monitoring capabilities. SKF WindCon's features include improved efficiency, extended maintenance intervals, and enhanced safety. By investing in such innovative wind power solutions, organizations can contribute to a sustainable energy future while maximizing their operational efficiency.

      The industry research and growth report includes detailed analyses of the competitive landscape of the market and information about key companies, including:

      • AB SKF
      • AEROVIDE GmbH
      • Belden Inc.
      • Bora Energy
      • CS WIND Corp.
      • Doosan Corp.
      • Emergya Wind Technologies BV
      • ENERCON GmbH
      • Envision Energy USA Ltd.
      • Fujikura Co. Ltd.
      • General Electric Co.
      • K2 Management
      • Nexans SA
      • Nordex SE
      • ReGen Powertech Pvt. Ltd.
      • Siemens AG
      • Suzlon Energy Ltd.
      • TERNA S.p.A.
      • Vestas Wind Systems AS
      • Xinjiang Goldwind Science and Technology Co. Ltd.

      Qualitative and quantitative analysis of companies has been conducted to help clients understand the wider business environment as well as the strengths and weaknesses of key industry players. Data is qualitatively analyzed to categorize companies as pure play, category-focused, industry-focused, and diversified; it is quantitatively analyzed to categorize companies as dominant, leading, strong, tentative, and weak.

      Research Analyst Overview

      Onshore wind power systems have emerged as a significant contributor to the global electricity generation landscape, offering a reliable and renewable source of energy. The technology behind onshore wind power systems continues to evolve, with advancements in digitalization, remote monitoring, and peak power management playing a crucial role in enhancing system efficiency and performance. The onshore wind power market is driven by various factors, including the increasing demand for clean energy sources and the need to reduce reliance on traditional oil and gas-based power generation. The integration of wind power into the electric grid has become a priority for many countries, leading to significant investments in on-grid and off-grid wind power projects.

      One of the key trends In the onshore wind power market is the adoption of digital technologies. Remote monitoring systems enable operators to optimize wind turbine performance and prevent downtime, while peak power management and power storage solutions help to balance the grid and ensure system stability. Demand response and frequency response technologies also play a critical role in maintaining grid connectivity and managing power capacity during periods of high wind speed or peak power demand. The onshore wind power market is diverse, with a range of wind turbine technologies and components available to meet different wind conditions and power generation requirements.

      From high wind speed turbines to medium and low wind speed systems, there is a solution for every application. On-grid and off-grid systems are also gaining popularity, particularly in remote or community-owned projects. Hybrid power systems, which combine wind power with other renewable energy sources such as solar or hydro, are another emerging trend In the onshore wind power market. These systems offer increased reliability and efficiency, making them an attractive option for energy-intensive industries and remote communities. The onshore wind power market is expected to continue growing, driven by increasing demand for clean energy and technological advancements.

      Installed capacity is projected to increase significantly In the coming years, with new product launches and contractual agreements contributing to market growth. Despite the numerous benefits of onshore wind power, there are challenges that must be addressed. These include the intermittency of wind power and the need for reliable data to ensure system efficiency and performance. Comprehensive data and reliable data sources are essential for optimizing wind turbine performance and maintaining grid connectivity. In conclusion, the onshore wind power market is a dynamic and evolving industry, driven by the need for clean energy sources and technological advancements. Digitalization, remote monitoring, and peak power management are key trends shaping the market, while hybrid power systems offer increased reliability and efficiency.

      The market is expected to continue growing, with significant investments in new technologies and renewable energy projects.

      Market Scope

      Report Coverage

      Details

      Page number

      184

      Base year

      2023

      Historic period

      2018-2022

      Forecast period

      2024-2028

      Growth momentum & CAGR

      Accelerate at a CAGR of 5.11%

      Market growth 2024-2028

      USD 35.6 billion

      Market structure

      Fragmented

      YoY growth 2023-2024(%)

      4.85

      Key countries

      China, US, Germany, Brazil, and France

      Competitive landscape

      Leading Companies, Market Positioning of Companies, Competitive Strategies, and Industry Risks

      Request Free Sample

      What are the Key Data Covered in this Onshore Wind Power Systems Market Research and Growth Report?

      • CAGR of the Onshore Wind Power Systems industry during the forecast period
      • Detailed information on factors that will drive the growth and forecasting between 2024 and 2028
      • Precise estimation of the size of the market and its contribution of the industry in focus to the parent market
      • Accurate predictions about upcoming growth and trends and changes in consumer behaviour
      • Growth of the market across APAC, North America, Europe, South America, and Middle East and Africa
      • Thorough analysis of the market’s competitive landscape and detailed information about companies
      • Comprehensive analysis of factors that will challenge the onshore wind power systems market growth of industry companies

      We can help! Our analysts can customize this onshore wind power systems market research report to meet your requirements.

      Get in touch


      1 Executive Summary

      • 1.1 Market overview
        • Executive Summary - Chart on Market Overview
        • Executive Summary - Data Table on Market Overview
        • Executive Summary - Chart on Global Market Characteristics
        • Executive Summary - Chart on Market by Geography
        • Executive Summary - Chart on Market Segmentation by Technology
        • Executive Summary - Chart on Market Segmentation by End-user
        • Executive Summary - Chart on Incremental Growth
        • Executive Summary - Data Table on Incremental Growth
        • Executive Summary - Chart on Company Market Positioning

      2 Market Landscape

      • 2.1 Market ecosystem
        • Parent Market
        • Data Table on - Parent Market
      • 2.2 Market characteristics
        • Market characteristics analysis
      • 2.3 Value chain analysis
        • Value Chain Analysis

      3 Market Sizing

      • 3.1 Market definition
        • Offerings of companies included in the market definition
      • 3.2 Market segment analysis
        • Market segments
      • 3.3 Market size 2023
        • 3.4 Market outlook: Forecast for 2023-2028
          • Chart on Global - Market size and forecast 2023-2028 ($ billion)
          • Data Table on Global - Market size and forecast 2023-2028 ($ billion)
          • Chart on Global Market: Year-over-year growth 2023-2028 (%)
          • Data Table on Global Market: Year-over-year growth 2023-2028 (%)

        4 Historic Market Size

        • 4.1 Global Onshore Wind Power Systems Market 2018 - 2022
          • Historic Market Size - Data Table on Global Onshore Wind Power Systems Market 2018 - 2022 ($ billion)
        • 4.2 Technology segment analysis 2018 - 2022
          • Historic Market Size - Technology Segment 2018 - 2022 ($ billion)
        • 4.3 End-user segment analysis 2018 - 2022
          • Historic Market Size - End-user Segment 2018 - 2022 ($ billion)
        • 4.4 Geography segment analysis 2018 - 2022
          • Historic Market Size - Geography Segment 2018 - 2022 ($ billion)
        • 4.5 Country segment analysis 2018 - 2022
          • Historic Market Size - Country Segment 2018 - 2022 ($ billion)

        5 Five Forces Analysis

        • 5.1 Five forces summary
          • Five forces analysis - Comparison between 2023 and 2028
        • 5.2 Bargaining power of buyers
          • Bargaining power of buyers - Impact of key factors 2023 and 2028
        • 5.3 Bargaining power of suppliers
          • Bargaining power of suppliers - Impact of key factors in 2023 and 2028
        • 5.4 Threat of new entrants
          • Threat of new entrants - Impact of key factors in 2023 and 2028
        • 5.5 Threat of substitutes
          • Threat of substitutes - Impact of key factors in 2023 and 2028
        • 5.6 Threat of rivalry
          • Threat of rivalry - Impact of key factors in 2023 and 2028
        • 5.7 Market condition
          • Chart on Market condition - Five forces 2023 and 2028

        6 Market Segmentation by Technology

        • 6.1 Market segments
          • Chart on Technology - Market share 2023-2028 (%)
          • Data Table on Technology - Market share 2023-2028 (%)
        • 6.2 Comparison by Technology
          • Chart on Comparison by Technology
          • Data Table on Comparison by Technology
        • 6.3 Wind turbine - Market size and forecast 2023-2028
          • Chart on Wind turbine - Market size and forecast 2023-2028 ($ billion)
          • Data Table on Wind turbine - Market size and forecast 2023-2028 ($ billion)
          • Chart on Wind turbine - Year-over-year growth 2023-2028 (%)
          • Data Table on Wind turbine - Year-over-year growth 2023-2028 (%)
        • 6.4 T and D - Market size and forecast 2023-2028
          • Chart on T and D - Market size and forecast 2023-2028 ($ billion)
          • Data Table on T and D - Market size and forecast 2023-2028 ($ billion)
          • Chart on T and D - Year-over-year growth 2023-2028 (%)
          • Data Table on T and D - Year-over-year growth 2023-2028 (%)
        • 6.5 Others - Market size and forecast 2023-2028
          • Chart on Others - Market size and forecast 2023-2028 ($ billion)
          • Data Table on Others - Market size and forecast 2023-2028 ($ billion)
          • Chart on Others - Year-over-year growth 2023-2028 (%)
          • Data Table on Others - Year-over-year growth 2023-2028 (%)
        • 6.6 Market opportunity by Technology
          • Market opportunity by Technology ($ billion)
          • Data Table on Market opportunity by Technology ($ billion)

        7 Market Segmentation by End-user

        • 7.1 Market segments
          • Chart on End-user - Market share 2023-2028 (%)
          • Data Table on End-user - Market share 2023-2028 (%)
        • 7.2 Comparison by End-user
          • Chart on Comparison by End-user
          • Data Table on Comparison by End-user
        • 7.3 Electric power - Market size and forecast 2023-2028
          • Chart on Electric power - Market size and forecast 2023-2028 ($ billion)
          • Data Table on Electric power - Market size and forecast 2023-2028 ($ billion)
          • Chart on Electric power - Year-over-year growth 2023-2028 (%)
          • Data Table on Electric power - Year-over-year growth 2023-2028 (%)
        • 7.4 Renewable energy - Market size and forecast 2023-2028
          • Chart on Renewable energy - Market size and forecast 2023-2028 ($ billion)
          • Data Table on Renewable energy - Market size and forecast 2023-2028 ($ billion)
          • Chart on Renewable energy - Year-over-year growth 2023-2028 (%)
          • Data Table on Renewable energy - Year-over-year growth 2023-2028 (%)
        • 7.5 Oil and gas - Market size and forecast 2023-2028
          • Chart on Oil and gas - Market size and forecast 2023-2028 ($ billion)
          • Data Table on Oil and gas - Market size and forecast 2023-2028 ($ billion)
          • Chart on Oil and gas - Year-over-year growth 2023-2028 (%)
          • Data Table on Oil and gas - Year-over-year growth 2023-2028 (%)
        • 7.6 Aviation - Market size and forecast 2023-2028
          • Chart on Aviation - Market size and forecast 2023-2028 ($ billion)
          • Data Table on Aviation - Market size and forecast 2023-2028 ($ billion)
          • Chart on Aviation - Year-over-year growth 2023-2028 (%)
          • Data Table on Aviation - Year-over-year growth 2023-2028 (%)
        • 7.7 Others - Market size and forecast 2023-2028
          • Chart on Others - Market size and forecast 2023-2028 ($ billion)
          • Data Table on Others - Market size and forecast 2023-2028 ($ billion)
          • Chart on Others - Year-over-year growth 2023-2028 (%)
          • Data Table on Others - Year-over-year growth 2023-2028 (%)
        • 7.8 Market opportunity by End-user
          • Market opportunity by End-user ($ billion)
          • Data Table on Market opportunity by End-user ($ billion)

        8 Customer Landscape

        • 8.1 Customer landscape overview
          • Analysis of price sensitivity, lifecycle, customer purchase basket, adoption rates, and purchase criteria

        9 Geographic Landscape

        • 9.1 Geographic segmentation
          • Chart on Market share by geography 2023-2028 (%)
          • Data Table on Market share by geography 2023-2028 (%)
        • 9.2 Geographic comparison
          • Chart on Geographic comparison
          • Data Table on Geographic comparison
        • 9.3 APAC - Market size and forecast 2023-2028
          • Chart on APAC - Market size and forecast 2023-2028 ($ billion)
          • Data Table on APAC - Market size and forecast 2023-2028 ($ billion)
          • Chart on APAC - Year-over-year growth 2023-2028 (%)
          • Data Table on APAC - Year-over-year growth 2023-2028 (%)
        • 9.4 North America - Market size and forecast 2023-2028
          • Chart on North America - Market size and forecast 2023-2028 ($ billion)
          • Data Table on North America - Market size and forecast 2023-2028 ($ billion)
          • Chart on North America - Year-over-year growth 2023-2028 (%)
          • Data Table on North America - Year-over-year growth 2023-2028 (%)
        • 9.5 Europe - Market size and forecast 2023-2028
          • Chart on Europe - Market size and forecast 2023-2028 ($ billion)
          • Data Table on Europe - Market size and forecast 2023-2028 ($ billion)
          • Chart on Europe - Year-over-year growth 2023-2028 (%)
          • Data Table on Europe - Year-over-year growth 2023-2028 (%)
        • 9.6 South America - Market size and forecast 2023-2028
          • Chart on South America - Market size and forecast 2023-2028 ($ billion)
          • Data Table on South America - Market size and forecast 2023-2028 ($ billion)
          • Chart on South America - Year-over-year growth 2023-2028 (%)
          • Data Table on South America - Year-over-year growth 2023-2028 (%)
        • 9.7 Middle East and Africa - Market size and forecast 2023-2028
          • Chart on Middle East and Africa - Market size and forecast 2023-2028 ($ billion)
          • Data Table on Middle East and Africa - Market size and forecast 2023-2028 ($ billion)
          • Chart on Middle East and Africa - Year-over-year growth 2023-2028 (%)
          • Data Table on Middle East and Africa - Year-over-year growth 2023-2028 (%)
        • 9.8 China - Market size and forecast 2023-2028
          • Chart on China - Market size and forecast 2023-2028 ($ billion)
          • Data Table on China - Market size and forecast 2023-2028 ($ billion)
          • Chart on China - Year-over-year growth 2023-2028 (%)
          • Data Table on China - Year-over-year growth 2023-2028 (%)
        • 9.9 US - Market size and forecast 2023-2028
          • Chart on US - Market size and forecast 2023-2028 ($ billion)
          • Data Table on US - Market size and forecast 2023-2028 ($ billion)
          • Chart on US - Year-over-year growth 2023-2028 (%)
          • Data Table on US - Year-over-year growth 2023-2028 (%)
        • 9.10 Germany - Market size and forecast 2023-2028
          • Chart on Germany - Market size and forecast 2023-2028 ($ billion)
          • Data Table on Germany - Market size and forecast 2023-2028 ($ billion)
          • Chart on Germany - Year-over-year growth 2023-2028 (%)
          • Data Table on Germany - Year-over-year growth 2023-2028 (%)
        • 9.11 Brazil - Market size and forecast 2023-2028
          • Chart on Brazil - Market size and forecast 2023-2028 ($ billion)
          • Data Table on Brazil - Market size and forecast 2023-2028 ($ billion)
          • Chart on Brazil - Year-over-year growth 2023-2028 (%)
          • Data Table on Brazil - Year-over-year growth 2023-2028 (%)
        • 9.12 France - Market size and forecast 2023-2028
          • Chart on France - Market size and forecast 2023-2028 ($ billion)
          • Data Table on France - Market size and forecast 2023-2028 ($ billion)
          • Chart on France - Year-over-year growth 2023-2028 (%)
          • Data Table on France - Year-over-year growth 2023-2028 (%)
        • 9.13 Market opportunity by geography
          • Market opportunity by geography ($ billion)
          • Data Tables on Market opportunity by geography ($ billion)

        10 Drivers, Challenges, and Opportunity/Restraints

        • 10.1 Market drivers
          • 10.2 Market challenges
            • 10.3 Impact of drivers and challenges
              • Impact of drivers and challenges in 2023 and 2028
            • 10.4 Market opportunities/restraints

              11 Competitive Landscape

              • 11.1 Overview
                • 11.2 Competitive Landscape
                  • Overview on criticality of inputs and factors of differentiation
                • 11.3 Landscape disruption
                  • Overview on factors of disruption
                • 11.4 Industry risks
                  • Impact of key risks on business

                12 Competitive Analysis

                • 12.1 Companies profiled
                  • Companies covered
                • 12.2 Market positioning of companies
                  • Matrix on companies position and classification
                • 12.3 AB SKF
                  • AB SKF - Overview
                  • AB SKF - Business segments
                  • AB SKF - Key news
                  • AB SKF - Key offerings
                  • AB SKF - Segment focus
                • 12.4 AEROVIDE GmbH
                  • AEROVIDE GmbH - Overview
                  • AEROVIDE GmbH - Product / Service
                  • AEROVIDE GmbH - Key offerings
                • 12.5 Belden Inc.
                  • Belden Inc. - Overview
                  • Belden Inc. - Business segments
                  • Belden Inc. - Key news
                  • Belden Inc. - Key offerings
                  • Belden Inc. - Segment focus
                • 12.6 Bora Energy
                  • Bora Energy - Overview
                  • Bora Energy - Product / Service
                  • Bora Energy - Key offerings
                • 12.7 CS WIND Corp.
                  • CS WIND Corp. - Overview
                  • CS WIND Corp. - Product / Service
                  • CS WIND Corp. - Key offerings
                • 12.8 Emergya Wind Technologies BV
                  • Emergya Wind Technologies BV - Overview
                  • Emergya Wind Technologies BV - Product / Service
                  • Emergya Wind Technologies BV - Key offerings
                • 12.9 ENERCON GmbH
                  • ENERCON GmbH - Overview
                  • ENERCON GmbH - Product / Service
                  • ENERCON GmbH - Key offerings
                • 12.10 General Electric Co.
                  • General Electric Co. - Overview
                  • General Electric Co. - Business segments
                  • General Electric Co. - Key news
                  • General Electric Co. - Key offerings
                  • General Electric Co. - Segment focus
                • 12.11 Nexans SA
                  • Nexans SA - Overview
                  • Nexans SA - Business segments
                  • Nexans SA - Key news
                  • Nexans SA - Key offerings
                  • Nexans SA - Segment focus
                • 12.12 Nordex SE
                  • Nordex SE - Overview
                  • Nordex SE - Business segments
                  • Nordex SE - Key offerings
                  • Nordex SE - Segment focus
                • 12.13 ReGen Powertech Pvt. Ltd.
                  • ReGen Powertech Pvt. Ltd. - Overview
                  • ReGen Powertech Pvt. Ltd. - Product / Service
                  • ReGen Powertech Pvt. Ltd. - Key offerings
                • 12.14 Siemens AG
                  • Siemens AG - Overview
                  • Siemens AG - Business segments
                  • Siemens AG - Key news
                  • Siemens AG - Key offerings
                  • Siemens AG - Segment focus
                • 12.15 TERNA S.p.A.
                  • TERNA S.p.A. - Overview
                  • TERNA S.p.A. - Business segments
                  • TERNA S.p.A. - Key offerings
                  • TERNA S.p.A. - Segment focus
                • 12.16 Vestas Wind Systems AS
                  • Vestas Wind Systems AS - Overview
                  • Vestas Wind Systems AS - Business segments
                  • Vestas Wind Systems AS - Key offerings
                  • Vestas Wind Systems AS - Segment focus
                • 12.17 Xinjiang Goldwind Science and Technology Co. Ltd.
                  • Xinjiang Goldwind Science and Technology Co. Ltd. - Overview
                  • Xinjiang Goldwind Science and Technology Co. Ltd. - Business segments
                  • Xinjiang Goldwind Science and Technology Co. Ltd. - Key offerings
                  • Xinjiang Goldwind Science and Technology Co. Ltd. - Segment focus

                13 Appendix

                • 13.1 Scope of the report
                  • 13.2 Inclusions and exclusions checklist
                    • Inclusions checklist
                    • Exclusions checklist
                  • 13.3 Currency conversion rates for US$
                    • Currency conversion rates for US$
                  • 13.4 Research methodology
                    • Research methodology
                  • 13.5 Data procurement
                    • Information sources
                  • 13.6 Data validation
                    • Data validation
                  • 13.7 Validation techniques employed for market sizing
                    • Validation techniques employed for market sizing
                  • 13.8 Data synthesis
                    • Data synthesis
                  • 13.9 360 degree market analysis
                    • 360 degree market analysis
                  • 13.10 List of abbreviations
                    • List of abbreviations

                  Research Methodology

                  Technavio presents a detailed picture of the market by way of study, synthesis, and summation of data from multiple sources. The analysts have presented the various facets of the market with a particular focus on identifying the key industry influencers. The data thus presented is comprehensive, reliable, and the result of extensive research, both primary and secondary.

                  INFORMATION SOURCES

                  Primary sources

                  • Manufacturers and suppliers
                  • Channel partners
                  • Industry experts
                  • Strategic decision makers

                  Secondary sources

                  • Industry journals and periodicals
                  • Government data
                  • Financial reports of key industry players
                  • Historical data
                  • Press releases

                  DATA ANALYSIS

                  Data Synthesis

                  • Collation of data
                  • Estimation of key figures
                  • Analysis of derived insights

                  Data Validation

                  • Triangulation with data models
                  • Reference against proprietary databases
                  • Corroboration with industry experts

                  REPORT WRITING

                  Qualitative

                  • Market drivers
                  • Market challenges
                  • Market trends
                  • Five forces analysis

                  Quantitative

                  • Market size and forecast
                  • Market segmentation
                  • Geographical insights
                  • Competitive landscape

                  Interested in this report?

                  Get your sample now to see our research methodology and insights!

                  Download Now

                  Frequently Asked Questions

                  Onshore Wind Power Systems market growth will increase by $ 35.6 bn during 2024-2028.

                  The Onshore Wind Power Systems market is expected to grow at a CAGR of 5.11% during 2024-2028.

                  Onshore Wind Power Systems market is segmented by Technology( Wind turbine, T and D, Others) End-user( Electric power, Renewable energy, Oil and gas, Aviation, Others)

                  AB SKF, AEROVIDE GmbH, Belden Inc., Bora Energy, CS WIND Corp., Doosan Corp., Emergya Wind Technologies BV, ENERCON GmbH, Envision Energy USA Ltd., Fujikura Co. Ltd., General Electric Co., K2 Management, Nexans SA, Nordex SE, ReGen Powertech Pvt. Ltd., Siemens AG, Suzlon Energy Ltd., TERNA S.p.A., Vestas Wind Systems AS, Xinjiang Goldwind Science and Technology Co. Ltd. are a few of the key vendors in the Onshore Wind Power Systems market.

                  APAC will register the highest growth rate of 61% among the other regions. Therefore, the Onshore Wind Power Systems market in APAC is expected to garner significant business opportunities for the vendors during the forecast period.

                  China, US, Germany, Brazil, France

                  • Rising height and capacity of wind towersElectricity generation using the wind is extremely dependent on meteorological conditions. As the wind blows more steadily in higher altitudes is the driving factor this market.
                  • it has resulted in a tremendous increase in the wind tower height over the past few years. Along with the increased height of wind towers is the driving factor this market.
                  • the size of the rotors and blades has also increased is the driving factor this market.
                  • which has resulted in significant growth in the power-generating capacity of wind turbines. Thus is the driving factor this market.
                  • the increase in the height of wind towers increases the total production potential of wind turbines significantly when compared with wind towers of smaller heights. Moreover is the driving factor this market.
                  • in inland areas where wind turbulence is high is the driving factor this market.
                  • a greater hub height can result in better wind yield as wind turbulence decreases at higher altitudes. The rise in the height of wind towers has spurred investments in the wind power industry. As these high wind towers have the ability to produce more power from a single wind turbine is the driving factor this market.
                  • it leads to a reduction in the total number of turbines needed on a wind farm. The reduction in the number of turbines results in comparatively less capital expenditure and lowers the risks associated with project execution because of the less cycle time involved in the installation. Further is the driving factor this market.
                  • it also reduces the operational and maintenance costs for farm operators is the driving factor this market.
                  • thus lowering the cost of electricity generation and is the driving factor this market.
                  • ultimately is the driving factor this market.
                  • making the project more profitable. Additionally is the driving factor this market.
                  • the height of the wind turbines is expected to continue to increase further is the driving factor this market.
                  • owing to its various benefits. Taller turbines have better energy conversion rates and can access higher wind streams is the driving factor this market.
                  • which can increase the annual energy production (AEP) of such wind energy projects significantly. Therefore is the driving factor this market.
                  • the increase in electricity generation capacity and the lower LCOE benefits that are obtained as a result of the rise in the height of wind towers will continue to drive the growth of the market in focus during the forecast period. is the driving factor this market.

                  The Onshore Wind Power Systems market vendors should focus on grabbing business opportunities from the Wind turbine segment as it accounted for the largest market share in the base year.