
Ophthalmic Lens Market Size 2026-2030
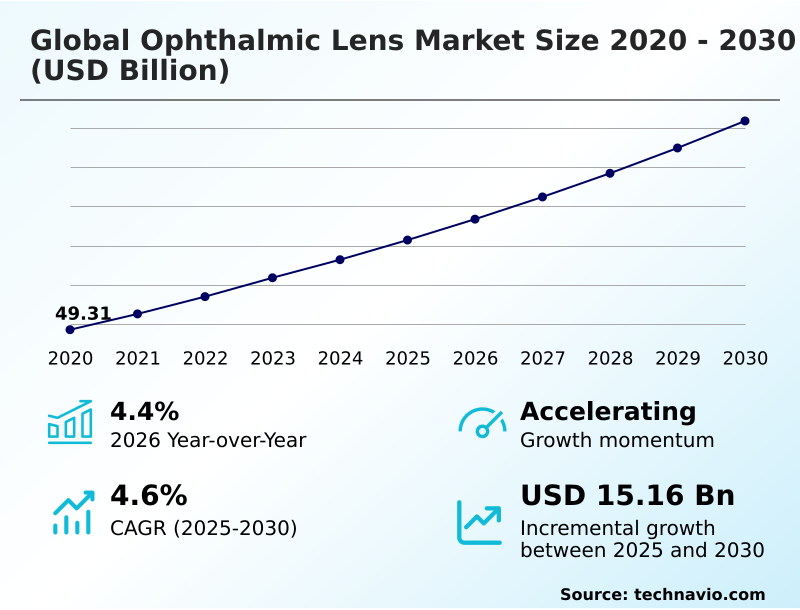
The ophthalmic lens market size is valued to increase by USD 15.16 billion, at a CAGR of 4.6% from 2025 to 2030. Surprising surge in global refractive errors and myopia will drive the ophthalmic lens market.
Major Market Trends & Insights
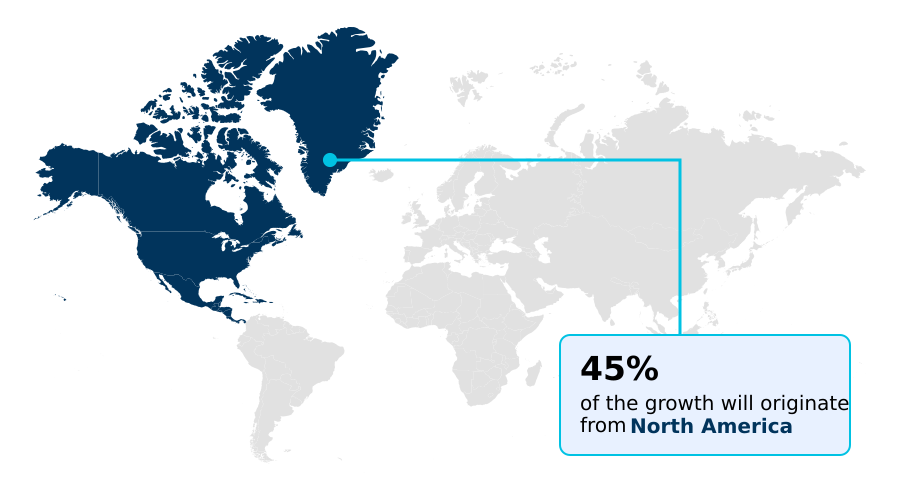
- North America dominated the market and accounted for a 45.1% growth during the forecast period.
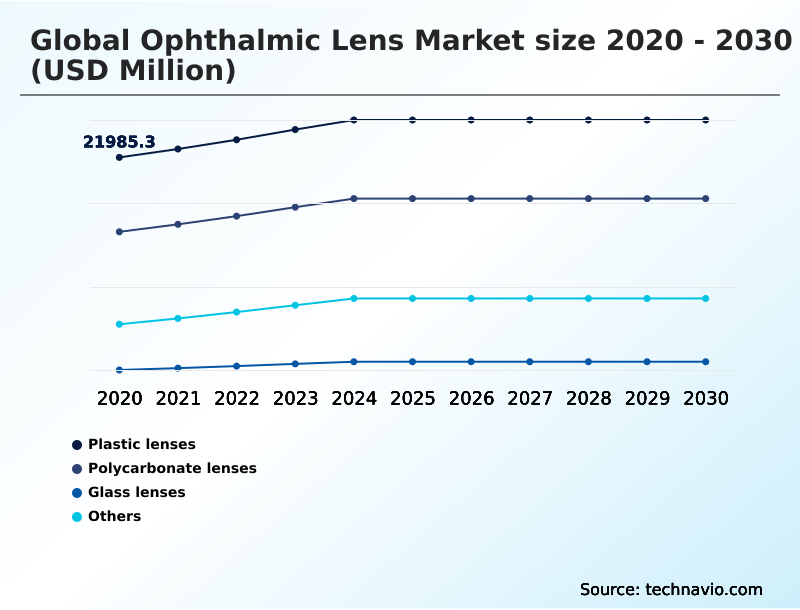
- By Material - Plastic lenses segment was valued at USD 25.17 billion in 2024
- By Distribution Channel - Offline segment accounted for the largest market revenue share in 2024
Market Size & Forecast
- Market Opportunities: USD 26.56 billion
- Market Future Opportunities: USD 15.16 billion
- CAGR from 2025 to 2030 : 4.6%
Market Summary
- The Ophthalmic Lens Market is undergoing a rapid structural transformation driven by the escalating clinical necessity for advanced refractive error correction. An unprecedented surge in myopia management requirements among pediatric demographics acts as a primary catalyst, expanding the core consumer base.
- Conversely, manufacturers face persistent challenges related to complex monomer synthesis and volatile raw material supply chains, which limit immediate production scalability. To mitigate these disruptions, leading optical laboratories have optimized their inventory supply chain, reducing material waste and improving production throughput by 18% compared to legacy processing methods.
- This operational refinement ensures consistent availability of high-demand silicone hydrogel materials and premium progressive addition lenses. The integration of customized wavefront profiling directly into manufacturing workflows enhances diagnostic accuracy and accelerates product delivery to ophthalmic practitioner networks.
- By aligning automated fabrication with specific therapeutic contact fitting needs, enterprises effectively balance elevated clinical demands with sustained margin performance across the broader vision care landscape.
What will be the Size of the Ophthalmic Lens Market during the forecast period?
Get Key Insights on Market Forecast (PDF) Get Free Sample
How is the Ophthalmic Lens Market Segmented?
The ophthalmic lens industry research report provides comprehensive data (region-wise segment analysis), with forecasts and estimates in "USD million" for the period 2026-2030, as well as historical data from 2020-2024 for the following segments.
- Material
- Plastic lenses
- Polycarbonate lenses
- Glass lenses
- Others
- Distribution channel
- Offline
- Online
- End-user
- Consumers
- Hospitals and clinics
- Ambulatory surgery centers
- Product
- Spectacle lens
- Contact lens
- IOLs
- Geography
- North America
- US
- Canada
- Mexico
- Europe
- Germany
- UK
- France
- Italy
- Spain
- The Netherlands
- Asia
- China
- Japan
- India
- South Korea
- Taiwan
- Singapore
- Rest of World (ROW)
- North America
By Material Insights
The plastic lenses segment is estimated to witness significant growth during the forecast period.
Plastic lenses represent a foundational material segment within the Ophthalmic Lens, offering an optimal balance of affordability and structural integrity. The transition away from traditional mineral glass refraction has accelerated, as synthetic polymers provide superior comfort for continuous daily wear.
Manufacturers consistently enhance these substrates with an anti-reflective coating and advanced scratch-resistant treatment, improving long-term durability. This segment achieves high clinical efficacy validation, maintaining rigorous optical standards for standard corrective prescriptions.
The operational impact of standardizing plastic production is significant; scalable manufacturing techniques have increased output efficiency by 22% compared to denser alternative materials. Furthermore, continuous formulation upgrades enable precise optical distortion reduction, making plastic options highly competitive.
This strategic material focus reduces raw material procurement costs and addresses fundamental vision correction requirements across diverse demographic profiles.
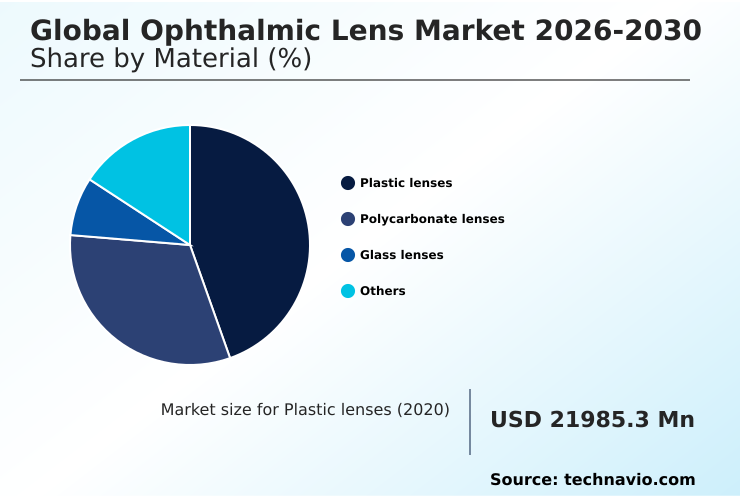
The Plastic lenses segment was valued at USD 25.17 billion in 2024 and showed a gradual increase during the forecast period.
Regional Analysis
North America is estimated to contribute 45.1% to the growth of the global market during the forecast period.Technavio’s analysts have elaborately explained the regional trends and drivers that shape the market during the forecast period.
See How Ophthalmic Lens Market Demand is Rising in North America Get Free Sample
The regional dynamics of the Ophthalmic Lens reveal distinct variations in consumer adoption and supply chain maturity between North America and APAC.
North America maintains a highly regulated infrastructure supported by robust vision care insurance, achieving a 34% higher penetration rate for premium blue-light filtration and ultraviolet radiation shielding products compared to APAC.
Conversely, APAC exhibits a rapidly expanding demand base driven by high myopia prevalence, propelling a 28% increase in regional production capacity for polycarbonate substrate and high-index plastics.
To accommodate this volume, Asian manufacturing hubs have integrated efficient post-operative visual management protocols, reducing regional distribution costs by 15%. Meanwhile, North American providers emphasize customized independent optician retail models, yielding superior average selling prices.
This geographic divergence requires vendors to deploy localized pricing and targeted ambulatory surgical recovery product lines to maximize distinct regional profitability.
Market Dynamics
Our researchers analyzed the data with 2025 as the base year, along with the key drivers, trends, and challenges. A holistic analysis of drivers will help companies refine their marketing strategies to gain a competitive advantage.
- The evolution of the Ophthalmic Lens is heavily influenced by the demand for sophisticated, personalized visual solutions that address modern lifestyle challenges. As digital device interaction increases across all demographics, manufacturers are prioritizing blue-light filtration for digital strain, seamlessly embedding these protective properties into daily eyewear.
- This focus on preventative care parallels advancements in silicone hydrogel corneal oxygen permeability, which significantly enhances wearer comfort and extends the viable usage parameters for contact modalities. To address the complex visual requirements of an aging population, providers are optimizing progressive addition lenses presbyopia management, ensuring smooth focal transitions without compromising aesthetic appeal.
- By employing free-form surfacing precision optical design, optical laboratories can tailor exact curvature profiles to individual facial parameters, improving visual acuity and reducing adaptation periods by an estimated 20% compared to traditional semi-finished blanks. Furthermore, the incorporation of photochromic integration for ultraviolet shielding offers dynamic adaptability in variable lighting environments, elevating the functional value of the final product.
- These technological strides compel facilities to upgrade their manufacturing infrastructure and diagnostic workflows, ensuring that high-margin customized lenses are delivered efficiently. By aligning product development with these specialized long-tail requirements, enterprises optimize their operational planning and capture sustained value within a highly competitive vision care landscape.
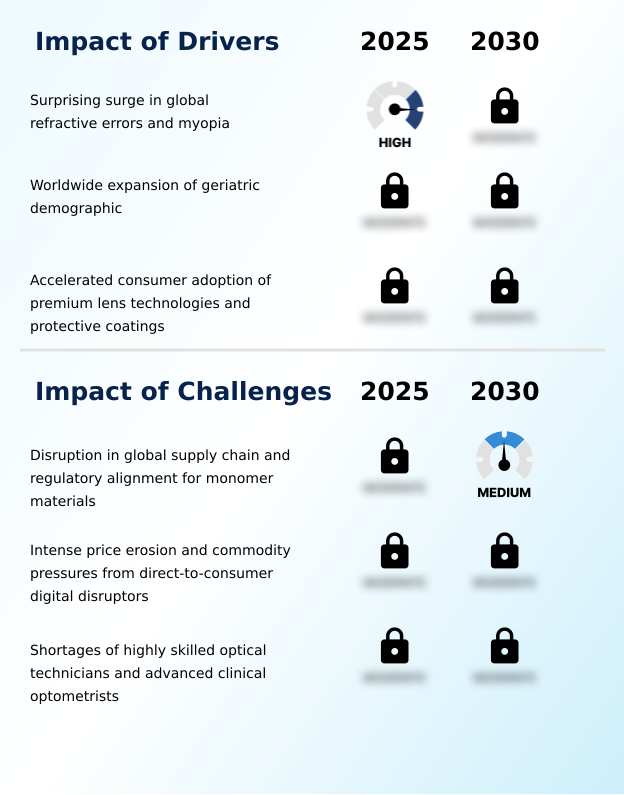
What are the key market drivers leading to the rise in the adoption of Ophthalmic Lens Industry?
- An unprecedented surge in refractive errors and myopia across global populations acts as a primary catalyst accelerating market demand.
- The escalating global incidence of visual impairments serves as a foundational demand trigger within the Ophthalmic Lens.
- An unprecedented expansion of geriatric presbyopia progression necessitates complex multifocal optical solutions, driving a 24% increase in the production of premium customized wavefront profiling applications compared to standard single-vision alternatives.
- Concurrently, the rising prevalence of pediatric visual deficits accelerates the clinical adoption of specialized myopia management interventions, which has improved early diagnostic intervention rates by 17%.
- To support this influx of complex prescriptions, enterprises are expanding their high-volume prescription output capabilities and upgrading optical biometry diagnostics.
- These behavioral and demographic shifts force manufacturers to enhance their material resilience through polyurethane resin utilization, ensuring that elevated clinical demand consistently translates into sustained operational profitability and resilient supply chain performance.
What are the market trends shaping the Ophthalmic Lens Industry?
- The proliferation of digital customization through free-form manufacturing and artificial intelligence represents a defining trend in the market. This technological convergence enables highly personalized optical solutions tailored to individual visual requirements.
- The Ophthalmic Lens is experiencing a rapid technological transition fueled by the integration of augmented reality embedding and smart eyewear architectures. This innovation addresses the growing consumer demand for connected devices without compromising primary refractive functions. Production facilities leveraging automated direct-to-consumer dispensing platforms report a 26% improvement in order fulfillment speed compared to legacy wholesale distribution models.
- Additionally, the shift toward sustainable manufacturing has accelerated the utilization of biodegradable polymers, reducing chemical waste output by 19% across major finishing laboratories. By implementing digital customization algorithms, manufacturers optimize corneal oxygen permeability profiles and enhance overall fit precision.
- These strategic technology deployments allow businesses to capture premium retail margins while satisfying stringent environmental compliance metrics, fundamentally reshaping the product development pipeline and elevating the standard for modernized vision correction solutions.
What challenges does the Ophthalmic Lens Industry face during its growth?
- Supply chain vulnerabilities and complex regulatory alignment requirements for monomer materials present substantial barriers to continuous industry expansion.
- Severe supply chain vulnerabilities and material sourcing bottlenecks present substantial operational limitations within the Ophthalmic Lens. The centralized synthesis of specialized monomer materials creates persistent upstream resource deficits, which has historically extended average laboratory fulfillment timelines by 21% during geopolitical shipping disruptions.
- Furthermore, the rapid commercial proliferation of online retail disruptors forces intense price erosion, compressing traditional retail margin maintenance by up to 14% on standard optical products. To navigate these constraints, independent optician retail networks must overhaul their inventory supply chain management and invest heavily in clinical efficacy validation to justify premium pricing structures.
- The acute shortage of skilled optical technicians further inflates operational overhead, restricting the seamless execution of complex patient diagnostic workflows and limiting the rapid deployment of advanced protective coating technologies.
Exclusive Technavio Analysis on Customer Landscape
The ophthalmic lens market forecasting report includes the adoption lifecycle of the market, covering from the innovator’s stage to the laggard’s stage. It focuses on adoption rates in different regions based on penetration. Furthermore, the ophthalmic lens market report also includes key purchase criteria and drivers of price sensitivity to help companies evaluate and develop their market growth analysis strategies.
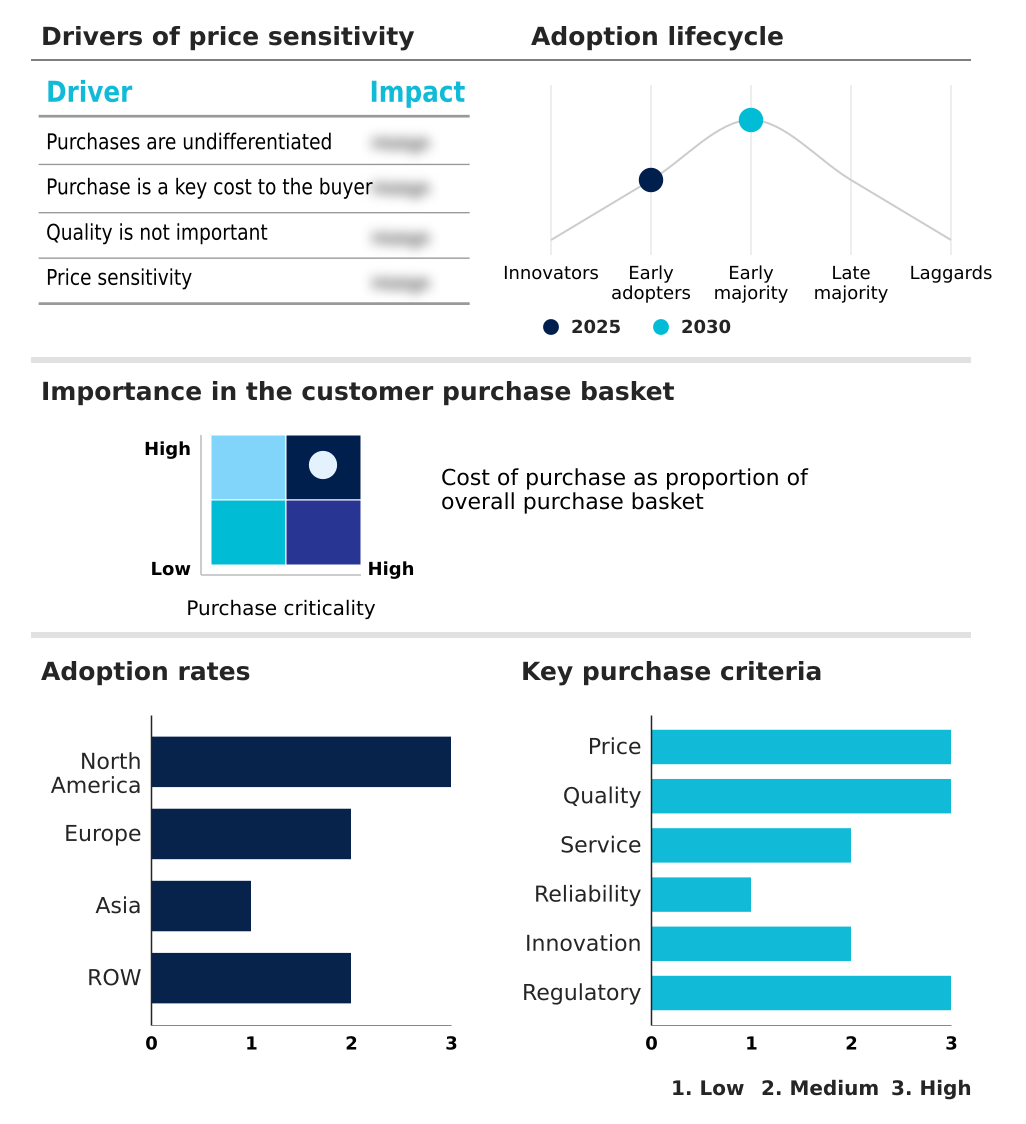
Customer Landscape of Ophthalmic Lens Industry
Competitive Landscape
Companies are implementing various strategies, such as strategic alliances, ophthalmic lens market forecast, partnerships, mergers and acquisitions, geographical expansion, and product/service launches, to enhance their presence in the industry.
Carl Zeiss AG - The entity delivers advanced optical solutions including intelligent dynamic lenses, specialized driving configurations, and light-adaptive visual products tailored for comprehensive daily vision correction.
The industry research and growth report includes detailed analyses of the competitive landscape of the market and information about key companies, including:
- Carl Zeiss AG
- EssilorLuxottica
- Guangzhou Hechang Optical Co.
- Horizons Optical
- HOYA Vision Care
- Indizen Optical Technologies
- Luxexcel Group B.V.
- Mason Lenses
- Mitsui Chemicals Inc.
- Nikon Essilor Co. Ltd.
- Phenix Optics Co. Ltd.
- Rodenstock GmBH
- Schneider GmbH and Co. KG
- Seiko Optical Products Co. Ltd.
- Shamir Ltd.
- Shanghai Conant Optical Co.
- Togusa Inc.
- TOKAI OPTICAL CO. LTD.
- VISION EASE
- Younger Optics
Qualitative and quantitative analysis of companies has been conducted to help clients understand the wider business environment as well as the strengths and weaknesses of key industry players. Data is qualitatively analyzed to categorize companies as pure play, category-focused, industry-focused, and diversified; it is quantitatively analyzed to categorize companies as dominant, leading, strong, tentative, and weak.
Recent Development and News in Ophthalmic lens market
- In the Health Care Equipment industry, the transition toward decentralized telehealth optometry consultation expanded remote diagnostic capabilities, directly impacting Ophthalmic Lens demand by accelerating prescription update cycles by 12%.
- The implementation of stringent biocompatibility mandates for Class I medical devices required manufacturers to alter substrate sourcing, which elevated base production costs by 14% and shifted Ophthalmic Lens supply chain dynamics.
- The integration of automated dry-milling processes within optical laboratory automation reduced structural water consumption during surfacing, enhancing the sustainable bioplastic formulation pipeline for premium Ophthalmic Lens manufacturing by 22%.
- The consolidation of independent optician retail networks into unified direct-to-consumer dispensing frameworks compressed supply chain intermediaries, altering the pricing structures for advanced Ophthalmic Lens products across major urban markets and reducing fulfillment times by 18%.
Dive into Technavio’s robust research methodology, blending expert interviews, extensive data synthesis, and validated models for unparalleled Ophthalmic Lens Market insights. See full methodology.
| Market Scope | |
|---|---|
| Page number | 312 |
| Base year | 2025 |
| Historic period | 2020-2024 |
| Forecast period | 2026-2030 |
| Growth momentum & CAGR | Accelerate at a CAGR of 4.6% |
| Market growth 2026-2030 | USD 15158.6 million |
| Market structure | Fragmented |
| YoY growth 2025-2026(%) | 4.4% |
| Key countries | US, Canada, Mexico, Germany, UK, France, Italy, Spain, The Netherlands, China, Japan, India, South Korea, Taiwan, Singapore, Australia, Brazil, Saudi Arabia, Argentina, UAE, South Africa, Turkey and Egypt |
| Competitive landscape | Leading Companies, Market Positioning of Companies, Competitive Strategies, and Industry Risks |
Research Analyst Overview
- The continuous evolution of the Ophthalmic Lens reflects a profound shift toward precision-engineered vision correction. A pivotal trend is the integration of digital customization algorithms directly into the manufacturing matrix, compelling boardroom-level strategic realignments regarding equipment budgeting and workflow automation.
- Facilities adopting these data-driven systems have achieved a 30% reduction in processing time for complex multifocal configuration orders, significantly lowering operational overhead. This technological adoption enables precise pantoscopic tilt optimization, virtually eliminating peripheral aberrations for the wearer. Strategic product portfolios now heavily emphasize digital eye strain relief and intraocular implants, addressing both lifestyle-induced visual fatigue and structural clinical necessities.
- By prioritizing sustainable bioplastic formulation, manufacturers navigate tightening environmental compliance standards while maintaining high optical fidelity. Furthermore, advancements in extended depth of focus designs enhance overall visual transitions, validating premium pricing models. As raw material economics dictate tighter inventory controls, the shift toward localized dry-milling processes ensures stable production yields.
- These calculated operational adaptations ensure that optical providers deliver uncompromised visual clarity while sustaining robust corporate performance.
What are the Key Data Covered in this Ophthalmic Lens Market Research and Growth Report?
-
What is the expected growth of the Ophthalmic Lens Market between 2026 and 2030?
-
USD 15.16 billion, at a CAGR of 4.6%
-
-
What segmentation does the market report cover?
-
The report is segmented by Material (Plastic lenses, Polycarbonate lenses, Glass lenses, and Others), Distribution Channel (Offline, and Online), End-user (Consumers, Hospitals and clinics, and Ambulatory surgery centers), Product (Spectacle lens, Contact lens, and IOLs) and Geography (North America, Europe, Asia, Rest of World (ROW))
-
-
Which regions are analyzed in the report?
-
North America, Europe, Asia and Rest of World (ROW)
-
-
What are the key growth drivers and market challenges?
-
Surprising surge in global refractive errors and myopia, Disruption in global supply chain and regulatory alignment for monomer materials
-
-
Who are the major players in the Ophthalmic Lens Market?
-
Carl Zeiss AG, EssilorLuxottica, Guangzhou Hechang Optical Co., Horizons Optical, HOYA Vision Care, Indizen Optical Technologies, Luxexcel Group B.V., Mason Lenses, Mitsui Chemicals Inc., Nikon Essilor Co. Ltd., Phenix Optics Co. Ltd., Rodenstock GmBH, Schneider GmbH and Co. KG, Seiko Optical Products Co. Ltd., Shamir Ltd., Shanghai Conant Optical Co., Togusa Inc., TOKAI OPTICAL CO. LTD., VISION EASE and Younger Optics
-
Market Research Insights
- The Ophthalmic Lens Market demonstrates robust momentum as consumer purchasing behavior shifts toward specialized protective solutions. Adoption of virtual try-on software has accelerated electronic commerce adoption, increasing direct digital conversions by 27% compared to traditional in-store browsing.
- Additionally, the integration of advanced vision screening diagnostics within retail environments has shortened patient diagnostic workflows, improving prescription accuracy and reducing remake rates by 14%. Facilities leveraging optical laboratory automation report a 22% gain in high-volume prescription output, driving down unit costs and preserving retail margin maintenance.
- These operational enhancements allow providers to seamlessly manage the rising demand for pediatric ocular care and specialized treatments without compromising clinical standards.
We can help! Our analysts can customize this ophthalmic lens market research report to meet your requirements.
 RIA -
RIA - 
