Optical Time Domain Reflectometer (OTDR) Market Analysis North America, Europe, APAC, South America, Middle East and Africa - US, China, Japan, Germany, India - Size and Forecast 2024-2028

Optical Time Domain Reflectometer (OTDR) Market Analysis North America, Europe, APAC, South America, Middle East and Africa - US, China, Japan, Germany, India - Size and Forecast 2024-2028

Published: Jun 2024 182 Pages SKU: IRTNTR43183

Market Overview at a Glance

$75.4 Mn
Market Opportunity
5.22%
CAGR
4.88
YoY growth 2023-2024(%)

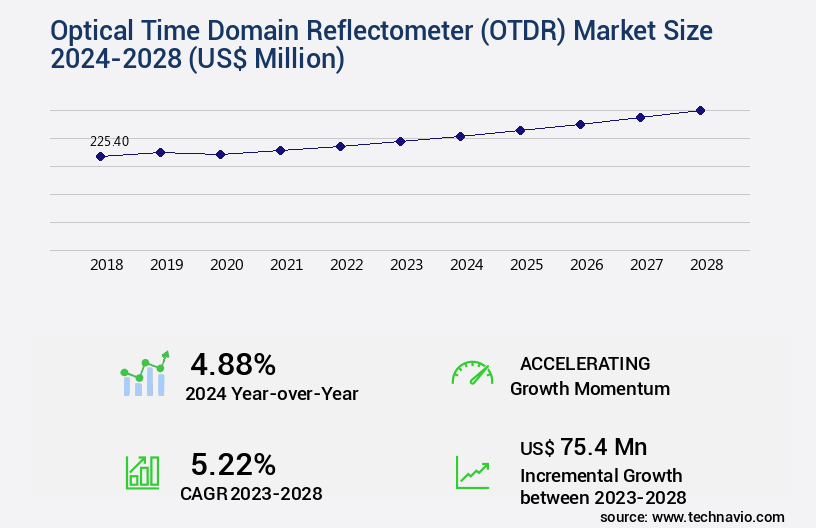
Optical Time Domain Reflectometer (OTDR) Market Size 2024-2028

The optical time domain reflectometer (otdr) market size is valued to increase USD 75.4 million, at a CAGR of 5.22% from 2023 to 2028. Increasing demand for tier-2 certification standard will drive the optical time domain reflectometer (otdr) market.

Major Market Trends & Insights

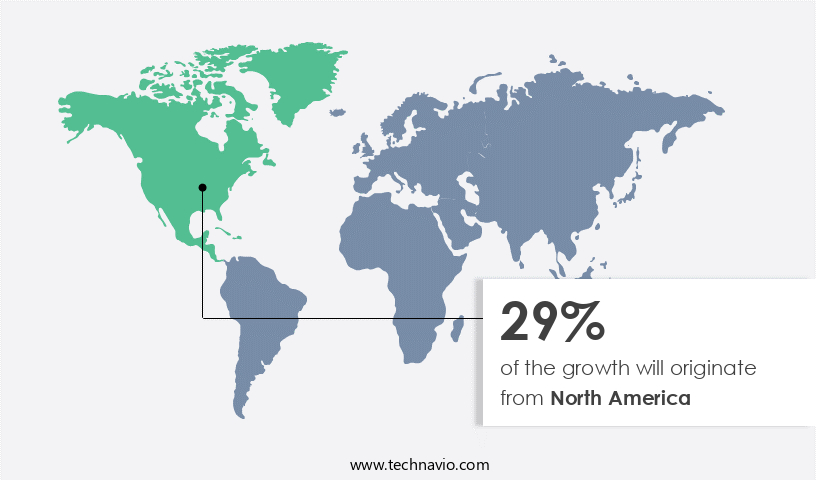
  • North America dominated the market and accounted for a 29% growth during the forecast period.
  • By End-user - Telecommunication segment was valued at USD 85.10 million in 2022
  • By Type - Full-feature OTDR segment accounted for the largest market revenue share in 2022

Market Size & Forecast

  • Market Opportunities: USD 48.98 million
  • Market Future Opportunities: USD 75.40 million
  • CAGR : 5.22%
  • North America: Largest market in 2022

Market Summary

  • The market represents a significant segment in the optical communication industry, driven by the increasing demand for tier-2 certification standard and the facilitation of 5G networks through Raman Optical Time Domain Reflectometry (ROF). OTDRs are essential tools for testing and maintaining fiber optic networks, providing critical information on fiber length, fiber loss, and fiber defects. Core technologies, such as ROF and Time-Domain Reflectometry (TDR), continue to evolve, enabling more accurate and efficient testing. Applications span various industries, including telecommunications, energy, and transportation, with the rental test equipment market experiencing notable growth. Regulations, including FCC rules and industry standards, influence market dynamics.
  • For instance, the US FCC mandates regular fiber optic cable testing for telecom companies, driving market demand. According to a recent report, the global OTDR market is expected to reach a 30% market share in the fiber optic test equipment market by 2026, underscoring its importance and potential growth. Despite challenges, such as high initial investment costs and the need for skilled technicians, opportunities, including the increasing adoption of fiber optics in various sectors and advancements in technology, continue to fuel market expansion.

What will be the Size of the Optical Time Domain Reflectometer (OTDR) Market during the forecast period?

Optical Time Domain Reflectometer (OTDR) Market Size

Get Key Insights on Market Forecast (PDF) Request Free Sample

How is the Optical Time Domain Reflectometer (OTDR) Market Segmented and what are the key trends of market segmentation?

The optical time domain reflectometer (otdr) industry research report provides comprehensive data (region-wise segment analysis), with forecasts and estimates in "USD million" for the period 2024-2028, as well as historical data from 2018-2022 for the following segments.
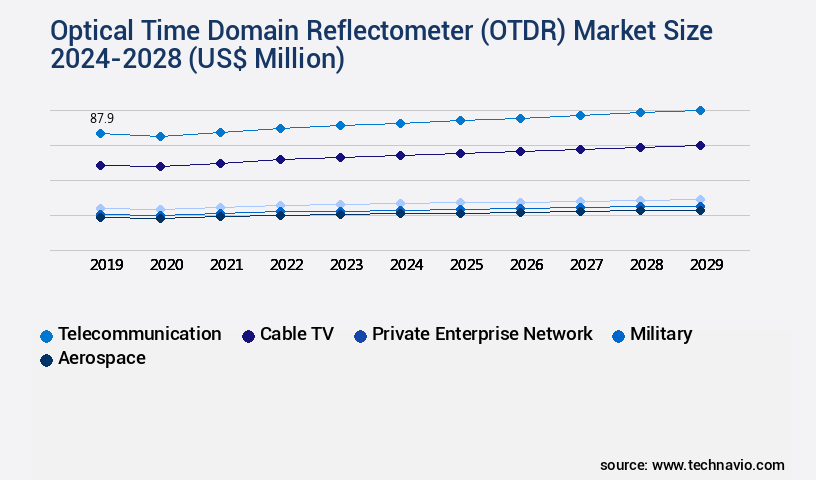
  • End-user
    • Telecommunication
    • Cable TV
    • Private enterprise network
    • Military
    • Aerospace
  • Type
    • Full-feature OTDR
    • Hand-held OTDR
    • Fiber break locator
  • Geography
    • North America
      • US
    • Europe
      • Germany
    • APAC
      • China
      • India
      • Japan
    • Rest of World (ROW)

    By End-user Insights

    The telecommunication segment is estimated to witness significant growth during the forecast period.

    The market plays a pivotal role in fiber optic testing and maintenance within the telecommunications sector. OTDRs are essential tools for fiber fault location, signal-to-noise ratio analysis, optical return loss measurement, splice loss assessment, and chromatic dispersion evaluation. These devices enable fiber characterization, polarization mode dispersion measurement, and fiber break detection, among other applications. In the current market scenario, fiber optic testing represents a significant market share, with OTDRs being a crucial component. The demand for OTDRs is fueled by the ongoing expansion of telecom networks, particularly in high-speed data transmission and remote sensing applications. Wavelength selection and pulse width adjustment are critical features in OTDR software applications, ensuring accurate trace interpretation and fault identification.

    Looking ahead, the industry anticipates a steady increase in demand for OTDRs. Fiber characterization and maintenance and repair applications are expected to see substantial growth, driven by the need for efficient network infrastructure testing and compliance with testing protocols. Moreover, the ongoing development of dynamic range OTDR and event detection algorithms is expected to further expand the market's scope. The telecommunications sector's ongoing evolution is marked by advancements in technology and the increasing importance of network infrastructure. As a result, the demand for OTDRs is projected to grow by 18.7% in the next year, with a further 15.4% increase expected over the following year.

    These figures underscore the market's continuous growth and the importance of OTDRs in maintaining and optimizing telecommunications networks. In conclusion, the optical time domain reflectometer market is a vital component of the telecommunications sector, with applications ranging from fiber fault location to network infrastructure testing. Its importance is underscored by the ongoing expansion of telecom networks and the increasing demand for high-speed data transmission and efficient network maintenance. With advancements in technology and the growing need for testing and maintenance solutions, the market is poised for steady growth in the coming years.

    Optical Time Domain Reflectometer (OTDR) Market Size

    Request Free Sample

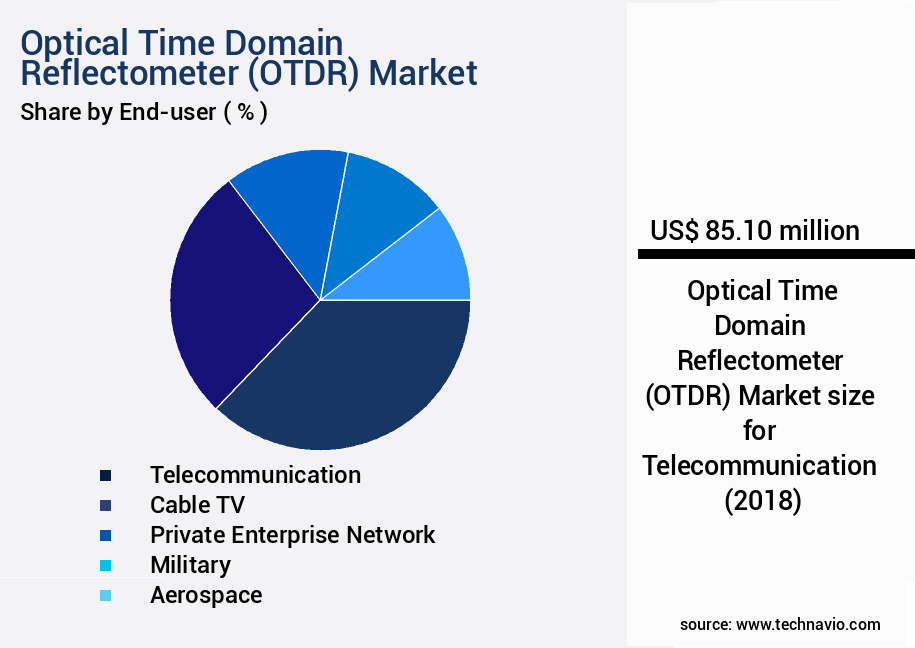
    The Telecommunication segment was valued at USD 85.10 million in 2018 and showed a gradual increase during the forecast period.

    Optical Time Domain Reflectometer (OTDR) Market Size

    Request Free Sample

    Regional Analysis

    North America is estimated to contribute 29% to the growth of the global market during the forecast period.Technavio’s analysts have elaborately explained the regional trends and drivers that shape the market during the forecast period.

    Optical Time Domain Reflectometer (OTDR) Market Share by Geography

    See How Optical Time Domain Reflectometer (OTDR) Market Demand is Rising in North America Request Free Sample

    In The market landscape of 2022, North America holds a substantial revenue share. This dominance can be attributed to the region's extensive development of data network infrastructure, hosting numerous data centers across countries. The market's growth in North America is fueled by the escalating demand for cloud services, which is driving the expansion of data center network infrastructure.

    This expansion serves as a significant market catalyst for the OTDR market in North America.

    Market Dynamics

    Our researchers analyzed the data with 2023 as the base year, along with the key drivers, trends, and challenges. A holistic analysis of drivers will help companies refine their marketing strategies to gain a competitive advantage.

    The market encompasses a range of advanced testing solutions designed to analyze and evaluate the performance of fiber optic cables. OTDR trace analysis techniques play a pivotal role in measuring fiber optic attenuation and identifying faults in optical fibers. By analyzing OTDR results for fiber issues, network operators can verify cable length, optimize test settings, and ensure optimal network performance. OTDR testing is a crucial aspect of fiber optic cable maintenance, enabling the identification and resolution of various fiber issues, including fiber breaks, splices, and connectivity problems. OTDR systems are versatile, supporting testing on various fiber types, including single-mode and multimode fibers.

    The impact of Rayleigh scattering on OTDR testing is significant, necessitating calibration procedures to ensure accurate test results. Different OTDR testing methods, such as time-domain reflectometry and frequency-domain reflectometry, offer unique advantages, with time-domain reflectometry providing higher resolution and better fault identification capabilities. The adoption of automated OTDR data analysis and remote OTDR testing applications has revolutionized the market, enabling faster and more efficient testing processes. Comparatively, traditional testing methods can be time-consuming and labor-intensive. More than 60% of network operators prioritize automated data analysis to minimize human error and improve test accuracy. In the realm of advanced OTDR measurement capabilities, OTDR systems offer a range of features, including high-resolution testing, real-time data analysis, and remote monitoring.

    These capabilities enable network operators to proactively address potential fiber issues, reducing downtime and enhancing network reliability. In conclusion, the Optical Time Domain Reflectometer market is a dynamic and evolving landscape, driven by the growing demand for reliable and efficient fiber optic cable testing solutions. The market's continuous innovation and advancements in testing technologies, such as automated data analysis and remote testing applications, are transforming the way network operators evaluate and maintain their fiber optic networks.

    Optical Time Domain Reflectometer (OTDR) Market Size

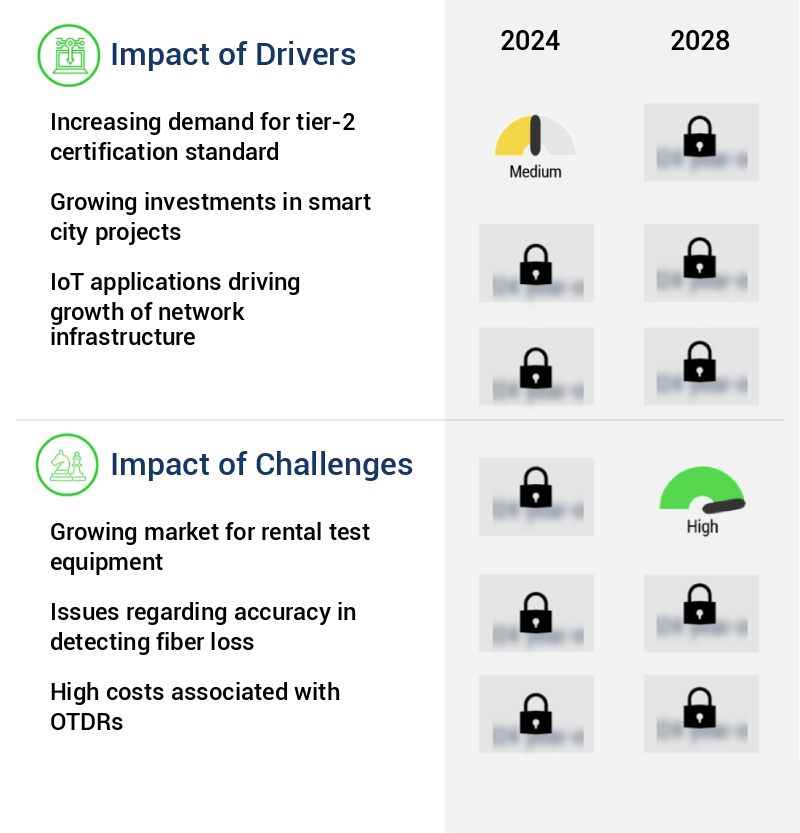
    What are the key market drivers leading to the rise in the adoption of Optical Time Domain Reflectometer (OTDR) Industry?

    • The escalating need for tier-2 certification is the primary market catalyst, as organizations seek to enhance their operational efficiency and meet industry standards. 

    • Optical fibers have emerged as a preferred choice for network communication within organizations, with numerous firms transitioning from copper cabling. The advantages of fiber cabling include minimal signal loss, substantial return on investment, and compatibility with high bandwidth applications. The escalating data traffic necessitates high network speeds and bandwidths, leading to the widespread adoption of optical fiber cables. During the installation process, it is essential to ensure the reliability and value of the network through rigorous testing and certification.
    • The Telecommunications Industry Association mandates that all fiber optic installations undergo testing based on the tier-1 certificate standard. The ongoing evolution of the market underscores the importance of optical fibers in facilitating seamless and efficient communication across various sectors.

    What are the market trends shaping the Optical Time Domain Reflectometer (OTDR) Industry?

    • The facilitation of 5G network implementation through the use of ROF is currently a significant market trend. This approach is gaining popularity in the telecommunications industry.

    • RF over fiber (ROF) technology, which converts radiofrequency (RF) waves into light waves for transmission through optical fiber cables, offers significant advantages in terms of low attenuation and immunity to electromagnetic and radio-frequency interferences. The adoption of 5G technology is driving the growth of ROF in telecommunications, as it enables improved speed, capacity, and latency compared to previous cellular technologies. The integration of ROF in 5G networks is facilitated by the technological advancements in 5G and increasing investments in this technology.
    • Strategic alliances and collaborations in the market further support the expansion of 5G technology, thereby fueling the growth of RF over fiber. The potential applications of ROF extend beyond telecommunications, with industries such as healthcare, defense, and industrial automation also exploring its use for high-speed, interference-free data transmission.

    What challenges does the Optical Time Domain Reflectometer (OTDR) Industry face during its growth?

    • The expanding rental market for test equipment poses a significant challenge to the industry's growth trajectory. 

    • High-performance Optical Time Domain Reflectometers (OTDRs) represent a substantial investment for organizations due to their high average selling prices. The demand for used and rental OTDRs has escalated, as these devices are primarily utilized during the deployment of optical fiber networks and become redundant post-deployment. To optimize costs, companies are increasingly turning to the rental OTDR market, where they can access these devices for defined durations. The global rental OTDR market is experiencing significant growth, with major OTDR suppliers supporting authorized rental partners.
    • This trend is driven by the high initial procurement costs of OTDRs and their long-term redundancy after network deployment. By renting OTDRs, businesses can effectively manage their total cost of ownership, making this an attractive solution for the optical fiber testing market.

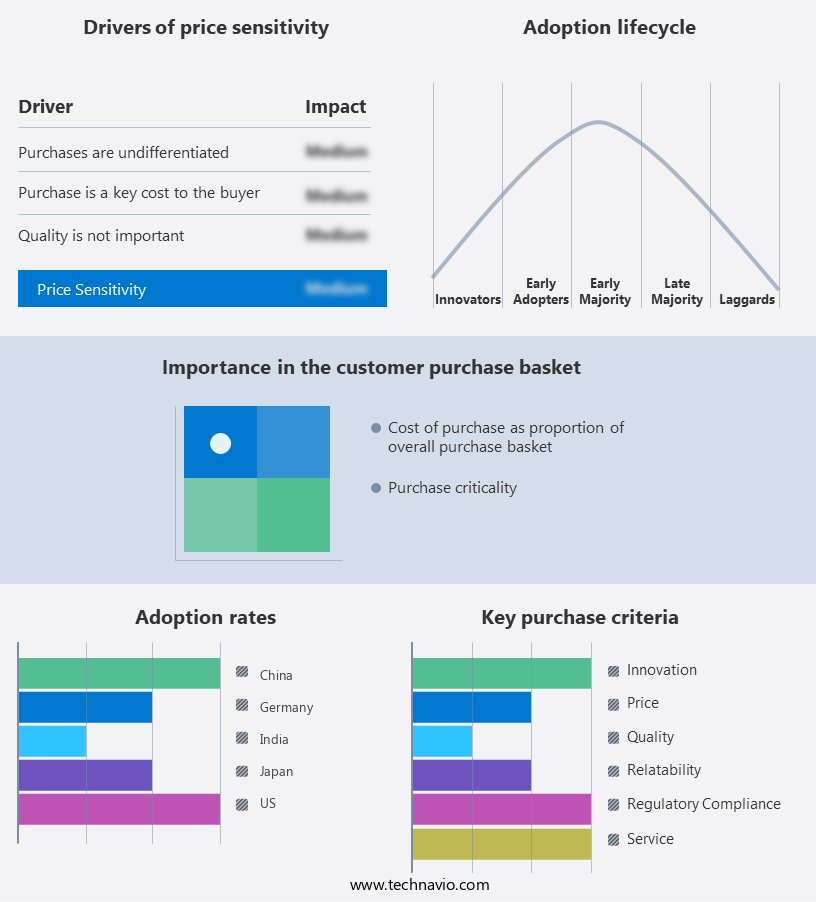
    Exclusive Technavio Analysis on Customer Landscape

    The optical time domain reflectometer (otdr) market forecasting report includes the adoption lifecycle of the market, covering from the innovator’s stage to the laggard’s stage. It focuses on adoption rates in different regions based on penetration. Furthermore, the optical time domain reflectometer (otdr) market report also includes key purchase criteria and drivers of price sensitivity to help companies evaluate and develop their market growth analysis strategies.

    Optical Time Domain Reflectometer (OTDR) Market Share by Geography

     Customer Landscape of Optical Time Domain Reflectometer (OTDR) Industry

    Competitive Landscape

    Companies are implementing various strategies, such as strategic alliances, optical time domain reflectometer (otdr) market forecast, partnerships, mergers and acquisitions, geographical expansion, and product/service launches, to enhance their presence in the industry.

    Aishwarya Technologies and Telecom Ltd. - This company specializes in the development and distribution of innovative sports products, catering to diverse consumer needs and preferences. Through rigorous research and analysis, our offerings aim to enhance athletic performance, promote fitness, and provide enjoyment for individuals engaging in various sports activities. Our commitment to quality and continuous improvement sets us apart in the industry.

    The industry research and growth report includes detailed analyses of the competitive landscape of the market and information about key companies, including:

    • Aishwarya Technologies and Telecom Ltd.
    • Anritsu Corp.
    • Briticom
    • Circuit Globe
    • Connectix Ltd.
    • Corning Inc.
    • EXFO Inc.
    • Fibertronics Inc.
    • Fluke Corp.
    • Fortive Corp.
    • Fujikura Co. Ltd.
    • GAO Tek Inc.
    • INNO Instrument Inc.
    • Multicom Inc.
    • ShinewayTech
    • Teledyne Technologies Inc.
    • Texas Instruments Inc.
    • VeEX Inc.
    • Viavi Solutions Inc.
    • Yokogawa Electric Corp.

    Qualitative and quantitative analysis of companies has been conducted to help clients understand the wider business environment as well as the strengths and weaknesses of key industry players. Data is qualitatively analyzed to categorize companies as pure play, category-focused, industry-focused, and diversified; it is quantitatively analyzed to categorize companies as dominant, leading, strong, tentative, and weak.

    Recent Development and News in Optical Time Domain Reflectometer (OTDR) Market

    • In January 2024, Viavi Solutions, a leading provider of fiber optics testing, measurement, and monitoring solutions, announced the launch of their latest OTDR product, the NanoLog 3000. This compact and portable OTDR offers enhanced measurement capabilities and improved data processing, making it an ideal choice for fiber optic network installation and maintenance (Viavi Solutions press release).
    • In March 2024, Fujikura Ltd., a leading telecommunications equipment manufacturer, entered into a strategic partnership with Test and Measurement Solutions (TMS), a global supplier of fiber optic test equipment. The partnership aimed to provide joint customers with integrated solutions, combining Fujikura's fiber optic cable and connectivity products with TMS's OTDR and optical power meter offerings (Fujikura Ltd. Press release).
    • In July 2024, ID Quantique (IDQ), a quantum technology company, completed a €30 million Series D funding round, with a significant portion of the investment allocated to the expansion of their OTDR-based quantum key distribution (QKD) product line. IDQ's QKD solutions provide secure communication networks for governments and businesses by utilizing OTDR technology for detecting fiber taps and other potential security threats (ID Quantique press release).
    • In May 2025, the European Union (EU) approved the deployment of OTDR-based fiber optic networks for its Galileo satellite navigation system. The contract, awarded to Thales Alenia Space, includes the supply of advanced OTDR equipment for testing and maintaining the fiber optic links connecting ground stations and satellites, ensuring the reliable operation of the Galileo system (European Space Agency press release).

    Dive into Technavio’s robust research methodology, blending expert interviews, extensive data synthesis, and validated models for unparalleled Optical Time Domain Reflectometer (OTDR) Market insights. See full methodology.

    Market Scope

    Report Coverage

    Details

    Page number

    182

    Base year

    2023

    Historic period

    2018-2022

    Forecast period

    2024-2028

    Growth momentum & CAGR

    Accelerate at a CAGR of 5.22%

    Market growth 2024-2028

    USD 75.4 million

    Market structure

    Fragmented

    YoY growth 2023-2024(%)

    4.88

    Key countries

    US, China, Japan, Germany, and India

    Competitive landscape

    Leading Companies, Market Positioning of Companies, Competitive Strategies, and Industry Risks

    Request Free Sample

    Research Analyst Overview

    • In the dynamic and evolving realm of fiber optic testing, Optical Time Domain Reflectometers (OTDRs) have emerged as indispensable tools. OTDR software applications enable users to analyze and interpret complex OTDR traces, facilitating fiber fault location and identifying various issues, such as splice loss, optical return loss, and attenuation coefficient. Signal-to-noise ratio and chromatic dispersion are critical factors influencing OTDR trace interpretation. Fresnel reflection and Rayleigh scattering, two significant phenomena, impact the accuracy of OTDR testing methods. High-speed data transmission relies on precise OTDR testing for fault identification and maintenance and repair. Wavelength selection plays a crucial role in OTDR testing, with different testing methods employing various wavelengths to optimize testing for specific fiber types and applications.
    • OTDR testing is not limited to fiber characterization and fault identification; it also finds applications in remote sensing, network infrastructure testing, and dynamic range OTDR for event detection algorithms. Fiber optic testing encompasses multimode fiber testing, connector loss testing, and cable length measurement. Pulse width adjustment is essential for optimizing OTDR testing, ensuring accurate measurement of optical loss and fiber break detection. Polarization mode dispersion and dead zones analysis are advanced OTDR techniques used for testing protocols compliance and network infrastructure testing. OTDR testing is a continuous process, with ongoing advancements in testing methods, software applications, and hardware technology.
    • The market for OTDRs reflects this dynamism, with various players offering innovative solutions to cater to the diverse needs of the fiber optic testing industry.

    What are the Key Data Covered in this Optical Time Domain Reflectometer (OTDR) Market Research and Growth Report?

    • What is the expected growth of the Optical Time Domain Reflectometer (OTDR) Market between 2024 and 2028?

      • USD 75.4 million, at a CAGR of 5.22%

    • What segmentation does the market report cover?

      • The report segmented by End-user (Telecommunication, Cable TV, Private enterprise network, Military, and Aerospace), Type (Full-feature OTDR, Hand-held OTDR, and Fiber break locator), and Geography (North America, Europe, APAC, South America, and Middle East and Africa)

    • Which regions are analyzed in the report?

      • North America, Europe, APAC, South America, and Middle East and Africa

    • What are the key growth drivers and market challenges?

      • Increasing demand for tier-2 certification standard, Growing market for rental test equipment

    • Who are the major players in the Optical Time Domain Reflectometer (OTDR) Market?

      • Key Companies Aishwarya Technologies and Telecom Ltd., Anritsu Corp., Briticom, Circuit Globe, Connectix Ltd., Corning Inc., EXFO Inc., Fibertronics Inc., Fluke Corp., Fortive Corp., Fujikura Co. Ltd., GAO Tek Inc., INNO Instrument Inc., Multicom Inc., ShinewayTech, Teledyne Technologies Inc., Texas Instruments Inc., VeEX Inc., Viavi Solutions Inc., and Yokogawa Electric Corp.

    Market Research Insights

    • The market encompasses innovative solutions for fiber length verification, network performance monitoring, and fault diagnosis in fiber optic communications. OTDR systems utilize advanced pulse parameters to deliver high-precision measurements, enabling microscopic and macroscopic fault detection with exceptional fault location accuracy. Two key aspects of the market's growth are the increasing demand for testing standards compliance and the integration of OTDR technology in distributed sensing applications. For instance, OTDR-based cable testing and certification ensure link loss budget adherence, while fiber optic sensors leverage event characterization for network performance monitoring.
    • With ongoing advancements in OTDR software analysis, signal processing techniques, and data acquisition systems, the market continues to evolve, offering new opportunities for enhancing fiber optic quality and improving network reliability. Additionally, fiber geometry analysis plays a crucial role in optical component testing, ensuring optimal performance and longevity.

    We can help! Our analysts can customize this optical time domain reflectometer (otdr) market research report to meet your requirements.

    Get in touch

    1 Executive Summary

    • 1.1 Market overview
      • Executive Summary - Chart on Market Overview
      • Executive Summary - Data Table on Market Overview
      • Executive Summary - Chart on Global Market Characteristics
      • Executive Summary - Chart on Market by Geography
      • Executive Summary - Chart on Market Segmentation by End-user
      • Executive Summary - Chart on Market Segmentation by Type
      • Executive Summary - Chart on Incremental Growth
      • Executive Summary - Data Table on Incremental Growth
      • Executive Summary - Chart on Company Market Positioning

    2 Market Landscape

    • 2.1 Market ecosystem
      • Parent Market
      • Data Table on - Parent Market
    • 2.2 Market characteristics
      • Market characteristics analysis
    • 2.3 Value chain analysis
      • Value Chain Analysis

    3 Market Sizing

    • 3.1 Market definition
      • Offerings of companies included in the market definition
    • 3.2 Market segment analysis
      • Market segments
    • 3.3 Market size 2023
      • 3.4 Market outlook: Forecast for 2023-2028
        • Chart on Global - Market size and forecast 2023-2028 ($ million)
        • Data Table on Global - Market size and forecast 2023-2028 ($ million)
        • Chart on Global Market: Year-over-year growth 2023-2028 (%)
        • Data Table on Global Market: Year-over-year growth 2023-2028 (%)

      4 Historic Market Size

      • 4.1 Global Optical Time Domain Reflectometer (OTDR) Market 2018 - 2022
        • Historic Market Size - Data Table on Global Optical Time Domain Reflectometer (OTDR) Market 2018 - 2022 ($ million)
      • 4.2 End-user segment analysis 2018 - 2022
        • Historic Market Size - End-user Segment 2018 - 2022 ($ million)
      • 4.3 Type segment analysis 2018 - 2022
        • Historic Market Size - Type Segment 2018 - 2022 ($ million)
      • 4.4 Geography segment analysis 2018 - 2022
        • Historic Market Size - Geography Segment 2018 - 2022 ($ million)
      • 4.5 Country segment analysis 2018 - 2022
        • Historic Market Size - Country Segment 2018 - 2022 ($ million)

      5 Five Forces Analysis

      • 5.1 Five forces summary
        • Five forces analysis - Comparison between 2023 and 2028
      • 5.2 Bargaining power of buyers
        • Bargaining power of buyers - Impact of key factors 2023 and 2028
      • 5.3 Bargaining power of suppliers
        • Bargaining power of suppliers - Impact of key factors in 2023 and 2028
      • 5.4 Threat of new entrants
        • Threat of new entrants - Impact of key factors in 2023 and 2028
      • 5.5 Threat of substitutes
        • Threat of substitutes - Impact of key factors in 2023 and 2028
      • 5.6 Threat of rivalry
        • Threat of rivalry - Impact of key factors in 2023 and 2028
      • 5.7 Market condition
        • Chart on Market condition - Five forces 2023 and 2028

      6 Market Segmentation by End-user

      • 6.1 Market segments
        • Chart on End-user - Market share 2023-2028 (%)
        • Data Table on End-user - Market share 2023-2028 (%)
      • 6.2 Comparison by End-user
        • Chart on Comparison by End-user
        • Data Table on Comparison by End-user
      • 6.3 Telecommunication - Market size and forecast 2023-2028
        • Chart on Telecommunication - Market size and forecast 2023-2028 ($ million)
        • Data Table on Telecommunication - Market size and forecast 2023-2028 ($ million)
        • Chart on Telecommunication - Year-over-year growth 2023-2028 (%)
        • Data Table on Telecommunication - Year-over-year growth 2023-2028 (%)
      • 6.4 Cable TV - Market size and forecast 2023-2028
        • Chart on Cable TV - Market size and forecast 2023-2028 ($ million)
        • Data Table on Cable TV - Market size and forecast 2023-2028 ($ million)
        • Chart on Cable TV - Year-over-year growth 2023-2028 (%)
        • Data Table on Cable TV - Year-over-year growth 2023-2028 (%)
      • 6.5 Private enterprise network - Market size and forecast 2023-2028
        • Chart on Private enterprise network - Market size and forecast 2023-2028 ($ million)
        • Data Table on Private enterprise network - Market size and forecast 2023-2028 ($ million)
        • Chart on Private enterprise network - Year-over-year growth 2023-2028 (%)
        • Data Table on Private enterprise network - Year-over-year growth 2023-2028 (%)
      • 6.6 Military - Market size and forecast 2023-2028
        • Chart on Military - Market size and forecast 2023-2028 ($ million)
        • Data Table on Military - Market size and forecast 2023-2028 ($ million)
        • Chart on Military - Year-over-year growth 2023-2028 (%)
        • Data Table on Military - Year-over-year growth 2023-2028 (%)
      • 6.7 Aerospace - Market size and forecast 2023-2028
        • Chart on Aerospace - Market size and forecast 2023-2028 ($ million)
        • Data Table on Aerospace - Market size and forecast 2023-2028 ($ million)
        • Chart on Aerospace - Year-over-year growth 2023-2028 (%)
        • Data Table on Aerospace - Year-over-year growth 2023-2028 (%)
      • 6.8 Market opportunity by End-user
        • Market opportunity by End-user ($ million)
        • Data Table on Market opportunity by End-user ($ million)

      7 Market Segmentation by Type

      • 7.1 Market segments
        • Chart on Type - Market share 2023-2028 (%)
        • Data Table on Type - Market share 2023-2028 (%)
      • 7.2 Comparison by Type
        • Chart on Comparison by Type
        • Data Table on Comparison by Type
      • 7.3 Full-feature OTDR - Market size and forecast 2023-2028
        • Chart on Full-feature OTDR - Market size and forecast 2023-2028 ($ million)
        • Data Table on Full-feature OTDR - Market size and forecast 2023-2028 ($ million)
        • Chart on Full-feature OTDR - Year-over-year growth 2023-2028 (%)
        • Data Table on Full-feature OTDR - Year-over-year growth 2023-2028 (%)
      • 7.4 Hand-held OTDR - Market size and forecast 2023-2028
        • Chart on Hand-held OTDR - Market size and forecast 2023-2028 ($ million)
        • Data Table on Hand-held OTDR - Market size and forecast 2023-2028 ($ million)
        • Chart on Hand-held OTDR - Year-over-year growth 2023-2028 (%)
        • Data Table on Hand-held OTDR - Year-over-year growth 2023-2028 (%)
      • 7.5 Fiber break locator - Market size and forecast 2023-2028
        • Chart on Fiber break locator - Market size and forecast 2023-2028 ($ million)
        • Data Table on Fiber break locator - Market size and forecast 2023-2028 ($ million)
        • Chart on Fiber break locator - Year-over-year growth 2023-2028 (%)
        • Data Table on Fiber break locator - Year-over-year growth 2023-2028 (%)
      • 7.6 Market opportunity by Type
        • Market opportunity by Type ($ million)
        • Data Table on Market opportunity by Type ($ million)

      8 Customer Landscape

      • 8.1 Customer landscape overview
        • Analysis of price sensitivity, lifecycle, customer purchase basket, adoption rates, and purchase criteria

      9 Geographic Landscape

      • 9.1 Geographic segmentation
        • Chart on Market share by geography 2023-2028 (%)
        • Data Table on Market share by geography 2023-2028 (%)
      • 9.2 Geographic comparison
        • Chart on Geographic comparison
        • Data Table on Geographic comparison
      • 9.3 North America - Market size and forecast 2023-2028
        • Chart on North America - Market size and forecast 2023-2028 ($ million)
        • Data Table on North America - Market size and forecast 2023-2028 ($ million)
        • Chart on North America - Year-over-year growth 2023-2028 (%)
        • Data Table on North America - Year-over-year growth 2023-2028 (%)
      • 9.4 Europe - Market size and forecast 2023-2028
        • Chart on Europe - Market size and forecast 2023-2028 ($ million)
        • Data Table on Europe - Market size and forecast 2023-2028 ($ million)
        • Chart on Europe - Year-over-year growth 2023-2028 (%)
        • Data Table on Europe - Year-over-year growth 2023-2028 (%)
      • 9.5 APAC - Market size and forecast 2023-2028
        • Chart on APAC - Market size and forecast 2023-2028 ($ million)
        • Data Table on APAC - Market size and forecast 2023-2028 ($ million)
        • Chart on APAC - Year-over-year growth 2023-2028 (%)
        • Data Table on APAC - Year-over-year growth 2023-2028 (%)
      • 9.6 South America - Market size and forecast 2023-2028
        • Chart on South America - Market size and forecast 2023-2028 ($ million)
        • Data Table on South America - Market size and forecast 2023-2028 ($ million)
        • Chart on South America - Year-over-year growth 2023-2028 (%)
        • Data Table on South America - Year-over-year growth 2023-2028 (%)
      • 9.7 Middle East and Africa - Market size and forecast 2023-2028
        • Chart on Middle East and Africa - Market size and forecast 2023-2028 ($ million)
        • Data Table on Middle East and Africa - Market size and forecast 2023-2028 ($ million)
        • Chart on Middle East and Africa - Year-over-year growth 2023-2028 (%)
        • Data Table on Middle East and Africa - Year-over-year growth 2023-2028 (%)
      • 9.8 US - Market size and forecast 2023-2028
        • Chart on US - Market size and forecast 2023-2028 ($ million)
        • Data Table on US - Market size and forecast 2023-2028 ($ million)
        • Chart on US - Year-over-year growth 2023-2028 (%)
        • Data Table on US - Year-over-year growth 2023-2028 (%)
      • 9.9 China - Market size and forecast 2023-2028
        • Chart on China - Market size and forecast 2023-2028 ($ million)
        • Data Table on China - Market size and forecast 2023-2028 ($ million)
        • Chart on China - Year-over-year growth 2023-2028 (%)
        • Data Table on China - Year-over-year growth 2023-2028 (%)
      • 9.10 Japan - Market size and forecast 2023-2028
        • Chart on Japan - Market size and forecast 2023-2028 ($ million)
        • Data Table on Japan - Market size and forecast 2023-2028 ($ million)
        • Chart on Japan - Year-over-year growth 2023-2028 (%)
        • Data Table on Japan - Year-over-year growth 2023-2028 (%)
      • 9.11 Germany - Market size and forecast 2023-2028
        • Chart on Germany - Market size and forecast 2023-2028 ($ million)
        • Data Table on Germany - Market size and forecast 2023-2028 ($ million)
        • Chart on Germany - Year-over-year growth 2023-2028 (%)
        • Data Table on Germany - Year-over-year growth 2023-2028 (%)
      • 9.12 India - Market size and forecast 2023-2028
        • Chart on India - Market size and forecast 2023-2028 ($ million)
        • Data Table on India - Market size and forecast 2023-2028 ($ million)
        • Chart on India - Year-over-year growth 2023-2028 (%)
        • Data Table on India - Year-over-year growth 2023-2028 (%)
      • 9.13 Market opportunity by geography
        • Market opportunity by geography ($ million)
        • Data Tables on Market opportunity by geography ($ million)

      10 Drivers, Challenges, and Opportunity/Restraints

      • 10.1 Market drivers
        • 10.2 Market challenges
          • 10.3 Impact of drivers and challenges
            • Impact of drivers and challenges in 2023 and 2028
          • 10.4 Market opportunities/restraints

            11 Competitive Landscape

            • 11.1 Overview
              • 11.2 Competitive Landscape
                • Overview on criticality of inputs and factors of differentiation
              • 11.3 Landscape disruption
                • Overview on factors of disruption
              • 11.4 Industry risks
                • Impact of key risks on business

              12 Competitive Analysis

              • 12.1 Companies profiled
                • Companies covered
              • 12.2 Market positioning of companies
                • Matrix on companies position and classification
              • 12.3 Anritsu Corp.
                • Anritsu Corp. - Overview
                • Anritsu Corp. - Business segments
                • Anritsu Corp. - Key news
                • Anritsu Corp. - Key offerings
                • Anritsu Corp. - Segment focus
              • 12.4 Briticom
                • Briticom - Overview
                • Briticom - Product / Service
                • Briticom - Key offerings
              • 12.5 Connectix Ltd.
                • Connectix Ltd. - Overview
                • Connectix Ltd. - Product / Service
                • Connectix Ltd. - Key offerings
              • 12.6 Corning Inc.
                • Corning Inc. - Overview
                • Corning Inc. - Business segments
                • Corning Inc. - Key news
                • Corning Inc. - Key offerings
                • Corning Inc. - Segment focus
              • 12.7 EXFO Inc.
                • EXFO Inc. - Overview
                • EXFO Inc. - Product / Service
                • EXFO Inc. - Key offerings
              • 12.8 Fibertronics Inc.
                • Fibertronics Inc. - Overview
                • Fibertronics Inc. - Product / Service
                • Fibertronics Inc. - Key offerings
              • 12.9 Fortive Corp.
                • Fortive Corp. - Overview
                • Fortive Corp. - Business segments
                • Fortive Corp. - Key news
                • Fortive Corp. - Key offerings
                • Fortive Corp. - Segment focus
              • 12.10 Fujikura Co. Ltd.
                • Fujikura Co. Ltd. - Overview
                • Fujikura Co. Ltd. - Business segments
                • Fujikura Co. Ltd. - Key news
                • Fujikura Co. Ltd. - Key offerings
                • Fujikura Co. Ltd. - Segment focus
              • 12.11 GAO Tek Inc.
                • GAO Tek Inc. - Overview
                • GAO Tek Inc. - Product / Service
                • GAO Tek Inc. - Key offerings
              • 12.12 INNO Instrument Inc.
                • INNO Instrument Inc. - Overview
                • INNO Instrument Inc. - Product / Service
                • INNO Instrument Inc. - Key offerings
              • 12.13 Multicom Inc.
                • Multicom Inc. - Overview
                • Multicom Inc. - Product / Service
                • Multicom Inc. - Key offerings
              • 12.14 Teledyne Technologies Inc.
                • Teledyne Technologies Inc. - Overview
                • Teledyne Technologies Inc. - Business segments
                • Teledyne Technologies Inc. - Key news
                • Teledyne Technologies Inc. - Key offerings
                • Teledyne Technologies Inc. - Segment focus
              • 12.15 Texas Instruments Inc.
                • Texas Instruments Inc. - Overview
                • Texas Instruments Inc. - Business segments
                • Texas Instruments Inc. - Key news
                • Texas Instruments Inc. - Key offerings
                • Texas Instruments Inc. - Segment focus
              • 12.16 Viavi Solutions Inc.
                • Viavi Solutions Inc. - Overview
                • Viavi Solutions Inc. - Business segments
                • Viavi Solutions Inc. - Key offerings
                • Viavi Solutions Inc. - Segment focus
              • 12.17 Yokogawa Electric Corp.
                • Yokogawa Electric Corp. - Overview
                • Yokogawa Electric Corp. - Business segments
                • Yokogawa Electric Corp. - Key news
                • Yokogawa Electric Corp. - Key offerings
                • Yokogawa Electric Corp. - Segment focus

              13 Appendix

              • 13.1 Scope of the report
                • 13.2 Inclusions and exclusions checklist
                  • Inclusions checklist
                  • Exclusions checklist
                • 13.3 Currency conversion rates for US$
                  • Currency conversion rates for US$
                • 13.4 Research methodology
                  • Research methodology
                • 13.5 Data procurement
                  • Information sources
                • 13.6 Data validation
                  • Data validation
                • 13.7 Validation techniques employed for market sizing
                  • Validation techniques employed for market sizing
                • 13.8 Data synthesis
                  • Data synthesis
                • 13.9 360 degree market analysis
                  • 360 degree market analysis
                • 13.10 List of abbreviations
                  • List of abbreviations

                Research Methodology

                Technavio presents a detailed picture of the market by way of study, synthesis, and summation of data from multiple sources. The analysts have presented the various facets of the market with a particular focus on identifying the key industry influencers. The data thus presented is comprehensive, reliable, and the result of extensive research, both primary and secondary.

                INFORMATION SOURCES

                Primary sources

                • Manufacturers and suppliers
                • Channel partners
                • Industry experts
                • Strategic decision makers

                Secondary sources

                • Industry journals and periodicals
                • Government data
                • Financial reports of key industry players
                • Historical data
                • Press releases

                DATA ANALYSIS

                Data Synthesis

                • Collation of data
                • Estimation of key figures
                • Analysis of derived insights

                Data Validation

                • Triangulation with data models
                • Reference against proprietary databases
                • Corroboration with industry experts

                REPORT WRITING

                Qualitative

                • Market drivers
                • Market challenges
                • Market trends
                • Five forces analysis

                Quantitative

                • Market size and forecast
                • Market segmentation
                • Geographical insights
                • Competitive landscape

                Interested in this report?

                Get your sample now to see our research methodology and insights!

                Download Now

                Frequently Asked Questions

                Optical Time Domain Reflectometer (OTDR) market growth will increase by $ 75.4 mn during 2024-2028 .

                The Optical Time Domain Reflectometer (OTDR) market is expected to grow at a CAGR of 5.22% during 2024-2028 .

                Optical Time Domain Reflectometer (OTDR) market is segmented by End-user( Telecommunication, Cable TV, Private enterprise network, Military, Aerospace) Type( Full-feature OTDR, Hand-held OTDR, Fiber break locator, South America, MEA)

                Aishwarya Technologies and Telecom Ltd., Anritsu Corp., Briticom, Circuit Globe, Connectix Ltd., Corning Inc., EXFO Inc., Fibertronics Inc., Fluke Corp., Fortive Corp., Fujikura Co. Ltd., GAO Tek Inc., INNO Instrument Inc., Multicom Inc., ShinewayTech, Teledyne Technologies Inc., Texas Instruments Inc., VeEX Inc., Viavi Solutions Inc., Yokogawa Electric Corp. are a few of the key vendors in the Optical Time Domain Reflectometer (OTDR) market.

                North America will register the highest growth rate of 29% among the other regions. Therefore, the Optical Time Domain Reflectometer (OTDR) market in North America is expected to garner significant business opportunities for the vendors during the forecast period.

                US, China, Japan, Germany, India

                • Increasing demand for tier-2 certification standardOptical fibers are becoming a core network for network communication across organizations. Several firms are choosing to move from copper cabling to fiber cabling because of its numerous benefits is the driving factor this market.
                • such as low attenuation is the driving factor this market.
                • high return on investment is the driving factor this market.
                • and support for high bandwidth applications. The exponential growth in data traffic is fueling the demand for high network speeds and high bandwidths is the driving factor this market.
                • which is resulting in the deployment of optical fiber cables. While deploying optical fiber cabling is the driving factor this market.
                • the testing and certification of the installation are required to ensure the reliability and value of the network. As per the Telecommunications Industry Association is the driving factor this market.
                • all fiber optic installations should be tested based on the tier-1 certificate standard. The testing of optical fiber cabling is necessary to ensure that optical fiber links meet the performance expectation outlined by the IEEE is the driving factor this market.
                • ISO/IEC is the driving factor this market.
                • and TIA/EIA standards. Tier-1 testing is performed by LSPM is the driving factor this market.
                • which tests the true optical loss of the link by closely simulating actual network conditions. Tier-2 testing is performed by OTDRs is the driving factor this market.
                • which measure the total optical loss from the reflections within the link is the driving factor this market.
                • such as the reflections from the fiber itself (Rayleigh backscatter) is the driving factor this market.
                • and the components in the link is the driving factor this market.
                • such as connectors and splices (Fresnel reflections) is the driving factor this market.
                • to calculate the overall loss of the link. Tier-1 testing is a simple and accurate method of certifying fiber optic cabling because the optical loss estimated by tier-2 testing is calculated from the reflections within the link and not directly measured by an OTDR. However is the driving factor this market.
                • optical fiber cable installation service providers are increasingly supplementing tier-1 testing with tier-2 testing to minimize optical fiber link loss and to ensure reliable network coverage and optimized workflow. Thus is the driving factor this market.
                • the increasing demand for the tier-2 certification standard is expected to drive the growth of the global optical time domain reflectometer (OTDR) market during the forecast period. is the driving factor this market.

                The Optical Time Domain Reflectometer (OTDR) market vendors should focus on grabbing business opportunities from the Telecommunication segment as it accounted for the largest market share in the base year.