Organic Edible Oil Market Analysis, Size, and Forecast 2026-2030: APAC (China, Japan, and India), North America (US, Canada, and Mexico), Europe (Germany, UK, and France), South America (Brazil, Argentina, and Colombia), Middle East and Africa (Saudi Arabia, UAE, and South Africa), and Rest of World (ROW)

Organic Edible Oil Market Analysis, Size, and Forecast 2026-2030:
APAC (China, Japan, and India), North America (US, Canada, and Mexico), Europe (Germany, UK, and France), South America (Brazil, Argentina, and Colombia), Middle East and Africa (Saudi Arabia, UAE, and South Africa), and Rest of World (ROW)

Published: Dec 2025 294 Pages SKU: IRTNTR44521

Market Overview at a Glance

$4.59 B
Market Opportunity
11.2%
CAGR 2025 - 2030
36.2%
APAC Growth
$2.30 B
Coconut oil segment 2024

Organic Edible Oil Market Size 2026-2030

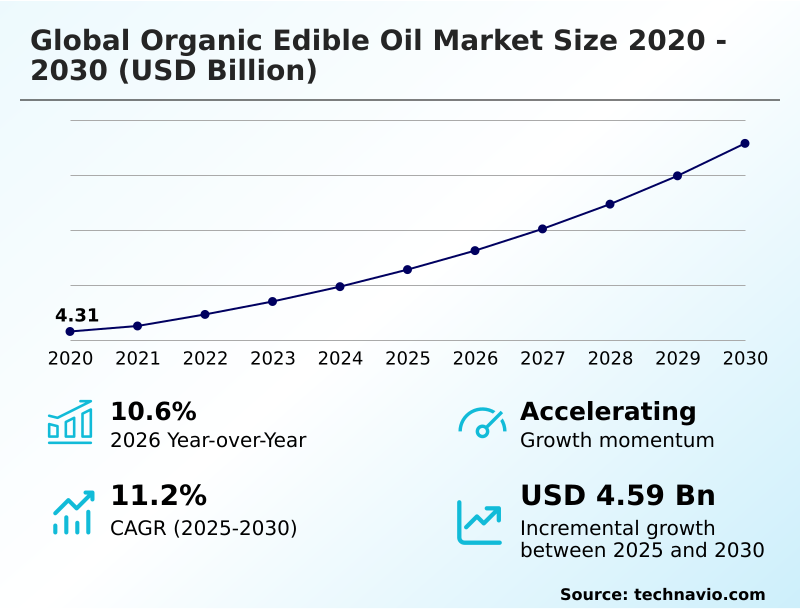
The organic edible oil market size is valued to increase by USD 4.59 billion, at a CAGR of 11.2% from 2025 to 2030. Increasing demand for trans-fat-free oils will drive the organic edible oil market.

Major Market Trends & Insights

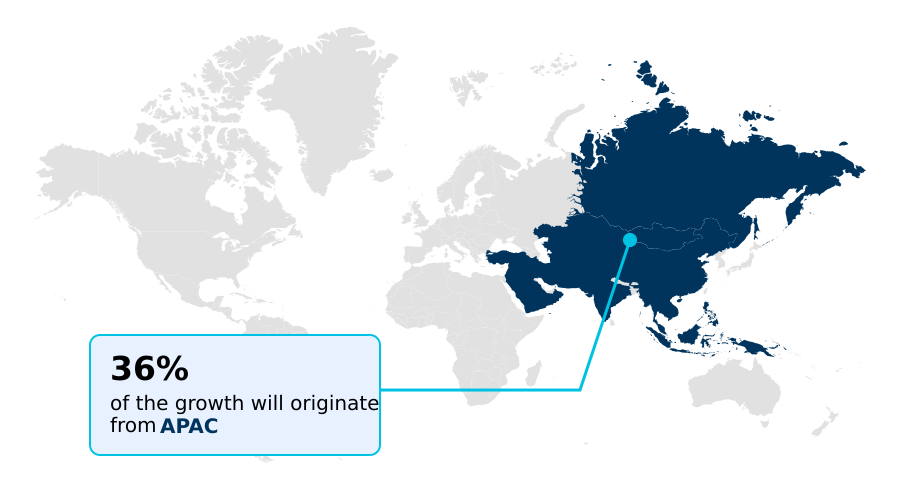
  • APAC dominated the market and accounted for a 36.2% growth during the forecast period.
  • By Type - Coconut oil segment was valued at USD 2.30 billion in 2024
  • By Distribution Channel - Offline segment accounted for the largest market revenue share in 2024

Market Size & Forecast

  • Market Opportunities: USD 6.83 billion
  • Market Future Opportunities: USD 4.59 billion
  • CAGR from 2025 to 2030 : 11.2%

Market Summary

  • The organic edible oil market is defined by a pronounced consumer shift toward health, wellness, and transparency. This movement is driven by a demand for clean-label ingredients, trans-fat-free oils, and products with clear functional health benefits that support preventive healthcare.
  • The market's trajectory is also shaped by the diverse culinary applications of oils with specific properties, such as high smoke points for high-heat cooking. In a typical business scenario, a food processor aims to launch a new line of organic salad dressings.
  • To meet consumer expectations and regulatory requirements, the company implements traceability technologies to ensure complete supply chain transparency from farm to shelf. This validates claims of non-gmo project verified sourcing and adherence to usda organic certification standards, building consumer trust and securing premium retail placement. However, the industry navigates challenges including price-sensitive consumer behavior and complex international certification standards.
  • The rise of direct-to-consumer e-commerce and subscription-based models offers new pathways to market, bypassing some traditional distribution hurdles and fostering brand loyalty.

What will be the Size of the Organic Edible Oil Market during the forecast period?

Get Key Insights on Market Forecast (PDF) Request Free Sample

How is the Organic Edible Oil Market Segmented?

The organic edible oil industry research report provides comprehensive data (region-wise segment analysis), with forecasts and estimates in "USD million" for the period 2026-2030, as well as historical data from 2020-2024 for the following segments.

  • Type
    • Coconut oil
    • Soybean oil
    • Olive oil
    • Others
  • Distribution channel
    • Offline
    • Online
  • Type of packaging
    • Bottles
    • Jars
    • Cans
    • Others
  • Geography
    • APAC
      • China
      • Japan
      • India
    • North America
      • US
      • Canada
      • Mexico
    • Europe
      • Germany
      • UK
      • France
    • South America
      • Brazil
      • Argentina
      • Colombia
    • Middle East and Africa
      • Saudi Arabia
      • UAE
      • South Africa
    • Rest of World (ROW)

By Type Insights

The coconut oil segment is estimated to witness significant growth during the forecast period.

The coconut oil segment holds a significant position, driven by consumer perception of its functional health benefits and versatility.

High concentrations of medium-chain triglycerides and medium-chain fatty acids distinguish it as a preferred source for health-focused diets focused on preventive healthcare and cholesterol management. Beyond culinary applications, the sector benefits from its use in plant-based formulations.

This dual utility sustains demand, contributing to over 30% of non-culinary applications in the specialty oils category. Supply chains rely on fair trade supply initiatives, with organic certification agencies ensuring quality.

To justify a premium, manufacturers are innovating with cold-pressed extraction and virgin variants that preserve flavor, offering a high smoke point suitable for various trans-fat-free oils for cooking.

Request Free Sample

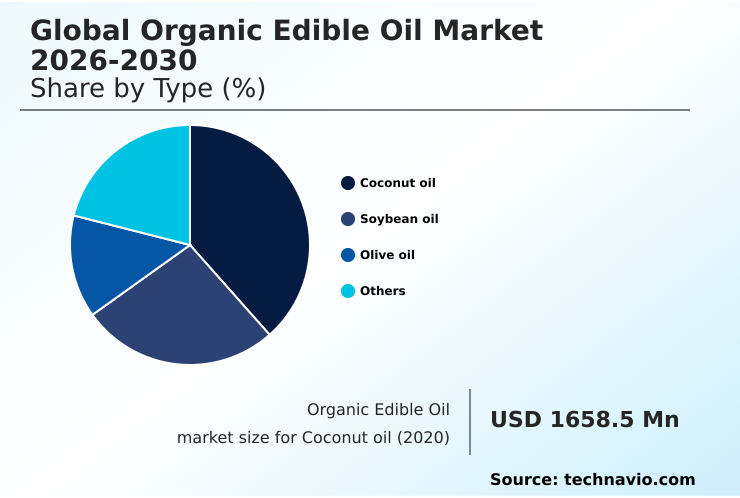
The Coconut oil segment was valued at USD 2.30 billion in 2024 and showed a gradual increase during the forecast period.

Request Free Sample

Regional Analysis

APAC is estimated to contribute 36.2% to the growth of the global market during the forecast period.Technavio’s analysts have elaborately explained the regional trends and drivers that shape the market during the forecast period.

See How Organic Edible Oil Market Demand is Rising in APAC Request Free Sample

The global market exhibits distinct regional dynamics, with APAC emerging as the primary growth engine, projected to contribute over 36% of the market's incremental growth.

In mature markets like Europe, demand is sophisticated, with a focus on single-origin products and items with protected designation of origin. These regions face high retail shelf space competition and distribution channel complexity, necessitating robust logistics networks.

The clean beauty movement has also become a significant factor, with consumers seeking oils with third-party certifications. To foster brand loyalty programs, companies are using packaging with advanced photo-oxidation protection and flexible packaging formats.

Success hinges on building consumer trust, as evidenced by a 20% increase in sales for brands that provide clear traceability.

Market Dynamics

Our researchers analyzed the data with 2025 as the base year, along with the key drivers, trends, and challenges. A holistic analysis of drivers will help companies refine their marketing strategies to gain a competitive advantage.

  • The global organic edible oil market 2026-2030 is experiencing a significant transformation, driven largely by consumer preference for clean-label edible oils and a deeper understanding of their nutritional value. Shoppers are actively comparing organic vs inorganic edible oils, seeking out trans-fat-free cooking oil alternatives for daily use.
  • This trend highlights the growing interest in the health benefits of organic coconut oil and the use of organic olive oil for skin hydration. Consequently, demand for the best organic oil for high-heat cooking has surged.
  • On the supply side, producers are responding by focusing on sustainable palm oil production methods and adopting regenerative agriculture for oilseed crops to ensure long-term viability. However, the industry grapples with the challenges in organic oil certification process, as meeting usda organic certification requirements for oils is both costly and complex.
  • Distribution challenges for organic food producers further complicate market access. The impact of online retail on edible oil sales has been profound, with e-commerce strategies for organic brands becoming critical for growth. Firms leveraging online channels report customer acquisition costs up to 20% lower than those using traditional retail.
  • The role of packaging in organic oil preservation is also paramount, leading to innovations like bpa-free packaging for edible oils.
  • This focus on supply chain transparency in the food industry, from sourcing organic soybean oil in processed foods to detailing the diverse applications of organic flaxseed oil, is key to building consumer trust and navigating the expanding private-label organic oil market growth.

What are the key market drivers leading to the rise in the adoption of Organic Edible Oil Industry?

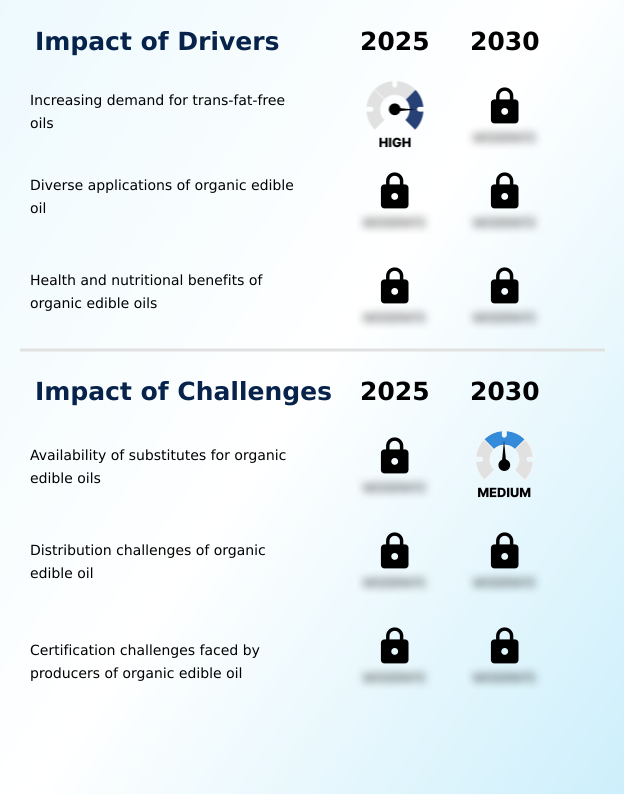
  • The escalating demand for trans-fat-free oils, driven by heightened health awareness among consumers, serves as a primary driver for market expansion.

  • Heightened health consciousness is a primary market driver, with consumers actively seeking products rich in monounsaturated fatty acids and polyunsaturated fats.
  • The demand for clean-label ingredients has spurred a 25% increase in searches for oils containing beneficial compounds like alpha-linolenic acid. This shift is compelling manufacturers to adopt regenerative agriculture practices and ensure supply chain transparency.
  • Retailers are adapting with enhanced merchandising solutions and category management strategies that highlight these attributes, leading to a 15% better sales performance for transparently-labeled products.
  • The growth of direct-to-consumer e-commerce allows brands to communicate these benefits directly, leveraging differentiated packaging with light protection packaging and moisture barrier packaging to preserve quality and build consumer confidence in the omnichannel shopping experience.

What are the market trends shaping the Organic Edible Oil Industry?

  • The increasing influence of online retailing channels is reshaping the market's distribution landscape, creating new opportunities for consumer outreach and profitability.

  • Key trends are reshaping market dynamics, driven by the convergence of e-commerce and wellness. The rise of private-label organic brands in major retail channels is making eco-friendly products more accessible, with some chains reporting a 20% increase in this category's sales.
  • Simultaneously, the clean beauty movement is fueling demand for natural cosmetic ingredients, where the skincare benefits of oils are a primary selling point. This has led to a 15% rise in the use of certain organic oils in plant-based formulations for cosmetics.
  • Sustainable farming and ethical sourcing are now baseline expectations, validated by non-gmo project verified and usda organic certification labels. Food traceability has become a crucial tool, with brands using it to prove their commitment to non-hydrogenated fats and sustainable packaging, enhancing consumer trust.

What challenges does the Organic Edible Oil Industry face during its growth?

  • The widespread availability and lower price point of conventional edible oil substitutes present a significant challenge to the market growth of organic alternatives.

  • The market faces persistent challenges from price-sensitive consumer behavior, with lower-cost inorganic oil substitutes capturing nearly 60% of total volume sales. This is compounded by complex food safety regulations and international certification standards that increase operational costs. For instance, achieving compliance can add an estimated 10-15% to production expenses, a significant barrier for smaller producers.
  • The industry is responding with innovations in sustainable packaging solutions, including biodegradable materials and flexible packaging formats that offer portion control packaging to appeal to budget-conscious consumers.
  • Leading companies are adopting advanced traceability technologies and circular economy principles to streamline compliance and justify premium pricing, while digital marketing campaigns for subscription-based models aim to build loyalty and mitigate the impact of price sensitivity.

Exclusive Technavio Analysis on Customer Landscape

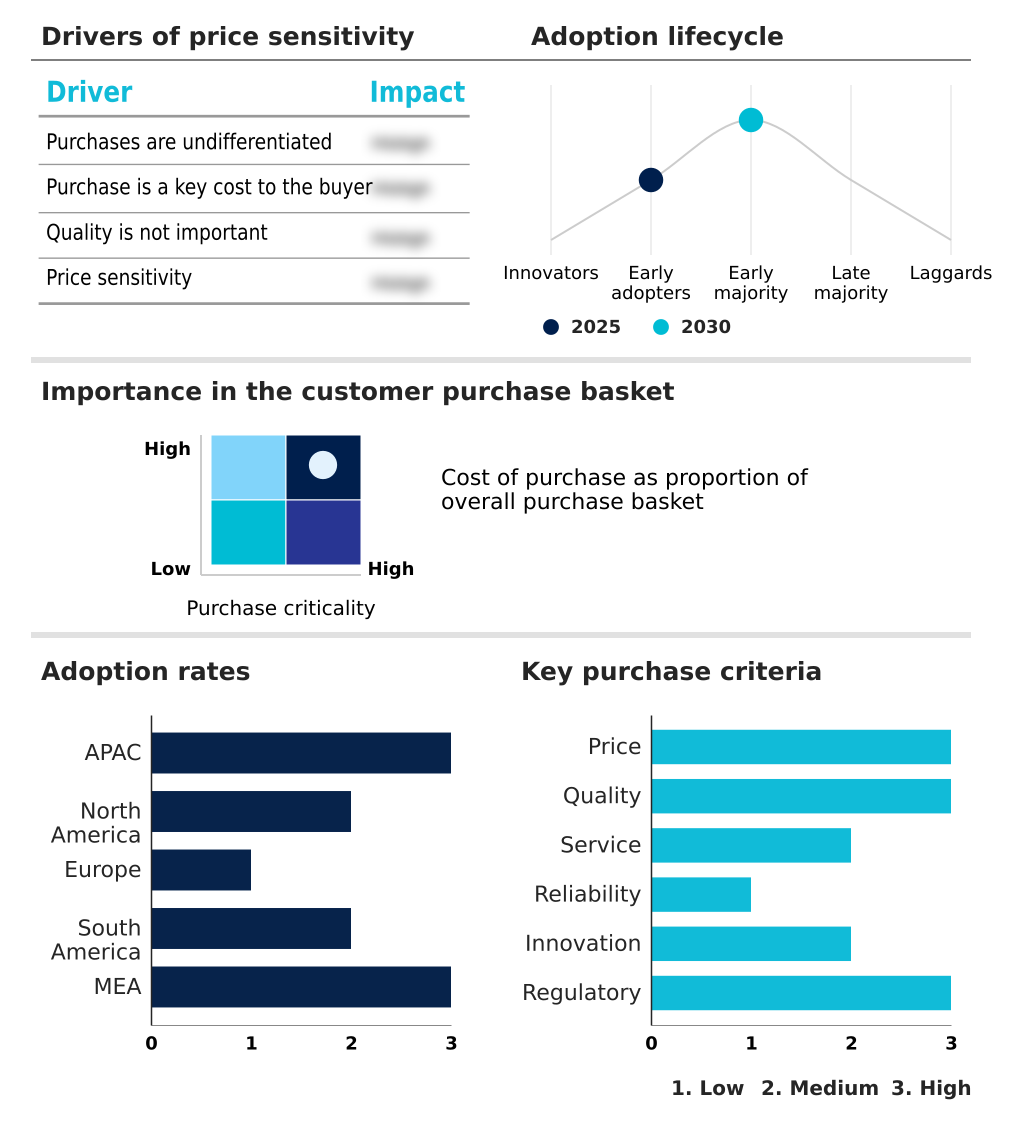
The organic edible oil market forecasting report includes the adoption lifecycle of the market, covering from the innovator’s stage to the laggard’s stage. It focuses on adoption rates in different regions based on penetration. Furthermore, the organic edible oil market report also includes key purchase criteria and drivers of price sensitivity to help companies evaluate and develop their market growth analysis strategies.

Customer Landscape of Organic Edible Oil Industry

Competitive Landscape

Companies are implementing various strategies, such as strategic alliances, organic edible oil market forecast, partnerships, mergers and acquisitions, geographical expansion, and product/service launches, to enhance their presence in the industry.

Adams Group - The company offers organic edible oil products, including coconut oil, soybean oil, and palm oil, tailored for diverse market needs.

The industry research and growth report includes detailed analyses of the competitive landscape of the market and information about key companies, including:

  • Adams Group
  • Agronic Food Pvt. Ltd.
  • Aryan International
  • Black and Green
  • Bunge Global SA
  • Cargill Inc.
  • Catania Spagna
  • Clearspring Ltd.
  • Eden Foods Inc.
  • EFKO
  • ENZO Olive Oil
  • Nimbark Organic
  • NOW Health Group Inc.
  • Nutiva Inc.
  • The Grupo Daabon
  • The Hain Celestial Group
  • Viva Naturals Inc.

Qualitative and quantitative analysis of companies has been conducted to help clients understand the wider business environment as well as the strengths and weaknesses of key industry players. Data is qualitatively analyzed to categorize companies as pure play, category-focused, industry-focused, and diversified; it is quantitatively analyzed to categorize companies as dominant, leading, strong, tentative, and weak.

Recent Development and News in Organic edible oil market

  • In August 2025, Amazon expanded its same-day delivery services for groceries, including a wide variety of organic edible oils, to over 2,300 cities across the United States, enhancing the online retail channel's competitiveness.
  • In September 2025, Cargill introduced a new line of recyclable packaging for its edible oils, reflecting an industry-wide move toward sustainability and circular economy principles in packaging.
  • In July 2025, Bunge Global finalized its merger with Viterra, creating a powerhouse in global agribusiness with enhanced logistical and processing capabilities expected to streamline organic oil supply chains.
  • In March 2025, Whole Foods Market expanded its international footprint by opening a new 21,800-square-foot store in London, featuring an expanded section for organic pantry staples to meet growing European demand.

Dive into Technavio’s robust research methodology, blending expert interviews, extensive data synthesis, and validated models for unparalleled Organic Edible Oil Market insights. See full methodology.

Market Scope
Page number 294
Base year 2025
Historic period 2020-2024
Forecast period 2026-2030
Growth momentum & CAGR Accelerate at a CAGR of 11.2%
Market growth 2026-2030 USD 4591.6 million
Market structure Fragmented
YoY growth 2025-2026(%) 10.6%
Key countries China, Japan, India, South Korea, Australia, Indonesia, US, Canada, Mexico, Germany, UK, France, Italy, Spain, The Netherlands, Brazil, Argentina, Colombia, Saudi Arabia, UAE, South Africa, Turkey and Israel
Competitive landscape Leading Companies, Market Positioning of Companies, Competitive Strategies, and Industry Risks

Request Free Sample

Research Analyst Overview

  • The organic edible oil market is advancing beyond simple organic claims to a more sophisticated value proposition centered on specific technical attributes and verifiable sourcing. Consumer demand is increasingly focused on oils with beneficial nutritional profiles, such as those rich in monounsaturated fatty acids, medium-chain triglycerides, and alpha-linolenic acid, often derived through cold-pressed extraction.
  • This requires stringent adherence to standards like usda organic certification and non-gmo project verified labels, compelling companies to invest in traceability technologies for enhanced supply chain transparency. A key boardroom-level decision now involves committing to sustainable packaging solutions, aligning with circular economy principles through the use of biodegradable materials and mono-materials for recycling to reduce environmental impact.
  • Firms that successfully integrate these technologies and practices report significant operational gains; for instance, leveraging advanced traceability systems has been shown to reduce compliance reporting errors by over 40%.
  • The market is also seeing a push toward clean-label ingredients and innovative plant-based formulations, supported by fair trade supply initiatives and regenerative agriculture practices that ensure the long-term health of the ecosystem.

What are the Key Data Covered in this Organic Edible Oil Market Research and Growth Report?

  • What is the expected growth of the Organic Edible Oil Market between 2026 and 2030?

    • USD 4.59 billion, at a CAGR of 11.2%

  • What segmentation does the market report cover?

    • The report is segmented by Type (Coconut oil, Soybean oil, Olive oil, and Others), Distribution Channel (Offline, and Online), Type of Packaging (Bottles, Jars, Cans, and Others) and Geography (APAC, North America, Europe, South America, Middle East and Africa)

  • Which regions are analyzed in the report?

    • APAC, North America, Europe, South America and Middle East and Africa

  • What are the key growth drivers and market challenges?

    • Increasing demand for trans-fat-free oils, Availability of substitutes for organic edible oils

  • Who are the major players in the Organic Edible Oil Market?

    • Adams Group, Agronic Food Pvt. Ltd., Aryan International, Black and Green, Bunge Global SA, Cargill Inc., Catania Spagna, Clearspring Ltd., Eden Foods Inc., EFKO, ENZO Olive Oil, Nimbark Organic, NOW Health Group Inc., Nutiva Inc., The Grupo Daabon, The Hain Celestial Group and Viva Naturals Inc.

Market Research Insights

  • The market is shaped by dynamic consumer behaviors and evolving retail strategies. Brands that have successfully implemented subscription-based models are reporting customer retention rates up to 25% higher than those relying on single purchases. In physical retail, effective category management strategies have boosted sales velocity for premium oils by 15% by creating a clear distinction from inorganic oil substitutes.
  • This omnichannel shopping experience, integrating both digital marketing campaigns and in-store merchandising solutions, is critical. The complexity of inventory management systems remains a hurdle, but the shift toward differentiated packaging and direct-to-consumer e-commerce is creating new efficiencies and avenues for growth.

We can help! Our analysts can customize this organic edible oil market research report to meet your requirements.

Get in touch

1. Executive Summary

1.1 Market overview

Executive Summary - Chart on Market Overview
Executive Summary - Data Table on Market Overview
Executive Summary - Chart on Global Market Characteristics
Executive Summary - Chart on Market by Geography
Executive Summary - Chart on Market Segmentation by Type
Executive Summary - Chart on Market Segmentation by Distribution Channel
Executive Summary - Chart on Market Segmentation by Type of Packaging
Executive Summary - Chart on Incremental Growth
Executive Summary - Data Table on Incremental Growth
Executive Summary - Chart on Company Market Positioning

2. Technavio Analysis

2.1 Analysis of price sensitivity, lifecycle, customer purchase basket, adoption rates, and purchase criteria

2.2 Criticality of inputs and Factors of differentiation

Chart on Overview on criticality of inputs and factors of differentiation

2.3 Factors of disruption

Chart on Overview on factors of disruption

2.4 Impact of drivers and challenges

Chart on Impact of drivers and challenges in 2025 and 2030

3. Market Landscape

3.1 Market ecosystem

Chart on Parent Market
Data Table on - Parent Market

3.2 Market characteristics

Chart on Market characteristics analysis

3.3 Value chain analysis

Chart on Value chain analysis

4. Market Sizing

4.1 Market definition

Data Table on Offerings of companies included in the market definition

4.2 Market segment analysis

Market segments

4.3 Market size 2025

4.4 Market outlook: Forecast for 2025-2030

Chart on Global - Market size and forecast 2025-2030 ($ million)
Data Table on Global - Market size and forecast 2025-2030 ($ million)
Chart on Global Market: Year-over-year growth 2025-2030 (%)
Data Table on Global Market: Year-over-year growth 2025-2030 (%)

5. Historic Market Size

5.1 Global Organic Edible Oil Market 2020 - 2024

Historic Market Size - Data Table on Global Organic Edible Oil Market 2020 - 2024 ($ million)

5.2 Type segment analysis 2020 - 2024

Historic Market Size - Type Segment 2020 - 2024 ($ million)

5.3 Distribution Channel segment analysis 2020 - 2024

Historic Market Size - Distribution Channel Segment 2020 - 2024 ($ million)

5.4 Type of Packaging segment analysis 2020 - 2024

Historic Market Size - Type of Packaging Segment 2020 - 2024 ($ million)

5.5 Geography segment analysis 2020 - 2024

Historic Market Size - Geography Segment 2020 - 2024 ($ million)

5.6 Country segment analysis 2020 - 2024

Historic Market Size - Country Segment 2020 - 2024 ($ million)

6. Qualitative Analysis

6.1 Impact of AI in global organic edible oil market

7. Five Forces Analysis

7.1 Five forces summary

Five forces analysis - Comparison between 2025 and 2030

7.2 Bargaining power of buyers

Bargaining power of buyers - Impact of key factors 2025 and 2030

7.3 Bargaining power of suppliers

Bargaining power of suppliers - Impact of key factors in 2025 and 2030

7.4 Threat of new entrants

Threat of new entrants - Impact of key factors in 2025 and 2030

7.5 Threat of substitutes

Threat of substitutes - Impact of key factors in 2025 and 2030

7.6 Threat of rivalry

Threat of rivalry - Impact of key factors in 2025 and 2030

7.7 Market condition

Chart on Market condition - Five forces 2025 and 2030

8. Market Segmentation by Type

8.1 Market segments

Chart on Type - Market share 2025-2030 (%)
Data Table on Type - Market share 2025-2030 (%)

8.2 Comparison by Type

Chart on Comparison by Type
Data Table on Comparison by Type

8.3 Coconut oil - Market size and forecast 2025-2030

Chart on Coconut oil - Market size and forecast 2025-2030 ($ million)
Data Table on Coconut oil - Market size and forecast 2025-2030 ($ million)
Chart on Coconut oil - Year-over-year growth 2025-2030 (%)
Data Table on Coconut oil - Year-over-year growth 2025-2030 (%)

8.4 Soybean oil - Market size and forecast 2025-2030

Chart on Soybean oil - Market size and forecast 2025-2030 ($ million)
Data Table on Soybean oil - Market size and forecast 2025-2030 ($ million)
Chart on Soybean oil - Year-over-year growth 2025-2030 (%)
Data Table on Soybean oil - Year-over-year growth 2025-2030 (%)

8.5 Olive oil - Market size and forecast 2025-2030

Chart on Olive oil - Market size and forecast 2025-2030 ($ million)
Data Table on Olive oil - Market size and forecast 2025-2030 ($ million)
Chart on Olive oil - Year-over-year growth 2025-2030 (%)
Data Table on Olive oil - Year-over-year growth 2025-2030 (%)

8.6 Others - Market size and forecast 2025-2030

Chart on Others - Market size and forecast 2025-2030 ($ million)
Data Table on Others - Market size and forecast 2025-2030 ($ million)
Chart on Others - Year-over-year growth 2025-2030 (%)
Data Table on Others - Year-over-year growth 2025-2030 (%)

8.7 Market opportunity by Type

Market opportunity by Type ($ million)
Data Table on Market opportunity by Type ($ million)

9. Market Segmentation by Distribution Channel

9.1 Market segments

Chart on Distribution Channel - Market share 2025-2030 (%)
Data Table on Distribution Channel - Market share 2025-2030 (%)

9.2 Comparison by Distribution Channel

Chart on Comparison by Distribution Channel
Data Table on Comparison by Distribution Channel

9.3 Offline - Market size and forecast 2025-2030

Chart on Offline - Market size and forecast 2025-2030 ($ million)
Data Table on Offline - Market size and forecast 2025-2030 ($ million)
Chart on Offline - Year-over-year growth 2025-2030 (%)
Data Table on Offline - Year-over-year growth 2025-2030 (%)

9.4 Online - Market size and forecast 2025-2030

Chart on Online - Market size and forecast 2025-2030 ($ million)
Data Table on Online - Market size and forecast 2025-2030 ($ million)
Chart on Online - Year-over-year growth 2025-2030 (%)
Data Table on Online - Year-over-year growth 2025-2030 (%)

9.5 Market opportunity by Distribution Channel

Market opportunity by Distribution Channel ($ million)
Data Table on Market opportunity by Distribution Channel ($ million)

10. Market Segmentation by Type of Packaging

10.1 Market segments

Chart on Type of Packaging - Market share 2025-2030 (%)
Data Table on Type of Packaging - Market share 2025-2030 (%)

10.2 Comparison by Type of Packaging

Chart on Comparison by Type of Packaging
Data Table on Comparison by Type of Packaging

10.3 Bottles - Market size and forecast 2025-2030

Chart on Bottles - Market size and forecast 2025-2030 ($ million)
Data Table on Bottles - Market size and forecast 2025-2030 ($ million)
Chart on Bottles - Year-over-year growth 2025-2030 (%)
Data Table on Bottles - Year-over-year growth 2025-2030 (%)

10.4 Jars - Market size and forecast 2025-2030

Chart on Jars - Market size and forecast 2025-2030 ($ million)
Data Table on Jars - Market size and forecast 2025-2030 ($ million)
Chart on Jars - Year-over-year growth 2025-2030 (%)
Data Table on Jars - Year-over-year growth 2025-2030 (%)

10.5 Cans - Market size and forecast 2025-2030

Chart on Cans - Market size and forecast 2025-2030 ($ million)
Data Table on Cans - Market size and forecast 2025-2030 ($ million)
Chart on Cans - Year-over-year growth 2025-2030 (%)
Data Table on Cans - Year-over-year growth 2025-2030 (%)

10.6 Others - Market size and forecast 2025-2030

Chart on Others - Market size and forecast 2025-2030 ($ million)
Data Table on Others - Market size and forecast 2025-2030 ($ million)
Chart on Others - Year-over-year growth 2025-2030 (%)
Data Table on Others - Year-over-year growth 2025-2030 (%)

10.7 Market opportunity by Type of Packaging

Market opportunity by Type of Packaging ($ million)
Data Table on Market opportunity by Type of Packaging ($ million)

11. Customer Landscape

11.1 Customer landscape overview

Analysis of price sensitivity, lifecycle, customer purchase basket, adoption rates, and purchase criteria

12. Geographic Landscape

12.1 Geographic segmentation

Chart on Market share by geography 2025-2030 (%)
Data Table on Market share by geography 2025-2030 (%)

12.2 Geographic comparison

Chart on Geographic comparison
Data Table on Geographic comparison

12.3 APAC - Market size and forecast 2025-2030

Chart on APAC - Market size and forecast 2025-2030 ($ million)
Data Table on APAC - Market size and forecast 2025-2030 ($ million)
Chart on APAC - Year-over-year growth 2025-2030 (%)
Data Table on APAC - Year-over-year growth 2025-2030 (%)
Chart on Regional Comparison - APAC
Data Table on Regional Comparison - APAC

12.3.1 China - Market size and forecast 2025-2030

Chart on China - Market size and forecast 2025-2030 ($ million)
Data Table on China - Market size and forecast 2025-2030 ($ million)
Chart on China - Year-over-year growth 2025-2030 (%)
Data Table on China - Year-over-year growth 2025-2030 (%)

12.3.2 Japan - Market size and forecast 2025-2030

Chart on Japan - Market size and forecast 2025-2030 ($ million)
Data Table on Japan - Market size and forecast 2025-2030 ($ million)
Chart on Japan - Year-over-year growth 2025-2030 (%)
Data Table on Japan - Year-over-year growth 2025-2030 (%)

12.3.3 India - Market size and forecast 2025-2030

Chart on India - Market size and forecast 2025-2030 ($ million)
Data Table on India - Market size and forecast 2025-2030 ($ million)
Chart on India - Year-over-year growth 2025-2030 (%)
Data Table on India - Year-over-year growth 2025-2030 (%)

12.3.4 South Korea - Market size and forecast 2025-2030

Chart on South Korea - Market size and forecast 2025-2030 ($ million)
Data Table on South Korea - Market size and forecast 2025-2030 ($ million)
Chart on South Korea - Year-over-year growth 2025-2030 (%)
Data Table on South Korea - Year-over-year growth 2025-2030 (%)

12.3.5 Australia - Market size and forecast 2025-2030

Chart on Australia - Market size and forecast 2025-2030 ($ million)
Data Table on Australia - Market size and forecast 2025-2030 ($ million)
Chart on Australia - Year-over-year growth 2025-2030 (%)
Data Table on Australia - Year-over-year growth 2025-2030 (%)

12.3.6 Indonesia - Market size and forecast 2025-2030

Chart on Indonesia - Market size and forecast 2025-2030 ($ million)
Data Table on Indonesia - Market size and forecast 2025-2030 ($ million)
Chart on Indonesia - Year-over-year growth 2025-2030 (%)
Data Table on Indonesia - Year-over-year growth 2025-2030 (%)

12.4 North America - Market size and forecast 2025-2030

Chart on North America - Market size and forecast 2025-2030 ($ million)
Data Table on North America - Market size and forecast 2025-2030 ($ million)
Chart on North America - Year-over-year growth 2025-2030 (%)
Data Table on North America - Year-over-year growth 2025-2030 (%)
Chart on Regional Comparison - North America
Data Table on Regional Comparison - North America

12.4.1 US - Market size and forecast 2025-2030

Chart on US - Market size and forecast 2025-2030 ($ million)
Data Table on US - Market size and forecast 2025-2030 ($ million)
Chart on US - Year-over-year growth 2025-2030 (%)
Data Table on US - Year-over-year growth 2025-2030 (%)

12.4.2 Canada - Market size and forecast 2025-2030

Chart on Canada - Market size and forecast 2025-2030 ($ million)
Data Table on Canada - Market size and forecast 2025-2030 ($ million)
Chart on Canada - Year-over-year growth 2025-2030 (%)
Data Table on Canada - Year-over-year growth 2025-2030 (%)

12.4.3 Mexico - Market size and forecast 2025-2030

Chart on Mexico - Market size and forecast 2025-2030 ($ million)
Data Table on Mexico - Market size and forecast 2025-2030 ($ million)
Chart on Mexico - Year-over-year growth 2025-2030 (%)
Data Table on Mexico - Year-over-year growth 2025-2030 (%)

12.5 Europe - Market size and forecast 2025-2030

Chart on Europe - Market size and forecast 2025-2030 ($ million)
Data Table on Europe - Market size and forecast 2025-2030 ($ million)
Chart on Europe - Year-over-year growth 2025-2030 (%)
Data Table on Europe - Year-over-year growth 2025-2030 (%)
Chart on Regional Comparison - Europe
Data Table on Regional Comparison - Europe

12.5.1 Germany - Market size and forecast 2025-2030

Chart on Germany - Market size and forecast 2025-2030 ($ million)
Data Table on Germany - Market size and forecast 2025-2030 ($ million)
Chart on Germany - Year-over-year growth 2025-2030 (%)
Data Table on Germany - Year-over-year growth 2025-2030 (%)

12.5.2 UK - Market size and forecast 2025-2030

Chart on UK - Market size and forecast 2025-2030 ($ million)
Data Table on UK - Market size and forecast 2025-2030 ($ million)
Chart on UK - Year-over-year growth 2025-2030 (%)
Data Table on UK - Year-over-year growth 2025-2030 (%)

12.5.3 France - Market size and forecast 2025-2030

Chart on France - Market size and forecast 2025-2030 ($ million)
Data Table on France - Market size and forecast 2025-2030 ($ million)
Chart on France - Year-over-year growth 2025-2030 (%)
Data Table on France - Year-over-year growth 2025-2030 (%)

12.5.4 Italy - Market size and forecast 2025-2030

Chart on Italy - Market size and forecast 2025-2030 ($ million)
Data Table on Italy - Market size and forecast 2025-2030 ($ million)
Chart on Italy - Year-over-year growth 2025-2030 (%)
Data Table on Italy - Year-over-year growth 2025-2030 (%)

12.5.5 Spain - Market size and forecast 2025-2030

Chart on Spain - Market size and forecast 2025-2030 ($ million)
Data Table on Spain - Market size and forecast 2025-2030 ($ million)
Chart on Spain - Year-over-year growth 2025-2030 (%)
Data Table on Spain - Year-over-year growth 2025-2030 (%)

12.5.6 The Netherlands - Market size and forecast 2025-2030

Chart on The Netherlands - Market size and forecast 2025-2030 ($ million)
Data Table on The Netherlands - Market size and forecast 2025-2030 ($ million)
Chart on The Netherlands - Year-over-year growth 2025-2030 (%)
Data Table on The Netherlands - Year-over-year growth 2025-2030 (%)

12.6 South America - Market size and forecast 2025-2030

Chart on South America - Market size and forecast 2025-2030 ($ million)
Data Table on South America - Market size and forecast 2025-2030 ($ million)
Chart on South America - Year-over-year growth 2025-2030 (%)
Data Table on South America - Year-over-year growth 2025-2030 (%)
Chart on Regional Comparison - South America
Data Table on Regional Comparison - South America

12.6.1 Brazil - Market size and forecast 2025-2030

Chart on Brazil - Market size and forecast 2025-2030 ($ million)
Data Table on Brazil - Market size and forecast 2025-2030 ($ million)
Chart on Brazil - Year-over-year growth 2025-2030 (%)
Data Table on Brazil - Year-over-year growth 2025-2030 (%)

12.6.2 Argentina - Market size and forecast 2025-2030

Chart on Argentina - Market size and forecast 2025-2030 ($ million)
Data Table on Argentina - Market size and forecast 2025-2030 ($ million)
Chart on Argentina - Year-over-year growth 2025-2030 (%)
Data Table on Argentina - Year-over-year growth 2025-2030 (%)

12.6.3 Colombia - Market size and forecast 2025-2030

Chart on Colombia - Market size and forecast 2025-2030 ($ million)
Data Table on Colombia - Market size and forecast 2025-2030 ($ million)
Chart on Colombia - Year-over-year growth 2025-2030 (%)
Data Table on Colombia - Year-over-year growth 2025-2030 (%)

12.7 Middle East and Africa - Market size and forecast 2025-2030

Chart on Middle East and Africa - Market size and forecast 2025-2030 ($ million)
Data Table on Middle East and Africa - Market size and forecast 2025-2030 ($ million)
Chart on Middle East and Africa - Year-over-year growth 2025-2030 (%)
Data Table on Middle East and Africa - Year-over-year growth 2025-2030 (%)
Chart on Regional Comparison - Middle East and Africa
Data Table on Regional Comparison - Middle East and Africa

12.7.1 Saudi Arabia - Market size and forecast 2025-2030

Chart on Saudi Arabia - Market size and forecast 2025-2030 ($ million)
Data Table on Saudi Arabia - Market size and forecast 2025-2030 ($ million)
Chart on Saudi Arabia - Year-over-year growth 2025-2030 (%)
Data Table on Saudi Arabia - Year-over-year growth 2025-2030 (%)

12.7.2 UAE - Market size and forecast 2025-2030

Chart on UAE - Market size and forecast 2025-2030 ($ million)
Data Table on UAE - Market size and forecast 2025-2030 ($ million)
Chart on UAE - Year-over-year growth 2025-2030 (%)
Data Table on UAE - Year-over-year growth 2025-2030 (%)

12.7.3 South Africa - Market size and forecast 2025-2030

Chart on South Africa - Market size and forecast 2025-2030 ($ million)
Data Table on South Africa - Market size and forecast 2025-2030 ($ million)
Chart on South Africa - Year-over-year growth 2025-2030 (%)
Data Table on South Africa - Year-over-year growth 2025-2030 (%)

12.7.4 Turkey - Market size and forecast 2025-2030

Chart on Turkey - Market size and forecast 2025-2030 ($ million)
Data Table on Turkey - Market size and forecast 2025-2030 ($ million)
Chart on Turkey - Year-over-year growth 2025-2030 (%)
Data Table on Turkey - Year-over-year growth 2025-2030 (%)

12.7.5 Israel - Market size and forecast 2025-2030

Chart on Israel - Market size and forecast 2025-2030 ($ million)
Data Table on Israel - Market size and forecast 2025-2030 ($ million)
Chart on Israel - Year-over-year growth 2025-2030 (%)
Data Table on Israel - Year-over-year growth 2025-2030 (%)

12.8 Market opportunity by geography

Market opportunity by geography ($ million)
Data Tables on Market opportunity by geography ($ million)

13. Drivers, Challenges, and Opportunity

13.1 Market drivers

Increasing demand for trans-fat-free oils
Diverse applications of organic edible oil
Health and nutritional benefits of organic edible oils

13.2 Market challenges

Availability of substitutes for organic edible oils
Distribution challenges of organic edible oil
Certification challenges faced by producers of organic edible oil

13.3 Impact of drivers and challenges

Impact of drivers and challenges in 2025 and 2030

13.4 Market opportunities

Growing impact of online retailing channel
Increased awareness and applications of organic edible oil
Increasing prominence of private-label brands

14. Competitive Landscape

14.1 Overview

14.2

Overview on criticality of inputs and factors of differentiation

14.3 Landscape disruption

Overview on factors of disruption

14.4 Industry risks

Impact of key risks on business

15. Competitive Analysis

15.1 Companies profiled

Companies covered

15.2 Company ranking index

15.3 Market positioning of companies

Matrix on companies position and classification

15.4 Adams Group

Adams Group - Overview
Adams Group - Product / Service
Adams Group - Key offerings
SWOT

15.5 Agronic Food Pvt. Ltd.

Agronic Food Pvt. Ltd. - Overview
Agronic Food Pvt. Ltd. - Product / Service
Agronic Food Pvt. Ltd. - Key offerings
SWOT

15.6 Aryan International

Aryan International - Overview
Aryan International - Product / Service
Aryan International - Key offerings
SWOT

15.7 Bunge Global SA

Bunge Global SA - Overview
Bunge Global SA - Business segments
Bunge Global SA - Key news
Bunge Global SA - Key offerings
Bunge Global SA - Segment focus
SWOT

15.8 Cargill Inc.

Cargill Inc. - Overview
Cargill Inc. - Product / Service
Cargill Inc. - Key offerings
SWOT

15.9 Catania Spagna

Catania Spagna - Overview
Catania Spagna - Product / Service
Catania Spagna - Key offerings
SWOT

15.10 Clearspring Ltd.

Clearspring Ltd. - Overview
Clearspring Ltd. - Product / Service
Clearspring Ltd. - Key offerings
SWOT

15.11 Eden Foods Inc.

Eden Foods Inc. - Overview
Eden Foods Inc. - Product / Service
Eden Foods Inc. - Key offerings
SWOT

15.12 EFKO

EFKO - Overview
EFKO - Product / Service
EFKO - Key offerings
SWOT

15.13 Nimbark Organic

Nimbark Organic - Overview
Nimbark Organic - Product / Service
Nimbark Organic - Key offerings
SWOT

15.14 NOW Health Group Inc.

NOW Health Group Inc. - Overview
NOW Health Group Inc. - Product / Service
NOW Health Group Inc. - Key offerings
SWOT

15.15 Nutiva Inc.

Nutiva Inc. - Overview
Nutiva Inc. - Product / Service
Nutiva Inc. - Key offerings
SWOT

15.16 The Grupo Daabon

The Grupo Daabon - Overview
The Grupo Daabon - Product / Service
The Grupo Daabon - Key offerings
SWOT

15.17 The Hain Celestial Group

The Hain Celestial Group - Overview
The Hain Celestial Group - Business segments
The Hain Celestial Group - Key news
The Hain Celestial Group - Key offerings
The Hain Celestial Group - Segment focus
SWOT

15.18 Viva Naturals Inc.

Viva Naturals Inc. - Overview
Viva Naturals Inc. - Product / Service
Viva Naturals Inc. - Key offerings
SWOT

16. Appendix

16.1 Scope of the report

Market definition
Objectives
Notes and caveats

16.2 Inclusions and exclusions checklist

Inclusions checklist
Exclusions checklist

16.3 Currency conversion rates for US$

16.4 Research methodology

16.5 Data procurement

Information sources

16.6 Data validation

16.7 Validation techniques employed for market sizing

16.8 Data synthesis

16.9 360 degree market analysis

16.10 List of abbreviations

Research Methodology

Technavio presents a detailed picture of the market by way of study, synthesis, and summation of data from multiple sources. The analysts have presented the various facets of the market with a particular focus on identifying the key industry influencers. The data thus presented is comprehensive, reliable, and the result of extensive research, both primary and secondary.

INFORMATION SOURCES

Primary sources

  • Manufacturers and suppliers
  • Channel partners
  • Industry experts
  • Strategic decision makers

Secondary sources

  • Industry journals and periodicals
  • Government data
  • Financial reports of key industry players
  • Historical data
  • Press releases

DATA ANALYSIS

Data Synthesis

  • Collation of data
  • Estimation of key figures
  • Analysis of derived insights

Data Validation

  • Triangulation with data models
  • Reference against proprietary databases
  • Corroboration with industry experts

REPORT WRITING

Qualitative

  • Market drivers
  • Market challenges
  • Market trends
  • Five forces analysis

Quantitative

  • Market size and forecast
  • Market segmentation
  • Geographical insights
  • Competitive landscape

Interested in this report?

Get your sample now to see our research methodology and insights!

Download Now

Frequently Asked Questions

Organic Edible Oil market growth will increase by USD 4591.6 million during 2026-2030 .

The Organic Edible Oil market is expected to grow at a CAGR of 11.2% during 2026-2030 .

Organic Edible Oil market is segmented by Type (Coconut oil, Soybean oil, Olive oil, Others) Distribution channel (Offline, Online) Type of packaging (Bottles, Jars, Cans, Others)

Adams Group, Agronic Food Pvt. Ltd., Aryan International, Black and Green, Bunge Global SA, Cargill Inc., Catania Spagna, Clearspring Ltd., Eden Foods Inc., EFKO, ENZO Olive Oil, Nimbark Organic, NOW Health Group Inc., Nutiva Inc., The Grupo Daabon, The Hain Celestial Group, Viva Naturals Inc. are a few of the key vendors in the Organic Edible Oil market.

APAC will register the highest growth rate of 36.2% among the other regions. Therefore, the Organic Edible Oil market in APAC is expected to garner significant business opportunities for the vendors during the forecast period.

China, Japan, India, South Korea, Australia, Indonesia, US, Canada, Mexico, Germany, UK, France, Italy, Spain, The Netherlands, Brazil, Argentina, Colombia, Saudi Arabia, UAE, South Africa, Turkey, Israel

  • Increasing demand for trans-fat-free oils is the driving factor this market.

The Organic Edible Oil market vendors should focus on grabbing business opportunities from the Type segment as it accounted for the largest market share in the base year.