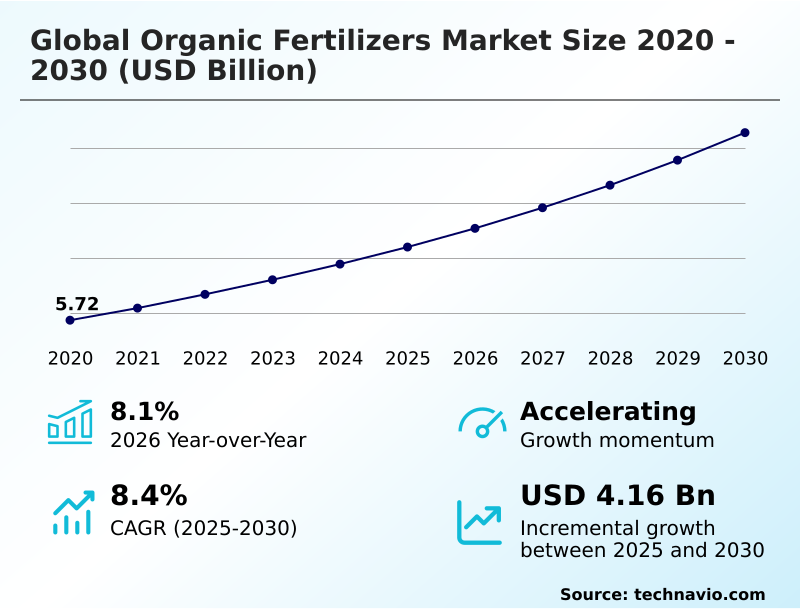
Organic Fertilizers Market Size 2026-2030
The organic fertilizers market size is valued to increase by USD 4.16 billion, at a CAGR of 8.4% from 2025 to 2030. Emergence of inorganic fertilizers will drive the organic fertilizers market.
Major Market Trends & Insights
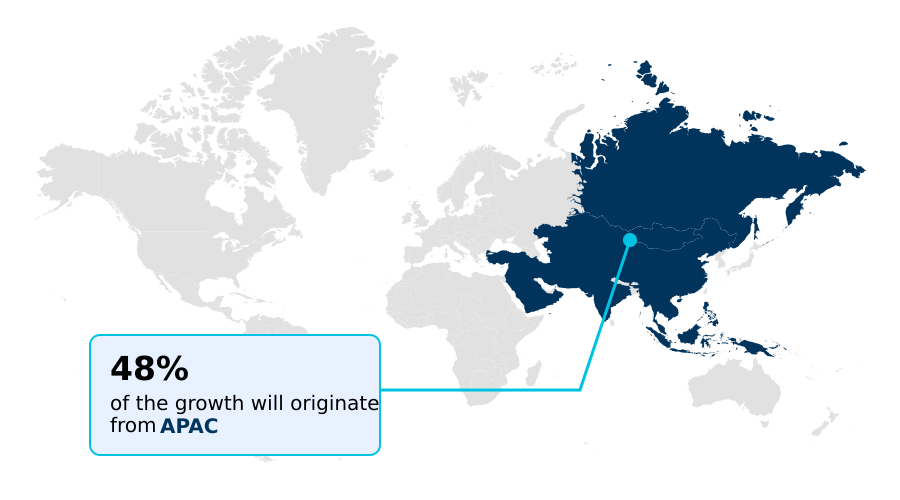
- APAC dominated the market and accounted for a 48.1% growth during the forecast period.
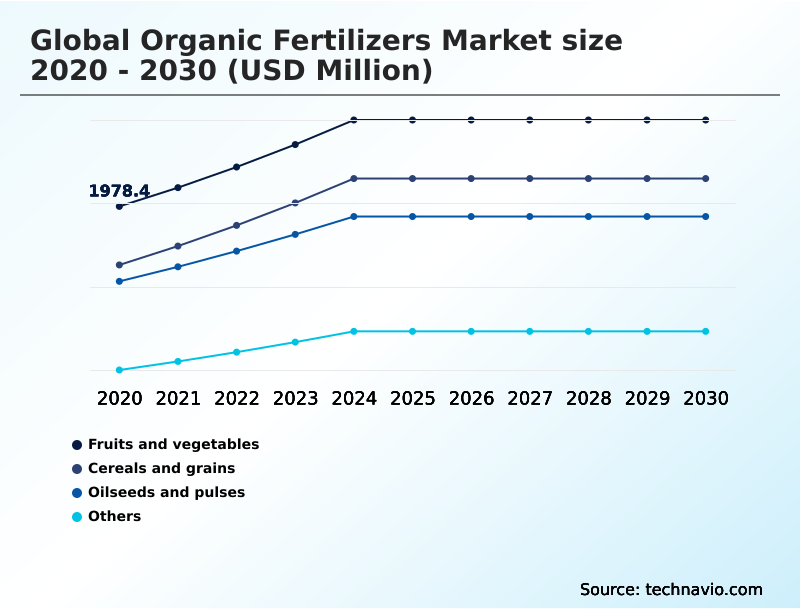
- By Application - Fruits and vegetables segment was valued at USD 2.62 billion in 2024
- By Form Factor - Dry segment accounted for the largest market revenue share in 2024
Market Size & Forecast
- Market Opportunities: USD 6.83 billion
- Market Future Opportunities: USD 4.16 billion
- CAGR from 2025 to 2030 : 8.4%
Market Summary
- The organic fertilizers market is defined by a decisive shift toward agricultural sustainability, where improving soil health is as critical as maximizing crop yield. This transition is driven by rising consumer demand for chemical-free food and increasing regulatory pressure to minimize the environmental impact of farming.
- Key trends include the adoption of circular economy models, where bio-waste recycling and plant residue utilization are integrated into production, creating sustainable nutrient solutions. For instance, a large agricultural enterprise might transition its supply chain to source composted manure locally, reducing transportation costs and meeting corporate ESG targets.
- Innovations focus on enhancing the efficacy of inputs, with compost-enriched products and microbial inoculants designed to boost soil microbial activity and nutrient cycling.
- However, the market's expansion is tempered by competition from conventional inputs and the need to educate growers on the long-term value of regenerative farming principles over the immediate results offered by synthetic alternatives, shaping the strategic landscape for all participants.
What will be the Size of the Organic Fertilizers Market during the forecast period?
Get Key Insights on Market Forecast (PDF) Get Free Sample
How is the Organic Fertilizers Market Segmented?
The organic fertilizers industry research report provides comprehensive data (region-wise segment analysis), with forecasts and estimates in "USD million" for the period 2026-2030, as well as historical data from 2020-2024 for the following segments.
- Application
- Fruits and vegetables
- Cereals and grains
- Oilseeds and pulses
- Others
- Form factor
- Dry
- Liquid
- Source
- Animal based
- Plant based
- Mineral based
- Others
- Geography
- APAC
- China
- India
- Australia
- Europe
- Germany
- Italy
- France
- North America
- US
- Canada
- Mexico
- South America
- Brazil
- Argentina
- Colombia
- Middle East and Africa
- UAE
- Saudi Arabia
- South Africa
- Rest of World (ROW)
- APAC
By Application Insights
The fruits and vegetables segment is estimated to witness significant growth during the forecast period.
The fruits and vegetables segment is pivotal, driven by demand for chemical-free crop production and adherence to stringent organic certification standards.
Producers in this high-value sector are shifting from conventional methods to sustainable agriculture inputs that enhance soil fertility and crop resilience.
The adoption of advanced organic farming techniques, including the use of fortified organic fertilizers and specialized plant-based nutrient blends, is central to improving crop quality.
For instance, the precise application of liquid organic fertilizers and microbial inoculants has enabled growers to achieve a 15% improvement in nutrient absorption efficiency, directly impacting yield consistency.
This focus on soil structure improvement and sophisticated soil health management underscores the segment's role in the broader market evolution.
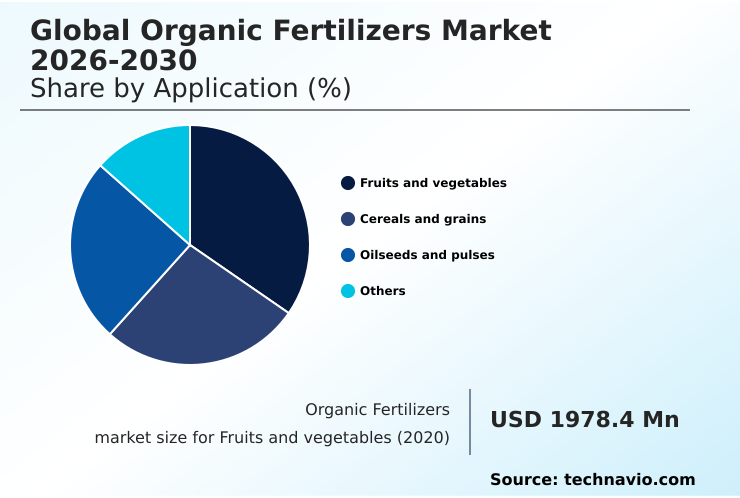
The Fruits and vegetables segment was valued at USD 2.62 billion in 2024 and showed a gradual increase during the forecast period.
Regional Analysis
APAC is estimated to contribute 48.1% to the growth of the global market during the forecast period.Technavio’s analysts have elaborately explained the regional trends and drivers that shape the market during the forecast period.
See How Organic Fertilizers Market Demand is Rising in APAC Get Free Sample
The geographic landscape is characterized by varied adoption rates, with APAC poised to contribute 48.1% of the market's incremental growth. In this region, government-led initiatives promote the use of vermicompost and biochar to restore soil microbial activity.
In contrast, mature markets in North America and Europe focus on optimizing water-use efficiency in crops, where bio-stimulant enriched fertilizers and mineral-based fertilizers like gypsum and potassium sulphate are integrated into high-tech farming systems.
The adoption of precision application for these inputs has improved nutrient delivery efficiency by over 20% in horticultural applications.
This regional differentiation highlights how local agricultural needs and policy frameworks shape the demand for specific organic fertilizer types and sustainable farming methods.
Market Dynamics
Our researchers analyzed the data with 2025 as the base year, along with the key drivers, trends, and challenges. A holistic analysis of drivers will help companies refine their marketing strategies to gain a competitive advantage.
- A detailed examination of the market reveals nuanced strategies tailored to specific agricultural contexts. For instance, the use of liquid organic fertilizer for horticulture is becoming standard for high-value crops, while granular organic fertilizers for large-scale farms address logistical and application challenges in broadacre farming.
- The debate over plant-based fertilizers vs chemical fertilizers continues, with many operations adopting a hybrid approach. The benefits of composted manure in farming are well-documented, but newer methods like vermicompost benefits for vegetable farming show a nearly two-fold improvement in microbial stimulation, a key factor for operational efficiency in intensive systems.
- In terms of soil amendment, the role of biochar in soil amendment is focused on long-term carbon sequestration, while the application of mineral-based fertilizers for soil health addresses immediate nutrient deficiencies. Innovations such as microbial inoculants for nitrogen fixation offer a biological alternative to synthetic inputs.
- Strategic decisions now involve managing raw material costs for organic fertilizers by exploring circular agriculture models in fertilizer production. The choice between animal-based fertilizers for crop yield and slow-release nutrients for cereal crops depends heavily on crop cycles and soil types.
- Government policy on organic farming is a major factor, especially for organic fertilizers for greenhouse cultivation and those seeking to implement regenerative agriculture with organic inputs.
- Ultimately, sustainable nutrient management for oilseeds and other crops relies on improving soil structure with compost and finding organic solutions for nutrient-deficient soils, which in turn is enhancing crop resilience using bio-inputs and improving organic farming impact on water retention.
What are the key market drivers leading to the rise in the adoption of Organic Fertilizers Industry?
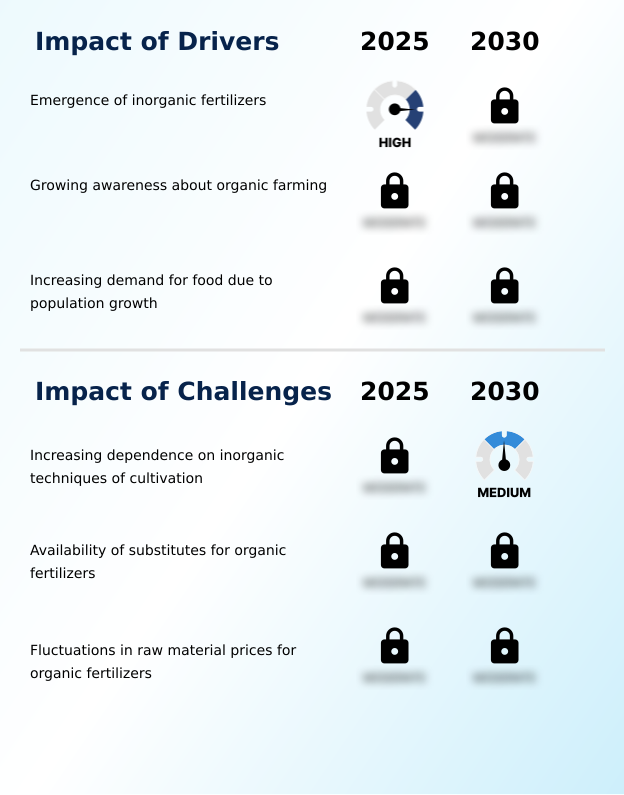
- The emergence and continued refinement of inorganic fertilizers serve as a key market driver, influencing agricultural productivity and nutrient management strategies globally.
- Market expansion is fueled by a growing commitment to environmental stewardship in farming and the need to meet climate-smart agriculture goals. The adoption of integrated nutrient management plans that prioritize sustainable nutrient solutions is critical.
- These plans often feature eco-friendly agricultural inputs like animal-based fertilizers and bio-based nutrient blends, which improve soil health. Farms utilizing certified organic inputs report up to a 10% greater long-term yield stability.
- Furthermore, effective plant residue utilization and crop residue management are central to this shift, reducing chemical dependency. Effective nutrient management is key, as consumer demand for products from sustainable food systems continues to rise, rewarding producers who use these methods.
What are the market trends shaping the Organic Fertilizers Industry?
- The ongoing introduction of new chemical and synthetic fertilizers represents a significant market trend. These advanced formulations aim to improve nutrient efficiency and crop resilience.
- Emerging trends are reshaping the market, with a strong emphasis on the circular economy in agriculture. The use of fermented organic inputs and advanced compost blends, which can improve soil organic matter up to 20% faster than raw manure, is gaining traction. This trend supports regenerative agriculture practices by transforming organic waste valorization into a core component of production.
- Slow-release organic nutrients derived from composted manure and pelletized manure are also becoming standard, reducing nutrient runoff by over 30% compared to soluble synthetic alternatives. These eco-friendly fertilizers support natural nutrient cycling and long-term soil productivity, aligning with the industry's move toward more sustainable and efficient compost-enriched products and natural nutrient sources.
What challenges does the Organic Fertilizers Industry face during its growth?
- The increasing dependence on inorganic cultivation techniques presents a key challenge, affecting the adoption rate of alternative solutions and industry growth.
- Despite strong demand, the market faces challenges related to the organic input supply chain and scalability for large-scale organic farming. Fluctuations in raw material availability, such as those for fish-based fertilizers and bio-waste recycling, can cause input costs to vary by as much as 25% seasonally.
- The inherent bulkiness of granular organic fertilizers and some organic soil amendments adds logistical complexity. While inputs like rock phosphate provide essential minerals and support nitrogen fixation, their slower action compared to synthetics can deter farmers.
- Enhancing soil biodiversity and water retention capacity through sustainable soil practices requires a transitional period, with farms reporting it takes 2-3 seasons to fully realize the benefits of non-toxic agricultural ingredients and soil conservation methods.
Exclusive Technavio Analysis on Customer Landscape
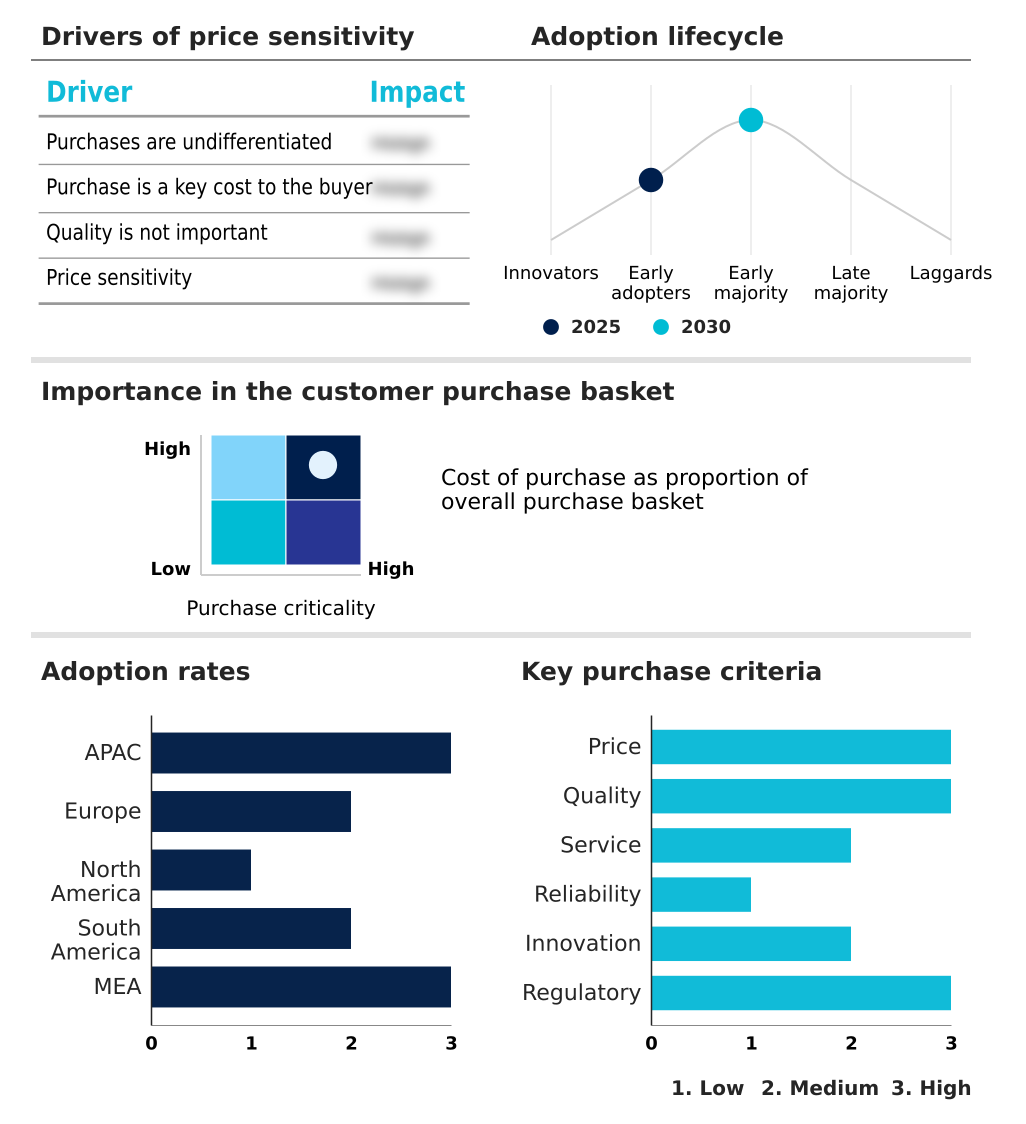
The organic fertilizers market forecasting report includes the adoption lifecycle of the market, covering from the innovator’s stage to the laggard’s stage. It focuses on adoption rates in different regions based on penetration. Furthermore, the organic fertilizers market report also includes key purchase criteria and drivers of price sensitivity to help companies evaluate and develop their market growth analysis strategies.
Customer Landscape of Organic Fertilizers Industry
Competitive Landscape
Companies are implementing various strategies, such as strategic alliances, organic fertilizers market forecast, partnerships, mergers and acquisitions, geographical expansion, and product/service launches, to enhance their presence in the industry.
Andermatt Group AG - Key offerings focus on naturally derived nutrient solutions, including eco-friendly fertilizers and biological innovations, designed to enhance soil health and support sustainable agricultural practices.
The industry research and growth report includes detailed analyses of the competitive landscape of the market and information about key companies, including:
- Andermatt Group AG
- BASF SE
- California Organic Fertilizers Inc.
- Coromandel International Ltd.
- Darling Ingredients Inc.
- Fertikal NV
- Fertoz Ltd.
- FertPro Manufacturing Pty Ltd.
- Hello Nature Inc.
- J M Huber Corp.
- KARNATAKA AGRO CHEMICALS
- KRIBHCO
- Midwestern Bio Ag Holdings LLC
- Queensland Organics
- SEIPASA SA
- SPIC Ltd.
- Sustane Natural Fertilizer Inc.
- T.Stanes and Co. Ltd.
- The Scotts Miracle Gro Co.
Qualitative and quantitative analysis of companies has been conducted to help clients understand the wider business environment as well as the strengths and weaknesses of key industry players. Data is qualitatively analyzed to categorize companies as pure play, category-focused, industry-focused, and diversified; it is quantitatively analyzed to categorize companies as dominant, leading, strong, tentative, and weak.
Recent Development and News in Organic fertilizers market
- In July, 2025, Marrone Bio Innovations launched a line of fortified organic fertilizers enriched with micronutrients to improve soil health and enhance crop resilience against climate stress.
- In June, 2025, BioStar Organics partnered with Midwest farmers to deploy nutrient-enriched compost blends for large-scale row crop production, improving soil carbon content while enhancing crop yields.
- In August, 2025, the Indian government rolled out an enhanced framework aimed at promoting sustainable agriculture, providing subsidies for organic fertilizers and supporting certified organic farming clusters.
- In March, 2025, Coromandel International Limited inaugurated a second plant in Visakhapatnam, doubling its production capacity and enhancing its fertilizer portfolio, including organic blends.
Dive into Technavio’s robust research methodology, blending expert interviews, extensive data synthesis, and validated models for unparalleled Organic Fertilizers Market insights. See full methodology.
| Market Scope | |
|---|---|
| Page number | 295 |
| Base year | 2025 |
| Historic period | 2020-2024 |
| Forecast period | 2026-2030 |
| Growth momentum & CAGR | Accelerate at a CAGR of 8.4% |
| Market growth 2026-2030 | USD 4164.5 million |
| Market structure | Fragmented |
| YoY growth 2025-2026(%) | 8.1% |
| Key countries | China, India, Australia, Japan, Indonesia, South Korea, Germany, Italy, France, Spain, UK, The Netherlands, US, Canada, Mexico, Brazil, Argentina, Colombia, UAE, Saudi Arabia, South Africa, Egypt and Nigeria |
| Competitive landscape | Leading Companies, Market Positioning of Companies, Competitive Strategies, and Industry Risks |
Research Analyst Overview
- The organic fertilizers market is evolving from a niche segment into a cornerstone of modern agricultural strategy, driven by a convergence of regulatory pressures and consumer demand for sustainability. Boardroom-level decisions are increasingly influenced by the need to secure a resilient and compliant organic input supply chain, with a focus on long-term soil fertility over short-term yield gains.
- The integration of bio-waste recycling and circular agriculture models into production has enabled some manufacturers to reduce raw material acquisition lead times by up to 20%. This operational efficiency is critical for managing costs. Innovations center on fortified organic fertilizers and bio-based nutrient blends that improve crop resilience and support regenerative farming principles.
- The adoption of compost-enriched products and sustainable nutrient solutions is no longer just an environmental choice but a strategic imperative for enhancing soil organic matter and ensuring farm viability. As such, the market is characterized by a push toward more sophisticated nutrient management and eco-friendly agricultural inputs.
What are the Key Data Covered in this Organic Fertilizers Market Research and Growth Report?
-
What is the expected growth of the Organic Fertilizers Market between 2026 and 2030?
-
USD 4.16 billion, at a CAGR of 8.4%
-
-
What segmentation does the market report cover?
-
The report is segmented by Application (Fruits and vegetables, Cereals and grains, Oilseeds and pulses, and Others), Form Factor (Dry, and Liquid), Source (Animal based, Plant based, Mineral based, and Others) and Geography (APAC, Europe, North America, South America, Middle East and Africa)
-
-
Which regions are analyzed in the report?
-
APAC, Europe, North America, South America and Middle East and Africa
-
-
What are the key growth drivers and market challenges?
-
Emergence of inorganic fertilizers, Increasing dependence on inorganic techniques of cultivation
-
-
Who are the major players in the Organic Fertilizers Market?
-
Andermatt Group AG, BASF SE, California Organic Fertilizers Inc., Coromandel International Ltd., Darling Ingredients Inc., Fertikal NV, Fertoz Ltd., FertPro Manufacturing Pty Ltd., Hello Nature Inc., J M Huber Corp., KARNATAKA AGRO CHEMICALS, KRIBHCO, Midwestern Bio Ag Holdings LLC, Queensland Organics, SEIPASA SA, SPIC Ltd., Sustane Natural Fertilizer Inc., T.Stanes and Co. Ltd. and The Scotts Miracle Gro Co.
-
Market Research Insights
- The market is shaped by a dynamic interplay between sustainability mandates and economic pragmatism. The push toward regenerative agriculture practices is compelling a re-evaluation of the entire organic input supply chain. Farms implementing integrated nutrient management systems report up to a 10% greater resilience to climate-related stress, a metric influencing operational planning.
- Furthermore, the use of advanced compost blends and precision nutrient application techniques has been shown to reduce input wastage by over 20%, directly improving cost efficiencies. As organic certification standards become more stringent, the focus on certified organic inputs intensifies, with businesses that align with these sustainable soil practices better positioned for long-term market viability.
- The ability to demonstrate enhanced soil biodiversity and improved crop quality is becoming a key differentiator.
We can help! Our analysts can customize this organic fertilizers market research report to meet your requirements.
 RIA -
RIA - 
