Organic Food And Beverages Market Size 2026-2030
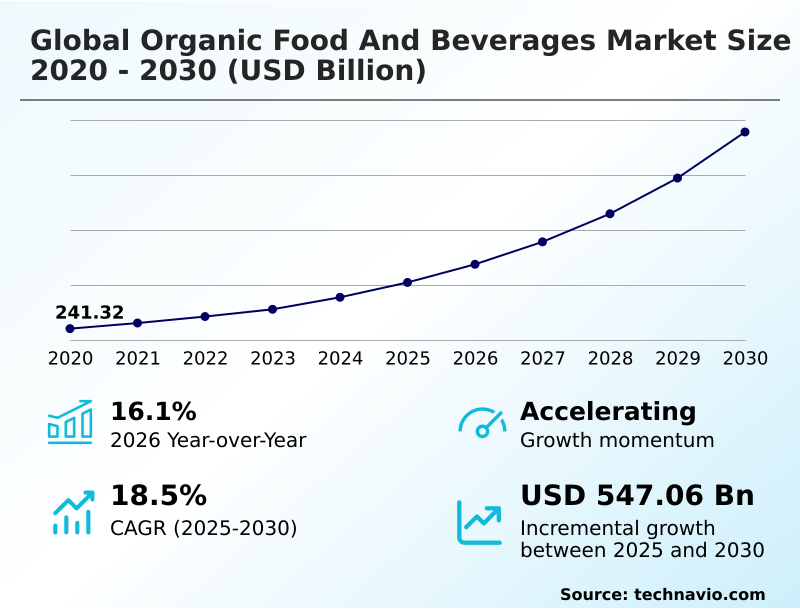
The organic food and beverages market size is valued to increase by USD 547.06 billion, at a CAGR of 18.5% from 2025 to 2030. Rise in number of new product launches will drive the organic food and beverages market.
Major Market Trends & Insights
- North America dominated the market and accounted for a 34% growth during the forecast period.
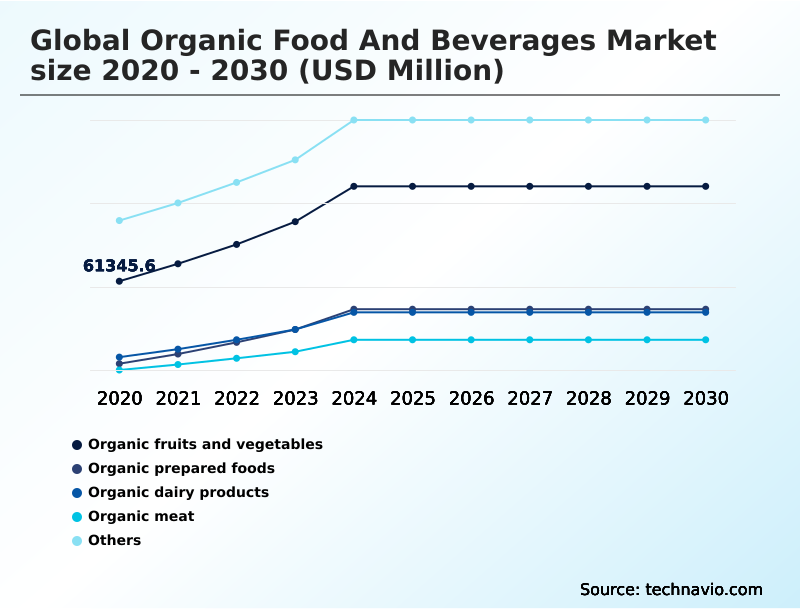
- By Product Type - Organic fruits and vegetables segment was valued at USD 94.64 billion in 2024
- By Distribution Channel - Offline segment accounted for the largest market revenue share in 2024
Market Size & Forecast
- Market Opportunities: USD 715.06 billion
- Market Future Opportunities: USD 547.06 billion
- CAGR from 2025 to 2030 : 18.5%
Market Summary
- The organic food and beverages market is expanding as consumers increasingly prioritize health, safety, and environmental stewardship. This growth is propelled by a demand for clean label products free from synthetic chemicals and GMOs, supported by transparent sourcing and verifiable certifications.
- Innovations are moving beyond basic commodities to include value-added categories like prepared meals, functional beverages, and plant-based alternatives, meeting the needs of modern, convenience-oriented lifestyles. A key business scenario involves managing the integrity of the global supply chain.
- For instance, companies are leveraging blockchain technology to provide immutable farm-to-fork traceability, ensuring that ethical sourcing and food safety standards are maintained across international borders. This not only builds consumer trust but also streamlines compliance with diverse regulatory frameworks.
- However, the industry faces challenges from the high cost of production, which can limit accessibility for some consumers, and the complexities of maintaining strict quality control to prevent product recalls. The market's trajectory is toward greater mainstream adoption, driven by ongoing product development, strategic investments, and a growing consumer-led movement for a more sustainable and transparent food system.
What will be the Size of the Organic Food And Beverages Market during the forecast period?
Get Key Insights on Market Forecast (PDF) Get Free Sample
How is the Organic Food And Beverages Market Segmented?
The organic food and beverages industry research report provides comprehensive data (region-wise segment analysis), with forecasts and estimates in "USD million" for the period 2026-2030, as well as historical data from 2020-2024 for the following segments.
- Product type
- Organic fruits and vegetables
- Organic prepared foods
- Organic dairy products
- Organic meat
- Others
- Distribution channel
- Offline
- Online
- Type
- Fresh
- Dried
- Frozen
- Canned
- Geography
- North America
- US
- Canada
- Mexico
- Europe
- Germany
- France
- UK
- APAC
- China
- Japan
- India
- Middle East and Africa
- Saudi Arabia
- UAE
- South Africa
- South America
- Brazil
- Argentina
- Rest of World (ROW)
- North America
By Product Type Insights
The organic fruits and vegetables segment is estimated to witness significant growth during the forecast period.
The organic fruits and vegetables segment is the foundational category for the market, driven by high consumer health awareness and a preference for a preventive healthcare diet.
Shoppers prioritize products with non-gmo verification and view fresh organic produce as superior in quality and safety. The expansion of this category relies on a growing network of farms committed to soil health management and biodiversity preservation.
Producers are implementing advanced biological pest control and crop rotation techniques, which supports farm-to-fork traceability and overall food system resilience. The premiumization of organic goods is evident, with local sourcing initiatives strengthening consumer trust.
Through rigorous nutrient density analysis, producers validate that these practices yield produce with superior nutritional profiles, meeting consumer demand for clean-label products.
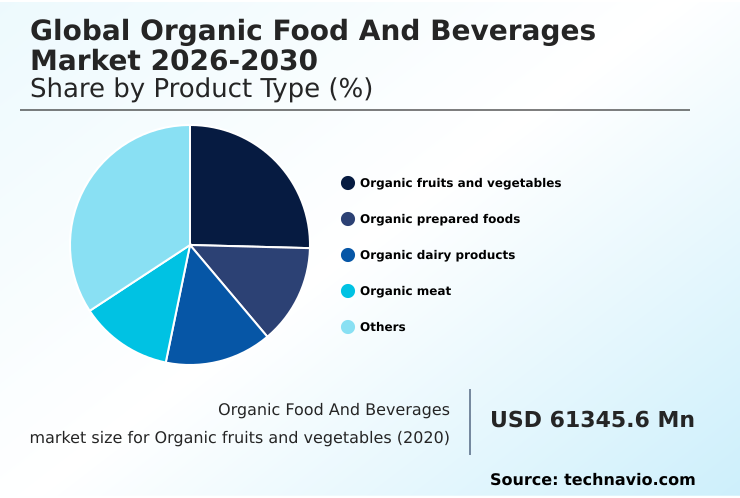
The Organic fruits and vegetables segment was valued at USD 94.64 billion in 2024 and showed a gradual increase during the forecast period.
Regional Analysis
North America is estimated to contribute 34% to the growth of the global market during the forecast period.Technavio’s analysts have elaborately explained the regional trends and drivers that shape the market during the forecast period.
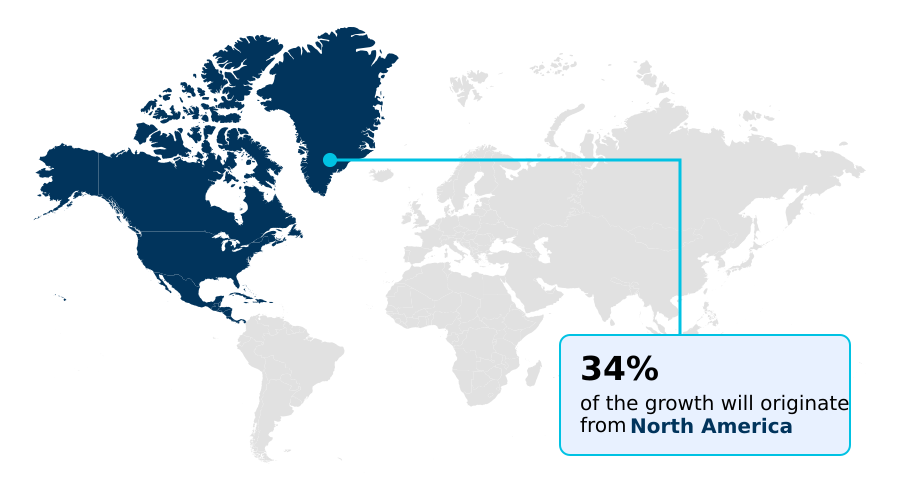
See How Organic Food And Beverages Market Demand is Rising in North America Get Free Sample
The market's geographic landscape is diversifying, with North America representing over 33% of the growth opportunity, driven by strong demand for clean label products like antibiotic-free livestock and hormone-free dairy production.
In Europe, the focus is on ecological balance principles and pasture-raised animal welfare, with a strong market for artisanal organic products. APAC is the fastest-growing region, where demand for safe organic infant nutrition is surging.
Across regions, community-supported agriculture (CSA) models are gaining traction, enhancing farm-to-fork traceability.
Innovations in natural food preservation are also expanding the availability of shelf-stable organic foods, while techniques like cover cropping methods are being adopted globally to improve soil health and food system resilience, with some regions seeing a 20% improvement in soil water retention.
Market Dynamics
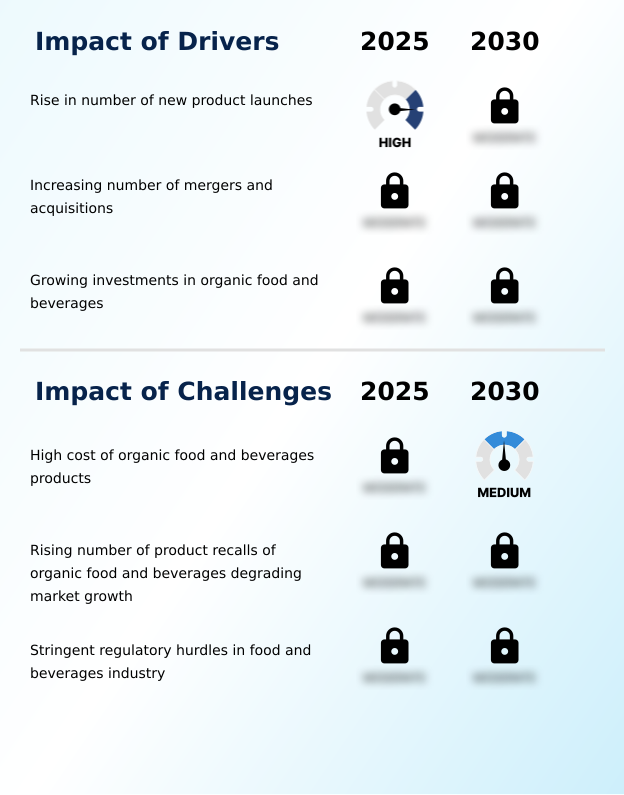
Our researchers analyzed the data with 2025 as the base year, along with the key drivers, trends, and challenges. A holistic analysis of drivers will help companies refine their marketing strategies to gain a competitive advantage.
- The global organic food and beverages market is evolving rapidly, driven by sophisticated consumer demands and technological advancements. A central theme is the impact of regenerative organic agriculture on carbon sequestration, which is becoming a key differentiator for brands.
- The role of supply chain transparency in building consumer trust cannot be overstated, especially as the market grapples with challenges in harmonizing international organic regulations. Maintaining cold chain integrity for fresh organics is a persistent operational hurdle, but innovations in natural food preservation techniques are extending shelf life and reducing waste.
- The consumer perception of gmo versus non-gmo organic labels continues to influence purchasing decisions, while the growth of the direct-to-consumer organic market offers new avenues for producers. The effectiveness of qr code traceability for food safety is improving, helping to manage microbial contamination risk in organic production.
- Furthermore, the influence of private label organic brands on market access is democratizing organic consumption. The economic viability of transitioning to organic farming is improving, thanks in part to government subsidies and advancements in biological pest control in organic farming.
- As investments in organic food tech startups grow, the industry is better equipped to adapt organic farming to climate change variability and meet the rising demand for products like antibiotic-free organic meat.
What are the key market drivers leading to the rise in the adoption of Organic Food And Beverages Industry?
- The increasing number of new product launches is a key driver propelling the growth of the organic food and beverages market.
- Growing investments are fueling market expansion, with funding increasingly directed toward organic food tech startups that enhance sustainable farming practices and create a green supply chain. This capital enables the development of value-added organic products and plant-based organic alternatives.
- Strategic acquisitions are also a key driver, allowing established firms to integrate niche brands and their ethical sourcing protocols, expanding market reach by over 200% in some cases.
- These partnerships professionalize the sector, ensuring robust supply chain transparency and adherence to third-party certification audits.
- Maintaining cold chain integrity for products like functional organic beverages is critical, contributing to overall food security contribution and consumer trust in both major and private label organic brands.
What are the market trends shaping the Organic Food And Beverages Industry?
- Growing consumer awareness regarding the health benefits associated with organic food and beverages is an influential market trend, significantly shaping purchasing decisions and driving expansion.
- A defining trend is the shift toward holistic wellness consumption, which extends to eco-friendly packaging solutions that align with a circular economy in food. Innovations include compostable packaging materials and biodegradable food containers, with some firms seeing a 40% reduction in plastic use. Active and intelligent packaging is also emerging, extending shelf life by up to 25%.
- Regenerative organic agriculture is gaining traction, focusing on carbon sequestration in soil. Direct-to-consumer models and organic agritourism are connecting producers and consumers, often leveraging qr code traceability for enhanced transparency. This focus on sustainability and natural flavor profiles also supports the culinary heritage preservation that discerning consumers seek.
What challenges does the Organic Food And Beverages Industry face during its growth?
- The high cost of organic food and beverage products presents a key challenge that affects the growth of the industry.
- High operational costs remain a primary challenge, stemming from the labor-intensive nature of practices like synthetic chemical avoidance and the need for rigorous pesticide residue testing. Complex organic supply chain logistics and the necessity for chemical-free processing add further expense.
- Ensuring adherence to stringent food safety standards is critical, as microbial contamination screening is vital for preventing recalls that can impact consumer trust. While producers focus on food spoilage reduction and zero-waste initiatives, the investment required for technologies supporting water conservation practices or reduced tillage systems can be substantial.
- Navigating these hurdles while upholding commitments to environmental stewardship and fair trade certification is a key focus for operators in the sector. These complexities can increase overhead by up to 15% compared to conventional methods.
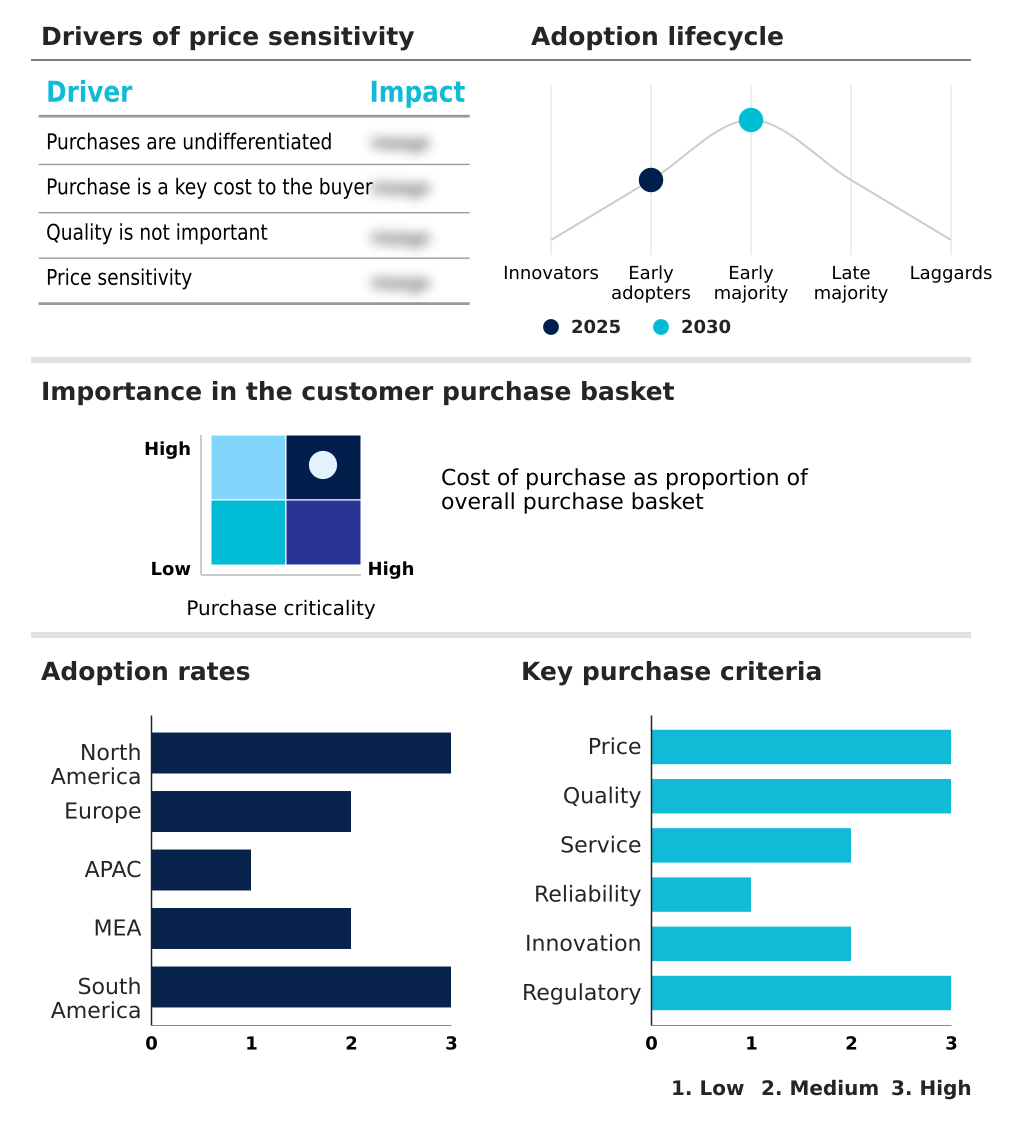
Exclusive Technavio Analysis on Customer Landscape
The organic food and beverages market forecasting report includes the adoption lifecycle of the market, covering from the innovator’s stage to the laggard’s stage. It focuses on adoption rates in different regions based on penetration. Furthermore, the organic food and beverages market report also includes key purchase criteria and drivers of price sensitivity to help companies evaluate and develop their market growth analysis strategies.
Customer Landscape of Organic Food And Beverages Industry
Competitive Landscape
Companies are implementing various strategies, such as strategic alliances, organic food and beverages market forecast, partnerships, mergers and acquisitions, geographical expansion, and product/service launches, to enhance their presence in the industry.
Amys Kitchen Inc. - Offerings are centered on a diverse portfolio of organic food and beverages, emphasizing clean-label products and sustainable sourcing to meet rising consumer demand for healthier options.
The industry research and growth report includes detailed analyses of the competitive landscape of the market and information about key companies, including:
- Amys Kitchen Inc.
- Clif Bar and Co.
- Conagra Brands Inc.
- Dairy Farmers of America Inc.
- Danone SA
- Dole plc
- Eden Foods Inc.
- Frontier Co op.
- General Mills Inc.
- Gujarat Co. Milk Ltd.
- Kellanova
- Nestle SA
- Newmans Own Inc.
- Organic Valley
- SunOpta Inc.
- Tata Consumer Products Ltd.
- The Hain Celestial Group
- The J.M. Smucker Co.
- Unilever PLC
- United Natural Foods Inc.
Qualitative and quantitative analysis of companies has been conducted to help clients understand the wider business environment as well as the strengths and weaknesses of key industry players. Data is qualitatively analyzed to categorize companies as pure play, category-focused, industry-focused, and diversified; it is quantitatively analyzed to categorize companies as dominant, leading, strong, tentative, and weak.
Recent Development and News in Organic food and beverages market
- In September 2025, Cheery Cola, an organic soda brand, was recalled after routine testing detected possible contamination, highlighting growing challenges in maintaining strict quality standards as demand for organic products continues to surge.
- In January 2025, a leading national grocery chain announced a major expansion of its organic produce line, committing to source 60% of its fruits and vegetables from domestic organic farms by year-end.
- In March 2025, a collective of organic avocado growers in Michoacan formed a major partnership with a national retail group to supply organic certified oils and fresh fruit directly to urban consumers.
- In April 2025, a prominent German dairy cooperative announced it would convert 20% of its total production to organic certified oat and almond beverages to meet shifting consumer preferences.
Dive into Technavio’s robust research methodology, blending expert interviews, extensive data synthesis, and validated models for unparalleled Organic Food And Beverages Market insights. See full methodology.
| Market Scope | |
|---|---|
| Page number | 312 |
| Base year | 2025 |
| Historic period | 2020-2024 |
| Forecast period | 2026-2030 |
| Growth momentum & CAGR | Accelerate at a CAGR of 18.5% |
| Market growth 2026-2030 | USD 547058.6 million |
| Market structure | Fragmented |
| YoY growth 2025-2026(%) | 16.1% |
| Key countries | US, Canada, Mexico, Germany, France, UK, Italy, The Netherlands, Spain, China, Japan, India, Australia, South Korea, Indonesia, Saudi Arabia, UAE, South Africa, Israel, Turkey, Brazil, Argentina and Chile |
| Competitive landscape | Leading Companies, Market Positioning of Companies, Competitive Strategies, and Industry Risks |
Research Analyst Overview
- The organic food and beverages market is defined by a deep consumer commitment to products derived from sustainable farming practices, where synthetic chemical avoidance and rigorous pesticide residue testing are standard. Boardroom-level strategy is increasingly focused on risk mitigation through enhanced supply chain transparency, particularly in response to potential microbial contamination screening failures.
- Firms are investing in technologies that ensure food safety standards and cold chain integrity from farm to shelf. The competitive landscape compels innovation in chemical-free processing and natural food preservation. Adherence to ethical sourcing protocols and third-party certification audits is non-negotiable for maintaining brand value.
- The market's evolution is also shaped by agricultural advancements, including biological pest control, crop rotation techniques, and cover cropping methods. Practices like reduced tillage systems and water conservation practices support carbon sequestration in soil, aligning with broader ecological balance principles. For animal-derived products, antibiotic-free livestock, hormone-free dairy production, and pasture-raised animal welfare are key differentiators.
- In response, organic food tech startups are developing functional food ingredients with distinct natural flavor profiles, supported by rigorous nutrient density analysis. Packaging is also a critical frontier, with a shift toward compostable packaging materials, biodegradable food containers, and active and intelligent packaging systems featuring qr code traceability, which can reduce verification times by over 50%.
- This focus on holistic quality and safety is solidifying the market's position in the global food system.
What are the Key Data Covered in this Organic Food And Beverages Market Research and Growth Report?
-
What is the expected growth of the Organic Food And Beverages Market between 2026 and 2030?
-
USD 547.06 billion, at a CAGR of 18.5%
-
-
What segmentation does the market report cover?
-
The report is segmented by Product Type (Organic fruits and vegetables, Organic prepared foods, Organic dairy products, Organic meat, and Others), Distribution Channel (Offline, and Online), Type (Fresh, Dried, Frozen, and Canned) and Geography (North America, Europe, APAC, Middle East and Africa, South America)
-
-
Which regions are analyzed in the report?
-
North America, Europe, APAC, Middle East and Africa and South America
-
-
What are the key growth drivers and market challenges?
-
Rise in number of new product launches, High cost of organic food and beverages products
-
-
Who are the major players in the Organic Food And Beverages Market?
-
Amys Kitchen Inc., Clif Bar and Co., Conagra Brands Inc., Dairy Farmers of America Inc., Danone SA, Dole plc, Eden Foods Inc., Frontier Co op., General Mills Inc., Gujarat Co. Milk Ltd., Kellanova, Nestle SA, Newmans Own Inc., Organic Valley, SunOpta Inc., Tata Consumer Products Ltd., The Hain Celestial Group, The J.M. Smucker Co., Unilever PLC and United Natural Foods Inc.
-
Market Research Insights
- The organic food and beverages market is shaped by a consumer base prioritizing holistic wellness consumption and a preventive healthcare diet. Strategic adoption of direct-to-consumer models has increased market penetration by 25% for certain artisanal organic products. The rise of private label organic brands is making items more accessible, contributing to overall market expansion.
- In the supply chain, advanced traceability systems are reducing recall-related losses by up to 40%, enhancing food system resilience. Furthermore, the focus on sustainable water management and clean energy in processing is a key differentiator, with producers achieving measurable reductions in their environmental footprint.
- The demand for value-added organic products, including organic infant nutrition and functional organic beverages, reflects a sophisticated consumer base seeking certified and transparent options.
We can help! Our analysts can customize this organic food and beverages market research report to meet your requirements.
 RIA -
RIA - 
