Organic Fruits and Vegetables Market Analysis, Size, and Forecast 2024-2028: North America (US, Canada, and Mexico), Europe (France, Germany, and UK), Middle East and Africa (UAE), APAC (China, India, Indonesia, Japan, Malaysia, South Korea, and Thailand), South America (Brazil), and Rest of World (ROW)

Organic Fruits and Vegetables Market Analysis, Size, and Forecast 2024-2028:
North America (US, Canada, and Mexico), Europe (France, Germany, and UK), Middle East and Africa (UAE), APAC (China, India, Indonesia, Japan, Malaysia, South Korea, and Thailand), South America (Brazil), and Rest of World (ROW)

Published: Feb 2024 148 Pages SKU: IRTNTR77530

Market Overview at a Glance

$45.03 B
Market Opportunity
8.74%
CAGR
7.95
YoY growth 2023-2024(%)

Organic Fruits and Vegetables Market Size 2024-2028

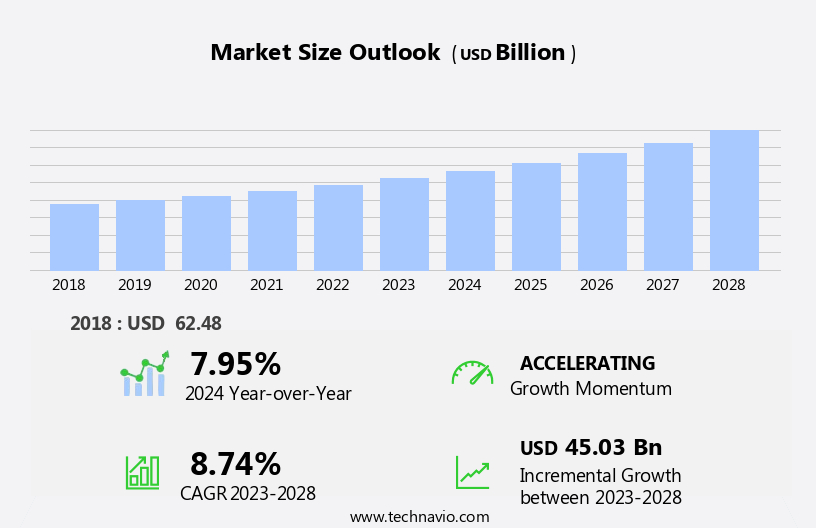
The organic fruits and vegetables market size is forecast to increase by USD 45.03 billion, at a CAGR of 8.74% between 2023 and 2028.

  • The market is experiencing significant growth, driven by the expanding organized retail sector. This sector's rise is fueled by increasing consumer preference for convenience and the desire for healthier food options. Another key trend shaping the market is the adoption of sustainable and innovative food packaging solutions. However, the market faces a notable challenge: the perceived higher cost of organic fruits and vegetables compared to their conventional counterparts. This price disparity may deter some consumers and limit market penetration. To capitalize on the growth opportunities and navigate the pricing challenge, companies can explore cost optimization strategies, such as implementing efficient supply chain management and exploring economies of scale.
  • Additionally, they can focus on educating consumers about the long-term health benefits and environmental sustainability of organic produce. By addressing these market dynamics effectively, players can differentiate themselves and capture a larger share in the market.

What will be the Size of the Organic Fruits and Vegetables Market during the forecast period?

Organic Fruits and Vegetables Market Size

Explore in-depth regional segment analysis with market size data - historical 2018-2022 and forecasts 2024-2028 - in the full report.  
Request Free Sample

The market continues to evolve, driven by consumer demand for healthier and sustainably produced food. Organic farming practices, such as the use of organic soil amendments and food safety protocols, organic farming certification, and post-harvest handling methods, are essential components of this dynamic market. These practices are not static but rather continuously unfolding, with ongoing research and innovation in areas such as plant nutrition optimization, pollinator habitat enhancement, sustainable agriculture practices, and plant disease diagnostics. Organic soil amendments play a crucial role in maintaining soil health and fertility. Farmers employ various methods, including the use of natural weed suppressants, improved harvest techniques, and soil aeration techniques, to optimize plant growth and reduce the need for synthetic inputs.

Organic matter content is a key indicator of soil health, and farmers utilize techniques such as compost tea brewing and cover cropping to enhance it. Water conservation methods, such as efficient irrigation techniques and precision agriculture tools, are also integral to the market. Crop quality parameters, including nutrient management practices and crop diversification strategies, are essential for producing high-quality organic produce. The organic farming landscape is diverse, with various farming methods employed, such as integrated crop management, biodynamic farming methods, and integrated pest management. Soil microbial communities play a critical role in organic farming, and farmers use natural fertilizer blends and organic pest control to support these communities and maintain a balanced ecosystem.

Plant disease diagnostics and sustainable agriculture practices are essential for addressing challenges in the market. Farmers use integrated pest management strategies and natural weed suppressants to minimize the use of synthetic inputs and maintain a healthy ecosystem. Pollinator habitat enhancement is another critical area of focus, with farmers employing practices such as planting cover crops and using beneficial microbial inoculants to support pollinator populations and ensure healthy crop yields. In conclusion, the market is a dynamic and evolving landscape, with ongoing research and innovation in various areas, including organic soil amendments, food safety protocols, organic farming certification, post-harvest handling methods, plant nutrition optimization, pollinator habitat enhancement, sustainable agriculture practices, and plant disease diagnostics. These practices are interconnected and continuously unfolding, with farmers employing a range of techniques to maintain soil health, optimize crop yields, and support a healthy ecosystem.

How is this Organic Fruits and Vegetables Industry segmented?

The organic fruits and vegetables industry research report provides comprehensive data (region-wise segment analysis), with forecasts and estimates in "USD billion" for the period 2024-2028, as well as historical data from 2018-2022 for the following segments.

  • Distribution Channel
    • Offline
    • Online
  • Type
    • Fresh
    • Processed
    • frozen
  • Product Type
    • Organic Fruits
    • Organic Vegetables
  • Consumer Segment
    • Household
    • Foodservice
    • Food Processing
  • Geography
    • North America
      • US
      • Canada
      • Mexico
    • Europe
      • France
      • Germany
      • UK
    • Middle East and Africa
      • UAE
    • APAC
      • China
      • India
      • Indonesia
      • Japan
      • Malaysia
      • South Korea
      • Thailand
    • South America
      • Brazil
    • Rest of World (ROW)

By Distribution Channel Insights

The offline segment is estimated to witness significant growth during the forecast period.

The market is witnessing significant growth, driven in part by the offline distribution channel. Consumers value the personal experience and trust associated with purchasing these products from brick-and-mortar stores, farmers' markets, and specialist retailers. The ability to inspect quality and freshness firsthand increases consumer confidence. Competent staff in physical stores also educate customers about the organic farming practices, such as nutrient management, water conservation, and crop rotation, that contribute to the production of organic produce. The perishable nature of organic fruits and vegetables aligns with the instant availability offered by traditional retailers. Additionally, this purchasing experience caters to environmentally conscious consumers who prioritize sustainability, including practices like soil aeration, pollinator habitat enhancement, and integrated pest management.

The market is further characterized by the use of organic farming certification, post-harvest handling methods, and natural fertilizer blends to maintain food safety and optimize plant nutrition. The integration of precision agriculture tools and efficient irrigation techniques also enhances crop quality parameters and soil health improvement. The market is continually evolving, with a focus on improving harvest techniques, utilizing beneficial microbial inoculants, and employing biodynamic farming methods and cover cropping techniques to enhance soil fertility and reduce reliance on synthetic inputs.

Organic Fruits and Vegetables Market Size

Request Free Sample

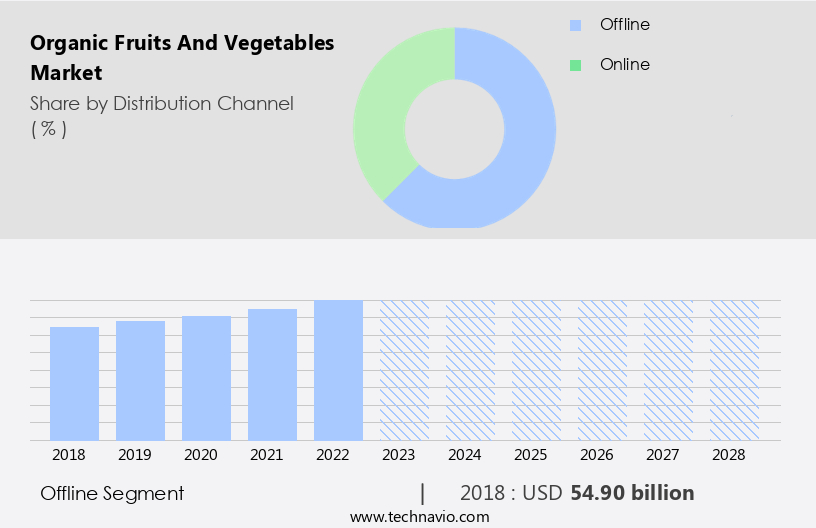
The Offline segment was valued at USD 54.90 billion in 2018 and showed a gradual increase during the forecast period.

Regional Analysis

North America is estimated to contribute 41% to the growth of the global market during the forecast period.Technavio's analysts have elaborately explained the regional trends and drivers that shape the market during the forecast period.

Organic Fruits and Vegetables Market Share by Geography

 Request Free Sample

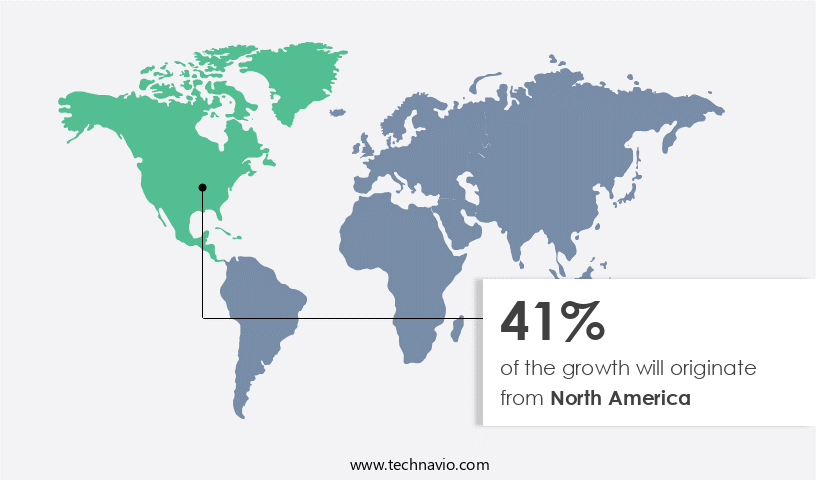
The market in North America is experiencing significant growth due to increasing consumer preference for healthier and sustainably produced food options. This trend is driven by heightened awareness of the environmental and health benefits associated with organic farming practices. Strict organic certification criteria, regulatory support, and the integration of various techniques such as organic weed management, beneficial microbial inoculants, nutrient management practices, water conservation methods, crop rotation strategies, natural weed suppressants, improved harvest techniques, soil aeration techniques, organic soil amendments, and food safety protocols, contribute to the market's expansion. Additionally, the proliferation of farmers' markets and the growing availability of organic fruits and vegetables in major grocery stores have fueled demand.

Furthermore, the rise of e-commerce platforms enables easy access to these products, broadening their reach. Sustainable agriculture practices, such as pollinator habitat enhancement, integrated crop management, soil microbial communities, biodynamic farming methods, cover cropping techniques, compost tea brewing, soil fertility enhancement, efficient irrigation techniques, precision agriculture tools, and crop quality parameters, are all integral components of the organic farming industry. Organic matter content, crop diversification strategies, soil health improvement, integrated pest management, natural fertilizer blends, and organic pest control are also essential aspects of the market. The market's evolution reflects a commitment to plant nutrition optimization, sustainable farming practices, and the preservation of the environment.

Market Dynamics

Our researchers analyzed the data with 2023 as the base year, along with the key drivers, trends, and challenges. A holistic analysis of drivers will help companies refine their marketing strategies to gain a competitive advantage.

The market continues to evolve, driven by consumer demand for healthier and more sustainable food options. Farmers employ various strategies to manage pests organically, such as improving soil health through cover crops and enhancing soil microbial diversity. Vegetable disease resistance mechanisms and optimizing nutrient uptake in organic farming and organic fresh food are also crucial. Sustainable pest control methods on organic farms include efficient irrigation techniques, monitoring soil microbial communities, and natural weed control methods. Organic produce quality parameters, such as color, texture, and taste, are closely monitored during post-harvest handling. The carbon sequestration potential of organic soils is a significant benefit, as is the use of organic fertilizers to improve nutrient use efficiency and fruit quality. Organic farming certification requirements ensure adherence to strict standards, while soil health indicators provide valuable insights into the sustainability of organic agriculture. The benefits of organic farming extend beyond food production, with positive impacts on biodiversity and the environment. Organic farming systems promote improved nutrient use efficiency, reduced pest pressure, and the use of beneficial organisms to maintain soil health. Organic vegetable storage techniques preserve the freshness and quality of produce, ensuring consumers receive the best possible product. Overall, the market is a dynamic and ever-evolving sector that continues to gain momentum.

What are the key market drivers leading to the rise in the adoption of Organic Fruits and Vegetables Industry?

  • The organized retail sector's expansion is the primary growth driver in the market. The market is experiencing significant growth due to the increasing focus on organic farming practices. companies are implementing various techniques such as organic weed management using natural weed suppressants and beneficial microbial inoculants, as well as nutrient management practices and water conservation methods, to enhance crop productivity and quality. Crop rotation strategies are also being adopted to maintain soil health and prevent the build-up of pests and diseases. Improved harvest techniques and soil aeration methods further contribute to the market's expansion.
  • Organized retailing, including supermarkets and hypermarkets, plays a crucial role in the distribution of organic fruits and vegetables, providing consumers with instant access to a diverse range of options. These channels facilitate the growth of the market by enabling companies to expand their reach and increase sales volumes.

What are the market trends shaping the Organic Fruits and Vegetables Industry?

  • Sustainable and innovative packaging solutions are gaining popularity in the market, making it essential for businesses to adopt such practices. This trend reflects a growing consumer preference for eco-friendly and technologically advanced packaging options.
  • The market is experiencing growth driven by consumer preferences for sustainable farming practices and eco-friendly packaging. Organic farming certification ensures the use of organic soil amendments, adherence to food safety protocols, and optimization of plant nutrition through sustainable agriculture practices. Post-harvest handling methods focus on preserving produce quality and reducing waste. Additionally, organic farming promotes pollinator habitat enhancement and plant disease diagnostics, contributing to a healthier and more sustainable food supply. In response to consumer demand, the market is transitioning to more environmentally friendly packaging.
  • This includes the use of biodegradable materials, compostable packaging, and reduced plastic consumption. Innovations in packaging aim to minimize waste, utilize renewable resources, and adopt solutions with a lower carbon footprint. These shifts reflect the market's commitment to addressing consumer concerns and promoting sustainable agriculture practices.

What challenges does the Organic Fruits and Vegetables Industry face during its growth?

  • The escalating perception that organic fruits and vegetables come with a higher cost represents a significant challenge to the growth of the industry. 
  • Organic fruits and vegetables are grown using farming practices that prioritize environmental sustainability and soil health, such as integrated crop management, cover cropping techniques, and biodynamic farming methods. These practices often involve the enhancement of soil fertility through techniques like compost tea brewing and efficient irrigation. While these methods can result in higher production costs than conventional farming due to the avoidance of synthetic pesticides, they offer numerous benefits. Consumers who prioritize health and the environment may be willing to pay the premium price for organic produce.
  • However, the perception of organic being more expensive can hinder market acceptance among price-sensitive consumers. To address this, farmers and retailers can employ precision agriculture tools to optimize production and reduce waste, making organic farming more cost-effective and accessible to a wider audience.

Exclusive Customer Landscape

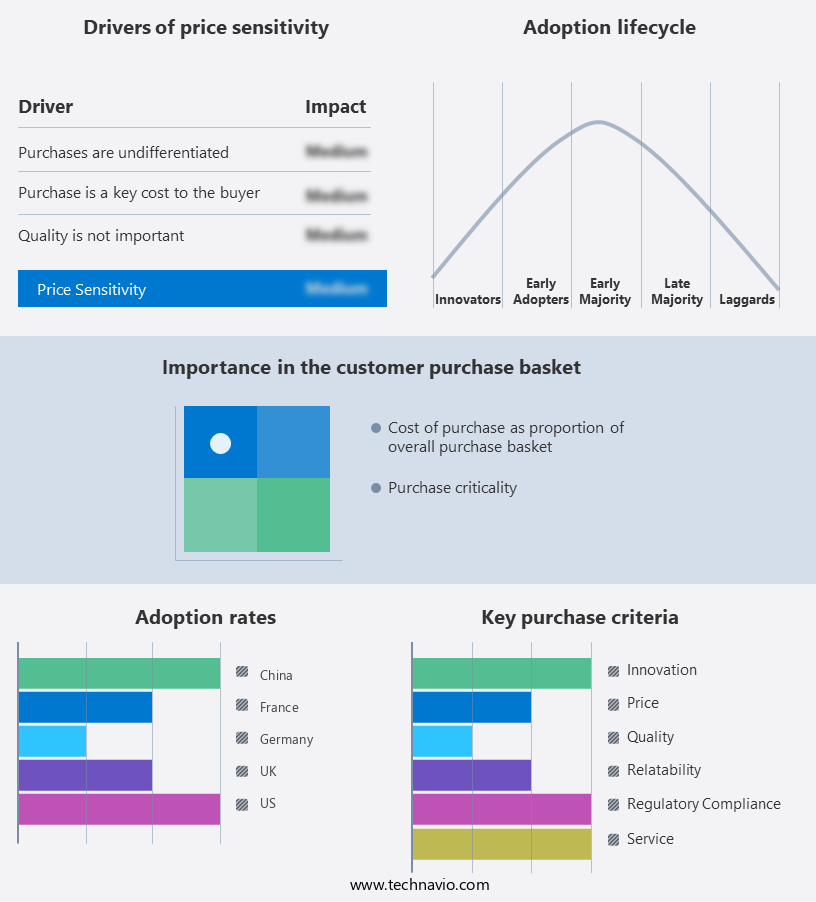
The organic fruits and vegetables market forecasting report includes the adoption lifecycle of the market, covering from the innovator's stage to the laggard's stage. It focuses on adoption rates in different regions based on penetration. Furthermore, the organic fruits and vegetables market report also includes key purchase criteria and drivers of price sensitivity to help companies evaluate and develop their market growth analysis strategies.

Organic Fruits and Vegetables Market Share by Geography

 Customer Landscape

Key Companies & Market Insights

Companies are implementing various strategies, such as strategic alliances, organic fruits and vegetables market forecast, partnerships, mergers and acquisitions, geographical expansion, and product/service launches, to enhance their presence in the industry.

A and A Organic Farms - This company specializes in the distribution of seasonal organic produce, including ginger, tomato, kale, broccoli, lemon, passionfruit, shallot, peas, and celery. These items are sourced with a focus on organic farming practices, ensuring consumers access to fresh, high-quality fruits and vegetables year-round.

The industry research and growth report includes detailed analyses of the competitive landscape of the market and information about key companies, including:

  • A and A Organic Farms
  • Bio Diverse Farming Pvt. Ltd.
  • BioNet
  • BIOSABOR S.A.T.
  • BLUE SKY ORGANIC FARMS
  • Cambridge Organic Food Co. Ltd.
  • Danone
  • Earls Organic Produce
  • General Mills Inc.
  • Green Organic Vegetables Inc.
  • Grimmway Enterprises Inc.
  • Kyssa Farms
  • morarka organic
  • Murgiverde S. Coop.
  • Nature Bio Foods Ltd.
  • Paradise Fruits Solutions GmbH and Co. KG
  • Phalada Agro Research Foundation
  • Sresta Natural Bioproducts Pvt. Ltd.
  • Suminter India Organics
  • Z Natural Foods LLC

Qualitative and quantitative analysis of companies has been conducted to help clients understand the wider business environment as well as the strengths and weaknesses of key industry players. Data is qualitatively analyzed to categorize companies as pure play, category-focused, industry-focused, and diversified; it is quantitatively analyzed to categorize companies as dominant, leading, strong, tentative, and weak.

Recent Development and News in Organic Fruits And Vegetables Market

  • In January 2024, Whole Foods Market, a leading organic grocery retailer, announced the expansion of its organic produce offerings by 20% in response to growing consumer demand. This expansion was revealed in their Q4 2023 earnings report (Whole Foods Market Q4 2023 Earnings Release).
  • In March 2024, Danish seed company, Danisco, and organic farming pioneer, Organic Valley, entered into a strategic partnership to develop new organic vegetable varieties using Danisco's plant breeding technologies. This collaboration aimed to increase organic vegetable production and improve crop yields, as stated in Organic Valley's press release.
  • In May 2024, BrightFarms, a leading indoor vertical farming company, secured a USD50 million Series D funding round led by Caisse de dépôt et placement du Québec and S2G Ventures. This investment will support the expansion of their hydroponic farm network and increase their organic produce offerings (BrightFarms Press Release).
  • In April 2025, the European Union (EU) approved the Organic Farming Regulation (EU) 2025/411, which sets new standards for organic farming practices and labeling. This regulation aims to increase transparency and consumer trust, as reported by the European Commission.

Research Analyst Overview

  • In the dynamic the market, farmers employ various strategies to enhance crop production and maintain soil health. Integrated nutrient management, utilizing crop residue management and organic farming inputs, fosters soil biodiversity indicators, phosphorus availability, and nutrient uptake efficiency. Growth hormone regulation and natural growth regulators contribute to disease incidence reduction and fruit maturity indices. Climate change resilience is crucial, with soil moisture monitoring, yield optimization strategies, and water use efficiency playing essential roles.
  • Organic waste recycling and carbon sequestration potential further boost profitability. Microbial diversity analysis, nitrogen fixation rates, and potassium uptake pathways are key elements of nutrient cycling processes. Soil texture assessment and pest pressure monitoring ensure farm productivity improvements and plant stress indicators maintain optimal growing conditions.

Dive into Technavio's robust research methodology, blending expert interviews, extensive data synthesis, and validated models for unparalleled Organic Fruits and Vegetables Market insights. See full methodology.

Market Scope

Report Coverage

Details

Page number

148

Base year

2023

Historic period

2018-2022

Forecast period

2024-2028

Growth momentum & CAGR

Accelerate at a CAGR of 8.74%

Market growth 2024-2028

USD 45.03 billion

Market structure

Fragmented

YoY growth 2023-2024(%)

7.95

Key countries

US, Malaysia, Indonesia, Germany, UK, South Korea, France, Canada, Brazil, Thailand, UAE, Mexico, China, Japan, and India

Competitive landscape

Leading Companies, Market Positioning of Companies, Competitive Strategies, and Industry Risks

Request Free Sample

What are the Key Data Covered in this Organic Fruits and Vegetables Market Research and Growth Report?

  • CAGR of the Organic Fruits and Vegetables industry during the forecast period
  • Detailed information on factors that will drive the growth and forecasting between 2024 and 2028
  • Precise estimation of the size of the market and its contribution of the industry in focus to the parent market
  • Accurate predictions about upcoming growth and trends and changes in consumer behaviour
  • Growth of the market across North America, Europe, APAC, Middle East and Africa, and South America
  • Thorough analysis of the market's competitive landscape and detailed information about companies
  • Comprehensive analysis of factors that will challenge the organic fruits and vegetables market growth of industry companies

We can help! Our analysts can customize this organic fruits and vegetables market research report to meet your requirements.

Get in touch

1 Executive Summary

  • 1.1 Market overview
    • Exhibit 01: Executive Summary – Chart on Market Overview
    • Exhibit 02: Executive Summary – Data Table on Market Overview
    • Exhibit 03: Executive Summary – Chart on Global Market Characteristics
    • Exhibit 04: Executive Summary – Chart on Market by Geography
    • Exhibit 05: Executive Summary – Chart on Market Segmentation by Distribution Channel
    • Exhibit 06: Executive Summary – Chart on Market Segmentation by Type
    • Exhibit 07: Executive Summary – Chart on Incremental Growth
    • Exhibit 08: Executive Summary – Data Table on Incremental Growth
    • Exhibit 09: Executive Summary – Chart on Vendor Market Positioning

2 Market Landscape

  • 2.1 Market ecosystem
    • Exhibit 10: Parent market
    • Exhibit 11: Market Characteristics

3 Market Sizing

  • 3.1 Market definition
    • Exhibit 12: Offerings of vendors included in the market definition
  • 3.2 Market segment analysis
    • Exhibit 13: Market segments
  • 3.3 Market size 2023
    • 3.4 Market outlook: Forecast for 2023-2028
      • Exhibit 14: Chart on Global - Market size and forecast 2023-2028 ($ billion)
      • Exhibit 15: Data Table on Global - Market size and forecast 2023-2028 ($ billion)
      • Exhibit 16: Chart on Global Market: Year-over-year growth 2023-2028 (%)
      • Exhibit 17: Data Table on Global Market: Year-over-year growth 2023-2028 (%)

    4 Historic Market Size

    • 4.1 Global organic fruits and vegetables market 2018 - 2022
      • Exhibit 18: Historic Market Size – Data Table on global organic fruits and vegetables market 2018 - 2022 ($ billion)
    • 4.2 Distribution Channel Segment Analysis 2018 - 2022
      • Exhibit 19: Historic Market Size – Distribution Channel Segment 2018 - 2022 ($ billion)
    • 4.3 Type Segment Analysis 2018 - 2022
      • Exhibit 20: Historic Market Size – Type Segment 2018 - 2022 ($ billion)
    • 4.4 Geography Segment Analysis 2018 - 2022
      • Exhibit 21: Historic Market Size – Geography Segment 2018 - 2022 ($ billion)
    • 4.5 Country Segment Analysis 2018 - 2022
      • Exhibit 22: Historic Market Size – Country Segment 2018 - 2022 ($ billion)

    5 Five Forces Analysis

    • 5.1 Five forces summary
      • Exhibit 23: Five forces analysis - Comparison between 2023 and 2028
    • 5.2 Bargaining power of buyers
      • Exhibit 24: Chart on Bargaining power of buyers – Impact of key factors 2023 and 2028
    • 5.3 Bargaining power of suppliers
      • Exhibit 25: Bargaining power of suppliers – Impact of key factors in 2023 and 2028
    • 5.4 Threat of new entrants
      • Exhibit 26: Threat of new entrants – Impact of key factors in 2023 and 2028
    • 5.5 Threat of substitutes
      • Exhibit 27: Threat of substitutes – Impact of key factors in 2023 and 2028
    • 5.6 Threat of rivalry
      • Exhibit 28: Threat of rivalry – Impact of key factors in 2023 and 2028
    • 5.7 Market condition
      • Exhibit 29: Chart on Market condition - Five forces 2023 and 2028

    6 Market Segmentation by Distribution Channel

    • 6.1 Market segments
      • Chart on Distribution Channel - Market share (2023-2028) (%)
      • Data Table on Distribution Channel - Market share (2023-2028) (%)
    • 6.2 Comparison by Distribution Channel
      • Chart on Comparison by Distribution Channel
      • Data Table on Comparison by Distribution Channel
    • 6.3 Offline - Market size and forecast (2023-2028)
      • Chart on Offline - Market size and forecast (2023-2028) ($ billion)
      • Data Table on Offline - Market size and forecast (2023-2028) ($ billion)
      • Chart on Offline - Year-over-year growth (2023-2028) (%)
      • Data Table on Offline - Year-over-year growth (2023-2028) (%)
    • 6.4 Online - Market size and forecast (2023-2028)
      • Chart on Online - Market size and forecast (2023-2028) ($ billion)
      • Data Table on Online - Market size and forecast (2023-2028) ($ billion)
      • Chart on Online - Year-over-year growth (2023-2028) (%)
      • Data Table on Online - Year-over-year growth (2023-2028) (%)
    • 6.5 Market opportunity by Distribution Channel
      • Market opportunity by Distribution Channel ($ billion)
      • Data Table on Market opportunity by Distribution Channel ($ billion)

    7 Market Segmentation by Type

    • 7.1 Market segments
      • Chart on Type - Market share (2023-2028) (%)
      • Data Table on Type - Market share (2023-2028) (%)
    • 7.2 Comparison by Type
      • Chart on Comparison by Type
      • Data Table on Comparison by Type
    • 7.3 Fresh - Market size and forecast (2023-2028)
      • Chart on Fresh - Market size and forecast (2023-2028) ($ billion)
      • Data Table on Fresh - Market size and forecast (2023-2028) ($ billion)
      • Chart on Fresh - Year-over-year growth (2023-2028) (%)
      • Data Table on Fresh - Year-over-year growth (2023-2028) (%)
    • 7.4 Processed - Market size and forecast (2023-2028)
      • Chart on Processed - Market size and forecast (2023-2028) ($ billion)
      • Data Table on Processed - Market size and forecast (2023-2028) ($ billion)
      • Chart on Processed - Year-over-year growth (2023-2028) (%)
      • Data Table on Processed - Year-over-year growth (2023-2028) (%)
    • 7.5 frozen - Market size and forecast (2023-2028)
      • Chart on frozen - Market size and forecast (2023-2028) ($ billion)
      • Data Table on frozen - Market size and forecast (2023-2028) ($ billion)
      • Chart on frozen - Year-over-year growth (2023-2028) (%)
      • Data Table on frozen - Year-over-year growth (2023-2028) (%)
    • 7.6 Market opportunity by Type
      • Market opportunity by Type ($ billion)
      • Data Table on Market opportunity by Type ($ billion)

    8 Market Segmentation by Product Type

    • 8.1 Market segments
      • Chart on Product Type - Market share (2023-2028) (%)
      • Data Table on Product Type - Market share (2023-2028) (%)
    • 8.2 Comparison by Product Type
      • Chart on Comparison by Product Type
      • Data Table on Comparison by Product Type
    • 8.3 Organic Fruits - Market size and forecast (2023-2028)
      • Chart on Organic Fruits - Market size and forecast (2023-2028) ($ billion)
      • Data Table on Organic Fruits - Market size and forecast (2023-2028) ($ billion)
      • Chart on Organic Fruits - Year-over-year growth (2023-2028) (%)
      • Data Table on Organic Fruits - Year-over-year growth (2023-2028) (%)
    • 8.4 Organic Vegetables - Market size and forecast (2023-2028)
      • Chart on Organic Vegetables - Market size and forecast (2023-2028) ($ billion)
      • Data Table on Organic Vegetables - Market size and forecast (2023-2028) ($ billion)
      • Chart on Organic Vegetables - Year-over-year growth (2023-2028) (%)
      • Data Table on Organic Vegetables - Year-over-year growth (2023-2028) (%)
    • 8.5 Market opportunity by Product Type
      • Market opportunity by Product Type ($ billion)
      • Data Table on Market opportunity by Product Type ($ billion)

    9 Market Segmentation by Consumer Segment

    • 9.1 Market segments
      • Chart on Consumer Segment - Market share (2023-2028) (%)
      • Data Table on Consumer Segment - Market share (2023-2028) (%)
    • 9.2 Comparison by Consumer Segment
      • Chart on Comparison by Consumer Segment
      • Data Table on Comparison by Consumer Segment
    • 9.3 Household - Market size and forecast (2023-2028)
      • Chart on Household - Market size and forecast (2023-2028) ($ billion)
      • Data Table on Household - Market size and forecast (2023-2028) ($ billion)
      • Chart on Household - Year-over-year growth (2023-2028) (%)
      • Data Table on Household - Year-over-year growth (2023-2028) (%)
    • 9.4 Foodservice - Market size and forecast (2023-2028)
      • Chart on Foodservice - Market size and forecast (2023-2028) ($ billion)
      • Data Table on Foodservice - Market size and forecast (2023-2028) ($ billion)
      • Chart on Foodservice - Year-over-year growth (2023-2028) (%)
      • Data Table on Foodservice - Year-over-year growth (2023-2028) (%)
    • 9.5 Food Processing - Market size and forecast (2023-2028)
      • Chart on Food Processing - Market size and forecast (2023-2028) ($ billion)
      • Data Table on Food Processing - Market size and forecast (2023-2028) ($ billion)
      • Chart on Food Processing - Year-over-year growth (2023-2028) (%)
      • Data Table on Food Processing - Year-over-year growth (2023-2028) (%)
    • 9.6 Market opportunity by Consumer Segment
      • Market opportunity by Consumer Segment ($ billion)
      • Data Table on Market opportunity by Consumer Segment ($ billion)

    8 Customer Landscape

    • 8.1 Customer landscape overview
      • Exhibit 58: Analysis of price sensitivity, lifecycle, customer purchase basket, adoption rates, and purchase criteria

    9 Geographic Landscape

    • 9.1 Geographic segmentation
      • Exhibit 59: Chart on Market share by geography 2023-2028 (%)
      • Exhibit 60: Data Table on Market share by geography 2023-2028 (%)
    • 9.2 Geographic comparison
      • Exhibit 61: Chart on Geographic comparison
      • Exhibit 62: Data Table on Geographic comparison
    • 9.3 North America - Market size and forecast 2023-2028
      • Exhibit 63: Chart on North America - Market size and forecast 2023-2028 ($ billion)
      • Exhibit 64: Data Table on North America - Market size and forecast 2023-2028 ($ billion)
      • Exhibit 65: Chart on North America - Year-over-year growth 2023-2028 (%)
      • Exhibit 66: Data Table on North America - Year-over-year growth 2023-2028 (%)
    • 9.4 Europe - Market size and forecast 2023-2028
      • Exhibit 67: Chart on Europe - Market size and forecast 2023-2028 ($ billion)
      • Exhibit 68: Data Table on Europe - Market size and forecast 2023-2028 ($ billion)
      • Exhibit 69: Chart on Europe - Year-over-year growth 2023-2028 (%)
      • Exhibit 70: Data Table on Europe - Year-over-year growth 2023-2028 (%)
    • 9.5 APAC - Market size and forecast 2023-2028
      • Exhibit 71: Chart on APAC - Market size and forecast 2023-2028 ($ billion)
      • Exhibit 72: Data Table on APAC - Market size and forecast 2023-2028 ($ billion)
      • Exhibit 73: Chart on APAC - Year-over-year growth 2023-2028 (%)
      • Exhibit 74: Data Table on APAC - Year-over-year growth 2023-2028 (%)
    • 9.6 Middle East and Africa - Market size and forecast 2023-2028
      • Exhibit 75: Chart on Middle East and Africa - Market size and forecast 2023-2028 ($ billion)
      • Exhibit 76: Data Table on Middle East and Africa - Market size and forecast 2023-2028 ($ billion)
      • Exhibit 77: Chart on Middle East and Africa - Year-over-year growth 2023-2028 (%)
      • Exhibit 78: Data Table on Middle East and Africa - Year-over-year growth 2023-2028 (%)
    • 9.7 South America - Market size and forecast 2023-2028
      • Exhibit 79: Chart on South America - Market size and forecast 2023-2028 ($ billion)
      • Exhibit 80: Data Table on South America - Market size and forecast 2023-2028 ($ billion)
      • Exhibit 81: Chart on South America - Year-over-year growth 2023-2028 (%)
      • Exhibit 82: Data Table on South America - Year-over-year growth 2023-2028 (%)
    • 9.8 US - Market size and forecast 2023-2028
      • Exhibit 83: Chart on US - Market size and forecast 2023-2028 ($ billion)
      • Exhibit 84: Data Table on US - Market size and forecast 2023-2028 ($ billion)
      • Exhibit 85: Chart on US - Year-over-year growth 2023-2028 (%)
      • Exhibit 86: Data Table on US - Year-over-year growth 2023-2028 (%)
    • 9.9 China - Market size and forecast 2023-2028
      • Exhibit 87: Chart on China - Market size and forecast 2023-2028 ($ billion)
      • Exhibit 88: Data Table on China - Market size and forecast 2023-2028 ($ billion)
      • Exhibit 89: Chart on China - Year-over-year growth 2023-2028 (%)
      • Exhibit 90: Data Table on China - Year-over-year growth 2023-2028 (%)
    • 9.10 Germany - Market size and forecast 2023-2028
      • Exhibit 91: Chart on Germany - Market size and forecast 2023-2028 ($ billion)
      • Exhibit 92: Data Table on Germany - Market size and forecast 2023-2028 ($ billion)
      • Exhibit 93: Chart on Germany - Year-over-year growth 2023-2028 (%)
      • Exhibit 94: Data Table on Germany - Year-over-year growth 2023-2028 (%)
    • 9.11 UK - Market size and forecast 2023-2028
      • Exhibit 95: Chart on UK - Market size and forecast 2023-2028 ($ billion)
      • Exhibit 96: Data Table on UK - Market size and forecast 2023-2028 ($ billion)
      • Exhibit 97: Chart on UK - Year-over-year growth 2023-2028 (%)
      • Exhibit 98: Data Table on UK - Year-over-year growth 2023-2028 (%)
    • 9.12 France - Market size and forecast 2023-2028
      • Exhibit 99: Chart on France - Market size and forecast 2023-2028 ($ billion)
      • Exhibit 100: Data Table on France - Market size and forecast 2023-2028 ($ billion)
      • Exhibit 101: Chart on France - Year-over-year growth 2023-2028 (%)
      • Exhibit 102: Data Table on France - Year-over-year growth 2023-2028 (%)
    • 9.13 Market opportunity by geography
      • Exhibit 103: Market opportunity by geography ($ billion)
      • Exhibit 104: Data Tables on Market opportunity by geography ($ billion)
    • 11.14 Malaysia - Market size and forecast (2023-2028)
      • Chart on Malaysia - Market size and forecast (2023-2028) ($ billion)
      • Data Table on Malaysia - Market size and forecast (2023-2028) ($ billion)
      • Chart on Malaysia - Year-over-year growth (2023-2028) (%)
      • Data Table on Malaysia - Year-over-year growth (2023-2028) (%)
    • 11.15 Indonesia - Market size and forecast (2023-2028)
      • Chart on Indonesia - Market size and forecast (2023-2028) ($ billion)
      • Data Table on Indonesia - Market size and forecast (2023-2028) ($ billion)
      • Chart on Indonesia - Year-over-year growth (2023-2028) (%)
      • Data Table on Indonesia - Year-over-year growth (2023-2028) (%)
    • 11.16 South Korea - Market size and forecast (2023-2028)
      • Chart on South Korea - Market size and forecast (2023-2028) ($ billion)
      • Data Table on South Korea - Market size and forecast (2023-2028) ($ billion)
      • Chart on South Korea - Year-over-year growth (2023-2028) (%)
      • Data Table on South Korea - Year-over-year growth (2023-2028) (%)
    • 11.17 Canada - Market size and forecast (2023-2028)
      • Chart on Canada - Market size and forecast (2023-2028) ($ billion)
      • Data Table on Canada - Market size and forecast (2023-2028) ($ billion)
      • Chart on Canada - Year-over-year growth (2023-2028) (%)
      • Data Table on Canada - Year-over-year growth (2023-2028) (%)
    • 11.18 Brazil - Market size and forecast (2023-2028)
      • Chart on Brazil - Market size and forecast (2023-2028) ($ billion)
      • Data Table on Brazil - Market size and forecast (2023-2028) ($ billion)
      • Chart on Brazil - Year-over-year growth (2023-2028) (%)
      • Data Table on Brazil - Year-over-year growth (2023-2028) (%)
    • 11.19 Thailand - Market size and forecast (2023-2028)
      • Chart on Thailand - Market size and forecast (2023-2028) ($ billion)
      • Data Table on Thailand - Market size and forecast (2023-2028) ($ billion)
      • Chart on Thailand - Year-over-year growth (2023-2028) (%)
      • Data Table on Thailand - Year-over-year growth (2023-2028) (%)
    • 11.20 UAE - Market size and forecast (2023-2028)
      • Chart on UAE - Market size and forecast (2023-2028) ($ billion)
      • Data Table on UAE - Market size and forecast (2023-2028) ($ billion)
      • Chart on UAE - Year-over-year growth (2023-2028) (%)
      • Data Table on UAE - Year-over-year growth (2023-2028) (%)
    • 11.21 Mexico - Market size and forecast (2023-2028)
      • Chart on Mexico - Market size and forecast (2023-2028) ($ billion)
      • Data Table on Mexico - Market size and forecast (2023-2028) ($ billion)
      • Chart on Mexico - Year-over-year growth (2023-2028) (%)
      • Data Table on Mexico - Year-over-year growth (2023-2028) (%)
    • 11.22 Japan - Market size and forecast (2023-2028)
      • Chart on Japan - Market size and forecast (2023-2028) ($ billion)
      • Data Table on Japan - Market size and forecast (2023-2028) ($ billion)
      • Chart on Japan - Year-over-year growth (2023-2028) (%)
      • Data Table on Japan - Year-over-year growth (2023-2028) (%)
    • 11.23 India - Market size and forecast (2023-2028)
      • Chart on India - Market size and forecast (2023-2028) ($ billion)
      • Data Table on India - Market size and forecast (2023-2028) ($ billion)
      • Chart on India - Year-over-year growth (2023-2028) (%)
      • Data Table on India - Year-over-year growth (2023-2028) (%)
    • 11.24 Rest of World (ROW) - Market size and forecast (2023-2028)
      • Chart on Rest of World (ROW) - Market size and forecast (2023-2028) ($ billion)
      • Data Table on Rest of World (ROW) - Market size and forecast (2023-2028) ($ billion)
      • Chart on Rest of World (ROW) - Year-over-year growth (2023-2028) (%)
      • Data Table on Rest of World (ROW) - Year-over-year growth (2023-2028) (%)

    10 Drivers, Challenges, and Trends

    • 10.1 Market drivers
      • 10.2 Market challenges
        • 10.3 Impact of drivers and challenges
          • Exhibit 105: Impact of drivers and challenges in 2023 and 2028
        • 10.4 Market trends

          11 Vendor Landscape

          • 11.1 Overview
            • 11.2 Vendor landscape
              • Exhibit 106: Overview on Criticality of inputs and Factors of differentiation
            • 11.3 Landscape disruption
              • Exhibit 107: Overview on factors of disruption
            • 11.4 Industry risks
              • Exhibit 108: Impact of key risks on business

            12 Vendor Analysis

            • 12.1 Vendors covered
              • Exhibit 109: Vendors covered
            • 12.2 Market positioning of vendors
              • Exhibit 110: Matrix on vendor position and classification
            • 12.3 A and A Organic Farms
              • Exhibit 111: A and A Organic Farms - Overview
              • Exhibit 112: A and A Organic Farms - Product / Service
              • Exhibit 113: A and A Organic Farms - Key offerings
            • 12.4 Bio Diverse Farming Pvt. Ltd.
              • Exhibit 114: Bio Diverse Farming Pvt. Ltd. - Overview
              • Exhibit 115: Bio Diverse Farming Pvt. Ltd. - Product / Service
              • Exhibit 116: Bio Diverse Farming Pvt. Ltd. - Key offerings
            • 12.5 BLUE SKY ORGANIC FARMS
              • Exhibit 117: BLUE SKY ORGANIC FARMS - Overview
              • Exhibit 118: BLUE SKY ORGANIC FARMS - Product / Service
              • Exhibit 119: BLUE SKY ORGANIC FARMS - Key offerings
            • 12.6 Cambridge Organic Food Co. Ltd.
              • Exhibit 120: Cambridge Organic Food Co. Ltd. - Overview
              • Exhibit 121: Cambridge Organic Food Co. Ltd. - Product / Service
              • Exhibit 122: Cambridge Organic Food Co. Ltd. - Key offerings
            • 12.7 Danone
              • Exhibit 123: Danone - Overview
              • Exhibit 124: Danone - Business segments
              • Exhibit 125: Danone - Key news
              • Exhibit 126: Danone - Key offerings
              • Exhibit 127: Danone - Segment focus
            • 12.8 General Mills Inc.
              • Exhibit 128: General Mills Inc. - Overview
              • Exhibit 129: General Mills Inc. - Business segments
              • Exhibit 130: General Mills Inc. - Key news
              • Exhibit 131: General Mills Inc. - Key offerings
              • Exhibit 132: General Mills Inc. - Segment focus
            • 12.9 Green Organic Vegetables Inc.
              • Exhibit 133: Green Organic Vegetables Inc. - Overview
              • Exhibit 134: Green Organic Vegetables Inc. - Product / Service
              • Exhibit 135: Green Organic Vegetables Inc. - Key offerings
            • 12.10 Grimmway Enterprises Inc.
              • Exhibit 136: Grimmway Enterprises Inc. - Overview
              • Exhibit 137: Grimmway Enterprises Inc. - Product / Service
              • Exhibit 138: Grimmway Enterprises Inc. - Key offerings
            • 12.11 morarka organic
              • Exhibit 139: morarka organic - Overview
              • Exhibit 140: morarka organic - Product / Service
              • Exhibit 141: morarka organic - Key offerings
            • 12.12 Nature Bio Foods Ltd.
              • Exhibit 142: Nature Bio Foods Ltd. - Overview
              • Exhibit 143: Nature Bio Foods Ltd. - Product / Service
              • Exhibit 144: Nature Bio Foods Ltd. - Key offerings
            • 12.13 Paradise Fruits Solutions GmbH and Co. KG
              • Exhibit 145: Paradise Fruits Solutions GmbH and Co. KG - Overview
              • Exhibit 146: Paradise Fruits Solutions GmbH and Co. KG - Product / Service
              • Exhibit 147: Paradise Fruits Solutions GmbH and Co. KG - Key offerings
            • 12.14 Phalada Agro Research Foundation
              • Exhibit 148: Phalada Agro Research Foundation - Overview
              • Exhibit 149: Phalada Agro Research Foundation - Product / Service
              • Exhibit 150: Phalada Agro Research Foundation - Key offerings
            • 12.15 Sresta Natural Bioproducts Pvt. Ltd.
              • Exhibit 151: Sresta Natural Bioproducts Pvt. Ltd. - Overview
              • Exhibit 152: Sresta Natural Bioproducts Pvt. Ltd. - Product / Service
              • Exhibit 153: Sresta Natural Bioproducts Pvt. Ltd. - Key offerings
            • 12.16 Suminter India Organics
              • Exhibit 154: Suminter India Organics - Overview
              • Exhibit 155: Suminter India Organics - Product / Service
              • Exhibit 156: Suminter India Organics - Key offerings
            • 12.17 Z Natural Foods LLC
              • Exhibit 157: Z Natural Foods LLC - Overview
              • Exhibit 158: Z Natural Foods LLC - Product / Service
              • Exhibit 159: Z Natural Foods LLC - Key offerings

            13 Appendix

            • 13.1 Scope of the report
              • 13.2 Inclusions and exclusions checklist
                • Exhibit 160: Inclusions checklist
                • Exhibit 161: Exclusions checklist
              • 13.3 Currency conversion rates for US$
                • Exhibit 162: Currency conversion rates for US$
              • 13.4 Research methodology
                • Exhibit 163: Research methodology
                • Exhibit 164: Validation techniques employed for market sizing
                • Exhibit 165: Information sources
              • 13.5 List of abbreviations
                • Exhibit 166: List of abbreviations

              Research Methodology

              Technavio presents a detailed picture of the market by way of study, synthesis, and summation of data from multiple sources. The analysts have presented the various facets of the market with a particular focus on identifying the key industry influencers. The data thus presented is comprehensive, reliable, and the result of extensive research, both primary and secondary.

              INFORMATION SOURCES

              Primary sources

              • Manufacturers and suppliers
              • Channel partners
              • Industry experts
              • Strategic decision makers

              Secondary sources

              • Industry journals and periodicals
              • Government data
              • Financial reports of key industry players
              • Historical data
              • Press releases

              DATA ANALYSIS

              Data Synthesis

              • Collation of data
              • Estimation of key figures
              • Analysis of derived insights

              Data Validation

              • Triangulation with data models
              • Reference against proprietary databases
              • Corroboration with industry experts

              REPORT WRITING

              Qualitative

              • Market drivers
              • Market challenges
              • Market trends
              • Five forces analysis

              Quantitative

              • Market size and forecast
              • Market segmentation
              • Geographical insights
              • Competitive landscape

              Interested in this report?

              Get your sample now to see our research methodology and insights!

              Download Now

              Frequently Asked Questions

              Organic Fruits and Vegetables market growth will increase by $ 45.03 bn during 2024-2028 .

              The Organic Fruits and Vegetables market is expected to grow at a CAGR of 8.74% during 2024-2028 .

              Organic Fruits and Vegetables market is segmented by Distribution Channel( Offline, Online) Type( Fresh, Processed, frozen)

              A and A Organic Farms, Bio Diverse Farming Pvt. Ltd., BioNet, BIOSABOR S.A.T., BLUE SKY ORGANIC FARMS, Cambridge Organic Food Co. Ltd., Danone, Earls Organic Produce, General Mills Inc., Green Organic Vegetables Inc., Grimmway Enterprises Inc., Kyssa Farms, morarka organic, Murgiverde S. Coop., Nature Bio Foods Ltd., Paradise Fruits Solutions GmbH and Co. KG, Phalada Agro Research Foundation, Sresta Natural Bioproducts Pvt. Ltd., Suminter India Organics, Z Natural Foods LLC are a few of the key vendors in the Organic Fruits and Vegetables market.

              North America will register the highest growth rate of 41% among the other regions. Therefore, the Organic Fruits and Vegetables market in North America is expected to garner significant business opportunities for the vendors during the forecast period.

              US, Malaysia, Indonesia, Germany, UK, South Korea, France, Canada, Brazil, Thailand, UAE, Mexico, China, Japan, India

              • Growth of organized retail sectorThe growth of organized retailing across the world is a major factor that will positively influence the growth of the global organic fruits and vegetables market during the forecast period. To generate more sales volumes and revenue is the driving factor this market.
              • vendors continuously focus on strengthening their distribution networks through organized retailing. Organized retailing has grown with the establishment of several supermarkets is the driving factor this market.
              • hypermarkets is the driving factor this market.
              • and specialty stores. Hypermarkets and supermarkets are the two major offline distribution channels for organic fruits and vegetables. Organized retailing is an integral part of the offline distribution channel is the driving factor this market.
              • which facilitates the instant availability of a wide variety of organic fruits and vegetables for consumers and enables them to choose from a diverse range of fruits and vegetables. Walmart Inc. is the driving factor this market.
              • Carrefour is the driving factor this market.
              • The Kroger Co. is the driving factor this market.
              • and Penny market are some major supermarkets worldwide that offer a range of fruits and vegetables. A rise in the number of organized retailers that offer more shelf space for organic fruits and vegetables will increase the availability of a wide variety of organic fruits and vegetables in the global marketplace. Owing to the growth of the organized retail sector is the driving factor this market.
              • the penetration of organic fruits and vegetables in a wider customer base is expected to drive the significant demand for organic fruits and vegetables is the driving factor this market.
              • which in turn is expected to drive the growth of the global organic fruits and vegetables market during the forecast period. is the driving factor this market.

              The Organic Fruits and Vegetables market vendors should focus on grabbing business opportunities from the Offline segment as it accounted for the largest market share in the base year.