Organizational Network Analysis Tools Market Analysis, Size, and Forecast 2026-2030: North America (US, Canada, and Mexico), Europe (Germany, UK, and France), APAC (China, Japan, and India), South America (Brazil, Argentina, and Colombia), Middle East and Africa (Saudi Arabia, UAE, and South Africa), and Rest of World (ROW)

Organizational Network Analysis Tools Market Analysis, Size, and Forecast 2026-2030:
North America (US, Canada, and Mexico), Europe (Germany, UK, and France), APAC (China, Japan, and India), South America (Brazil, Argentina, and Colombia), Middle East and Africa (Saudi Arabia, UAE, and South Africa), and Rest of World (ROW)

Published: May 2026 298 Pages SKU: IRTNTR81340

Market Overview at a Glance

$597.5 Mn
Market Opportunity
16.9%
CAGR 2025 - 2030
40.3%
North America Growth
$333.5 Mn
Cloud based segment 2024

Organizational Network Analysis Tools Market Size and Growth Forecast 2026-2030

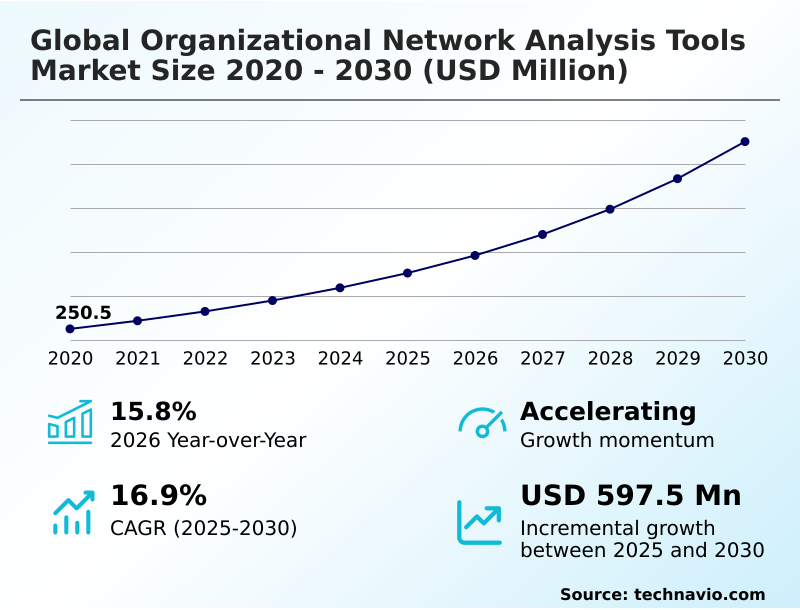
The Organizational Network Analysis Tools Market size was valued at USD 504.3 million in 2025 growing at a CAGR of 16.9% during the forecast period 2026-2030.

North America accounts for 40.3% of incremental growth during the forecast period. The Cloud based segment by Deployment was valued at USD 333.5 million in 2024, while the OND and mapping segment holds the largest revenue share by Application.

The market is projected to grow by USD 851.3 million from 2020 to 2030, with USD 597.5 million of the growth expected during the forecast period of 2025 to 2030.

Get Key Insights on Market Forecast (PDF) Request Free Sample

Organizational Network Analysis Tools Market Overview

The organizational network analysis tools market is expanding as enterprises move beyond static charts to map the actual flow of information and influence. With a notable year-over-year growth of 15.8%, demand is driven by the need for visibility into digital collaboration patterns, especially as North America contributes over 40% of the market's incremental growth. These tools apply social network analysis to provide relational analytics, which is critical for effective human capital management. For instance, a global financial services firm undergoing a merger utilizes passive data collection to map its organizational graph, identifying informal leaders and potential knowledge flow mapping bottlenecks. By analyzing this communication metadata, the firm's leadership can proactively manage the integration, reduce the risk of talent attrition, and ensure a smoother transition. This application of influencer identification and employee engagement analytics demonstrates the strategic value of understanding the social capital within a complex workforce.

Drivers, Trends, and Challenges in the Organizational Network Analysis Tools Market

The strategic adoption of organizational network analysis for remote teams is becoming a critical competency for global enterprises navigating decentralized workforces. By measuring collaboration patterns with AI, leadership can move beyond anecdotal evidence to gain quantitative insights into productivity and connectivity.

A primary application involves using ONA to prevent employee burnout, where platforms analyze metadata to flag signs of collaboration overload rather than individual performance, thereby addressing key privacy concerns in organizational network analysis. This is particularly crucial for companies operating under strict regulations like GDPR.

For instance, a multinational technology firm can deploy these tools for identifying informal leaders through data, empowering these influencers to champion strategic initiatives and enhance the effectiveness of ONA tools for diversity and inclusion by ensuring underrepresented groups are integrated into key communication networks.

The preference for scalable solutions is clear, with cloud-based deployments outpacing on-premises options by a ratio of more than 3-to-1, reflecting the need for agility and widespread access.

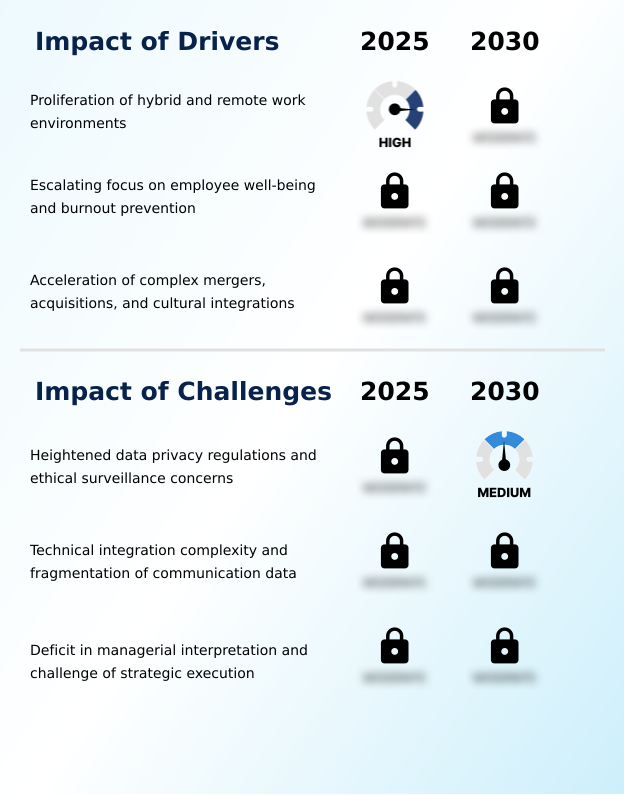
Primary Growth Driver: The proliferation of hybrid and remote work environments is a key driver for the market, necessitating tools that provide visibility into digital collaboration.

The market's notable 15.8% year-over-year growth is propelled by urgent operational demands facing modern enterprises. The widespread adoption of hybrid and remote work models has made digital collaboration mapping a necessity for maintaining organizational resilience.

Simultaneously, an escalating focus on employee well-being and burnout prevention is driving demand for analytics that can proactively identify collaboration overload and support mental health initiatives.

Furthermore, the complexities of mergers and acquisitions are a significant factor, as companies require data-driven human capital management tools to ensure successful cultural integration and prevent knowledge loss.

These drivers position organizational network analysis as a strategic imperative for managing a decentralized and dynamic workforce.

Emerging Market Trend: The integration of generative artificial intelligence for delivering prescriptive network insights represents a significant market trend. This evolution shifts tools from descriptive diagnostics to offering actionable, AI-driven recommendations.

Key trends are reshaping the market, led by the infusion of generative artificial intelligence, which is elevating platforms from descriptive visualization to providing prescriptive network insights. This convergence of relational mapping with broader workforce analytics is evident as features become embedded within comprehensive employee experience platforms.

A definitive shift toward real-time diagnostic monitoring through passive data acquisition allows for continuous analysis of collaboration patterns. This capability is particularly crucial in high-growth regions like APAC, which is expanding at a rate of 17.7% annually, enabling organizations to build dynamic structures that can adapt quickly to market changes and foster a more resilient and connected workforce.

Key Industry Challenge: Heightened data privacy regulations and ethical surveillance concerns represent a key challenge affecting industry growth and adoption.

The market faces significant headwinds, primarily from heightened data privacy regulations and ethical surveillance concerns, which create high barriers to adoption under frameworks like GDPR. This addresses fundamental privacy concerns in organizational network analysis. Another major hurdle is technical integration complexity arising from communication data fragmentation across disparate platforms, which can lead to incomplete and misleading insights.

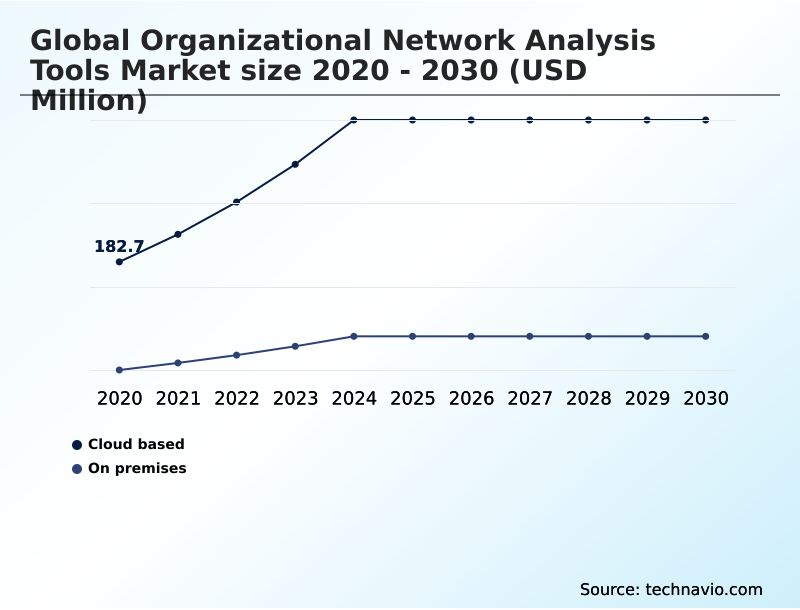
This difficulty is partly why the on-premises segment's market size is less than a third of the cloud segment. Finally, a persistent deficit in managerial interpretation and the difficulty of strategic execution—translating abstract network metrics into concrete business actions—can undermine the technology's perceived value and return on investment.

Explore Full Market Dynamics Analysis Request Free Sample

Organizational Network Analysis Tools Market Segmentation

The organizational network analysis tools industry research report provides comprehensive data including region-wise segment analysis, with forecasts and analysis for the period 2026-2030, as well as historical data from 2020-2024 for the following segments.

Market Segment by Deployment
  • Cloud based
  • On premises
Market Segment by Application
  • OND and mapping
  • CC analysis
  • LI identification
  • TK Management
  • Others
Market Segment by Business segment
  • Large enterprises
  • Small and medium enterprises
Market Segment by Geography
North America
US, Canada, Mexico
Europe
Germany, UK, France, Italy, The Netherlands, Spain
APAC
China, Japan, India, South Korea, Australia, Indonesia
South America
Brazil, Argentina, Colombia
Middle East and Africa
Saudi Arabia, UAE, South Africa, Israel, Turkey

Deployment Segment Analysis

The cloud based segment is estimated to witness significant growth during the forecast period.

The cloud based deployment model dominates the organizational network analysis tools market, accounting for over 77% of market value, driven by its scalability and rapid implementation capabilities essential for modern enterprises.

This model is critical for organizations supporting digital workplace collaboration across hybrid and remote teams, allowing for passive data collection from diverse digital sources without on-premises hardware.

By integrating with a broader employee experience platform, cloud solutions provide real-time diagnostic monitoring of collaboration patterns.

This allows leadership to utilize relational analytics to inform human capital management strategies, focusing on interpreting data to enhance team effectiveness metrics rather than managing technology infrastructure, a key factor in its widespread adoption by US businesses.

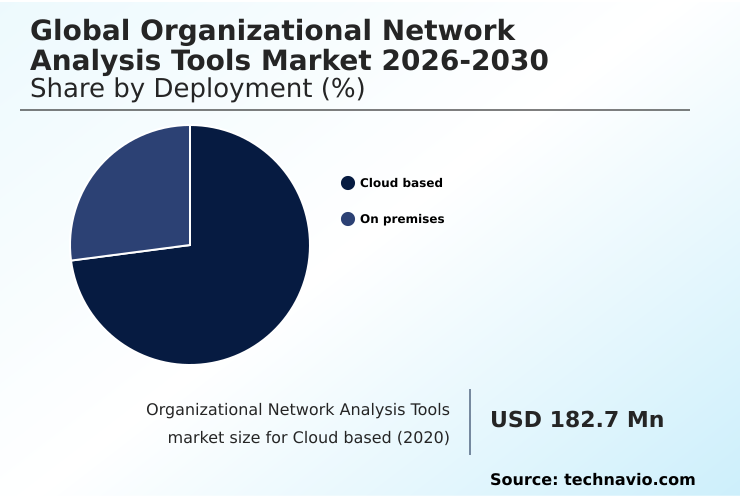
The Cloud based segment was valued at USD 333.5 million in 2024 and showed a gradual increase during the forecast period.

Organizational Network Analysis Tools Market by Region: North America Leads with 40.3% Growth Share

North America is estimated to contribute 40.3% to the growth of the global market during the forecast period.

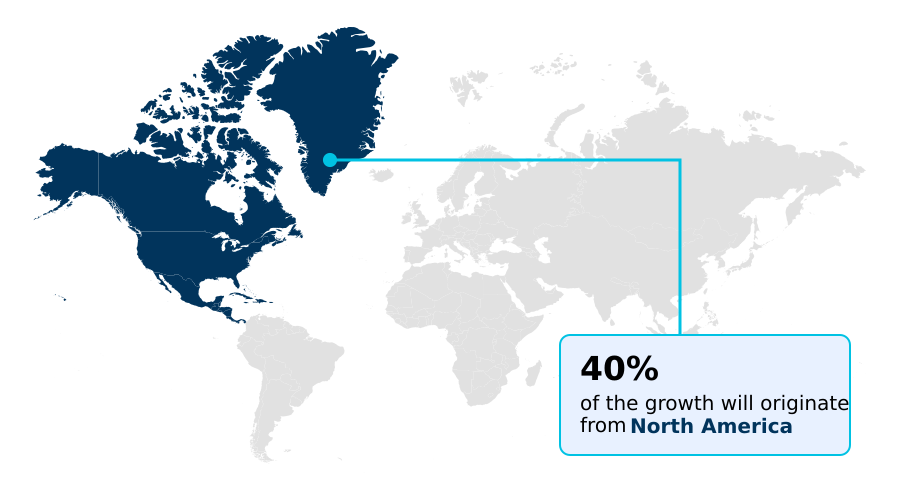
The geographic landscape is led by North America, which accounts for over 40% of the incremental growth, driven by a mature corporate culture that prioritizes data-driven human capital management and digital workplace collaboration.

In contrast, APAC, while holding a smaller 24% share, is the fastest-growing region with a 17.7% CAGR, indicating rapid adoption fueled by massive digital transformation projects.

Europe's market, contributing nearly 24% of the opportunity, is heavily shaped by data sovereignty regulations like GDPR.

This regulatory environment creates significant privacy concerns in organizational network analysis, compelling vendors to offer robust anonymization features for use cases like change management analytics and post-merger integration analytics, ensuring organizational resilience while adhering to strict compliance standards.

Customer Landscape Analysis for the Organizational Network Analysis Tools Market

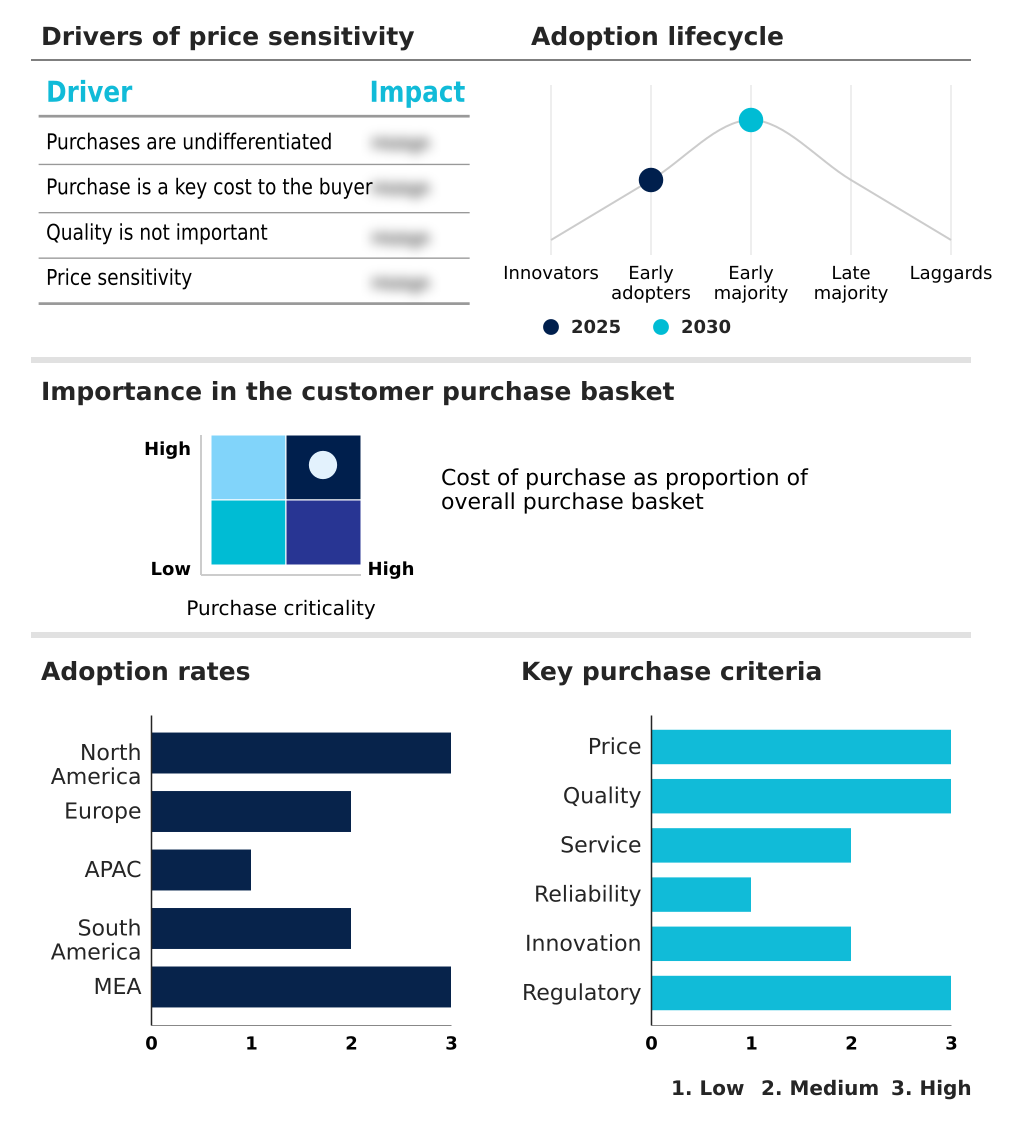
The organizational network analysis tools market forecasting report includes the adoption lifecycle of the market, covering from the innovator’s stage to the laggard’s stage. It focuses on adoption rates in different regions based on penetration. Furthermore, the organizational network analysis tools market report also includes key purchase criteria and drivers of price sensitivity to help companies evaluate and develop their market growth analysis strategies.

Competitive Landscape of the Organizational Network Analysis Tools Market

Companies are implementing various strategies, such as strategic alliances, partnerships, mergers and acquisitions, geographical expansion, and product/service launches, to enhance their presence in the organizational network analysis tools market industry.

Culture Amp Pty Ltd. - Offers network insights through an employee engagement platform, concentrating on performance analytics and cultural mapping rather than dedicated organizational network analysis.

The industry research and growth report includes detailed analyses of the competitive landscape of the market and information about key companies, including:

  • Culture Amp Pty Ltd.
  • Humanyze
  • Innovisor
  • Kumu Inc
  • Maven Seven Solutions Plc.
  • Microsoft Corp.
  • Network Perspective
  • Panalyt Inc.
  • Paycor HCM Inc.
  • Perceptyx Inc.
  • Polinode Pty Ltd.
  • Qualtrics LLC
  • Recognize Services Inc.
  • SAP SE
  • StarMeUp
  • SWOOP Analytics Pty Ltd.
  • Time is Ltd.
  • Visier Inc.
  • Workday Inc.
  • Worklytics Co

Qualitative and quantitative analysis of companies has been conducted to help clients understand the wider business environment as well as the strengths and weaknesses of key industry players. Data is qualitatively analyzed to categorize companies as pure play, category-focused, industry-focused, and diversified; it is quantitatively analyzed to categorize companies as dominant, leading, strong, tentative, and weak.

Recent Developments in the Organizational Network Analysis Tools Market

  • In April 2025, Humanyze launched an advanced generative AI interface, enabling human resources executives to query the relational health of a department using conversational prompts, thereby simplifying access to complex network insights.
  • In March 2025, Microsoft Corp. released an expansive update to its Viva Insights platform, which featured enhanced relational analytics designed to monitor the health of cross-functional ties in asynchronous work environments.
  • In May 2025, OrgMapper introduced a decentralized data processing feature, allowing firms to conduct deep network diagnostics while keeping all personnel communication data within local, encrypted environments to comply with strict privacy mandates.
  • In February 2025, Polinode released a major architectural update to its platform's relationship mapping engine, enabling the simultaneous visualization of over fifty thousand unique connection points without a loss in processing speed.

Research Analyst Overview: Organizational Network Analysis Tools Market

The market's evolution is marked by a definitive shift from periodic surveys to continuous, passive data collection, transforming how enterprises visualize their organizational graph. This transition to real-time relational analytics allows for sophisticated social network analysis, driven by a robust 15.8% year-over-year growth rate. In the boardroom, these tools are de-risking high-stakes post-merger integration decisions.

Executives now rely on knowledge flow mapping derived from communication metadata to identify and retain key personnel, a process governed by compliance frameworks like GDPR. The application of generative AI represents a significant technological leap, translating complex metrics such as network centrality and collaboration overload into prescriptive employee engagement analytics.

This empowers managers to address issues like burnout and disengagement proactively. By focusing on influencer identification, firms can better manage change and foster a more resilient and connected workforce, moving beyond simple diagnostics to strategic human capital management.

Dive into Technavio’s robust research methodology, blending expert interviews, extensive data synthesis, and validated models for unparalleled Organizational Network Analysis Tools Market insights. See full methodology.

Request Free Sample

Market Scope
Page number 298
Base year 2025
Historic period 2020-2024
Forecast period 2026-2030
Growth momentum & CAGR Accelerate at a CAGR of 16.9%
Market growth 2026-2030 USD 597.5 million
Market structure Fragmented
YoY growth 2025-2026(%) 15.8%
Key countries US, Canada, Mexico, Germany, UK, France, Italy, The Netherlands, Spain, China, Japan, India, South Korea, Australia, Indonesia, Brazil, Argentina, Colombia, Saudi Arabia, UAE, South Africa, Israel and Turkey
Competitive landscape Leading Companies, Market Positioning of Companies, Competitive Strategies, and Industry Risks

Organizational Network Analysis Tools Market: Key Questions Answered in This Report

  • What is the expected growth of the Organizational Network Analysis Tools Market between 2026 and 2030?

    • The Organizational Network Analysis Tools Market is expected to grow by USD 597.5 million during 2026-2030, registering a CAGR of 16.9%. Year-over-year growth in 2026 is estimated at 15.8%%. This acceleration is shaped by proliferation of hybrid and remote work environments, which is intensifying demand across multiple end-use verticals covered in the report.

  • What segmentation does the market report cover?

    • The report is segmented by Deployment (Cloud based, and On premises), Application (OND and mapping, CC analysis, LI identification, TK Management, and Others), Business Segment (Large enterprises, and Small and medium enterprises) and Geography (North America, Europe, APAC, South America, Middle East and Africa). Among these, the Cloud based segment is estimated to witness significant growth during the forecast period, driven by rising adoption across key application areas. Each segment includes detailed qualitative and quantitative analysis, along with historical data from 2020-2024 and forecasts through 2030 with year-over-year growth rates.

  • Which regions are analyzed in the report?

    • The report covers North America, Europe, APAC, South America and Middle East and Africa. North America is estimated to contribute 40.3% to market growth during the forecast period. Country-level analysis includes US, Canada, Mexico, Germany, UK, France, Italy, The Netherlands, Spain, China, Japan, India, South Korea, Australia, Indonesia, Brazil, Argentina, Colombia, Saudi Arabia, UAE, South Africa, Israel and Turkey, with dedicated market size tables and year-over-year growth for each.

  • What are the key growth drivers and market challenges?

    • The primary driver is proliferation of hybrid and remote work environments, which is accelerating investment and industry demand. The main challenge is heightened data privacy regulations and ethical surveillance concerns, creating operational barriers for key market participants. The report quantifies the impact of each driver and challenge across 2026 and 2030 with comparative analysis.

  • Who are the major players in the Organizational Network Analysis Tools Market?

    • Key vendors include Culture Amp Pty Ltd., Humanyze, Innovisor, Kumu Inc, Maven Seven Solutions Plc., Microsoft Corp., Network Perspective, Panalyt Inc., Paycor HCM Inc., Perceptyx Inc., Polinode Pty Ltd., Qualtrics LLC, Recognize Services Inc., SAP SE, StarMeUp, SWOOP Analytics Pty Ltd., Time is Ltd., Visier Inc., Workday Inc. and Worklytics Co. The report provides qualitative and quantitative analysis categorizing companies as dominant, leading, strong, tentative, and weak based on their market positioning. Company profiles include business segment analysis, SWOT assessment, key offerings, and recent strategic developments.

Organizational Network Analysis Tools Market Research Insights

Market dynamics are shaped by the tension between the demand for granular workforce analytics and the imperative of regulatory compliance, particularly under frameworks like the General Data Protection Regulation (GDPR). While North America currently presents over 40% of the market opportunity, significantly outpacing APAC's 24%, this growth is tempered by stringent privacy rules.

In practice, organizations are deploying sophisticated employee experience platforms to analyze team effectiveness metrics and track diversity and inclusion metrics in an aggregated, anonymized manner. This approach helps maintain organizational resilience and supports change management analytics during critical events like post-merger integration analytics, all while navigating the complex legal landscape governing employee data.

We can help! Our analysts can customize this organizational network analysis tools market research report to meet your requirements.

Get in touch

1. Executive Summary

1.1 Market overview

Executive Summary - Chart on Market Overview
Executive Summary - Data Table on Market Overview
Executive Summary - Chart on Global Market Characteristics
Executive Summary - Chart on Market by Geography
Executive Summary - Chart on Market Segmentation by Deployment
Executive Summary - Chart on Market Segmentation by Application
Executive Summary - Chart on Market Segmentation by Business Segment
Executive Summary - Chart on Incremental Growth
Executive Summary - Data Table on Incremental Growth
Executive Summary - Chart on Company Market Positioning

2. Technavio Analysis

2.1 Analysis of price sensitivity, lifecycle, customer purchase basket, adoption rates, and purchase criteria

2.2 Criticality of inputs and Factors of differentiation

Chart on Overview on criticality of inputs and factors of differentiation

2.3 Factors of disruption

Chart on Overview on factors of disruption

2.4 Impact of drivers and challenges

Chart on Impact of drivers and challenges in 2025 and 2030

3. Market Landscape

3.1 Market ecosystem

Chart on Parent Market
Data Table on - Parent Market

3.2 Market characteristics

Chart on Market characteristics analysis

3.3 Value chain analysis

Chart on Value chain analysis

4. Market Sizing

4.1 Market definition

Data Table on Offerings of companies included in the market definition

4.2 Market segment analysis

Market segments

4.3 Market size 2025

4.4 Market outlook: Forecast for 2025-2030

Chart on Global - Market size and forecast 2025-2030 ($ million)
Data Table on Global - Market size and forecast 2025-2030 ($ million)
Chart on Global Market: Year-over-year growth 2025-2030 (%)
Data Table on Global Market: Year-over-year growth 2025-2030 (%)

5. Historic Market Size

5.1 Global Organizational Network Analysis Tools Market 2020 - 2024

Historic Market Size - Data Table on Global Organizational Network Analysis Tools Market 2020 - 2024 ($ million)

5.2 Deployment segment analysis 2020 - 2024

Historic Market Size - Deployment Segment 2020 - 2024 ($ million)

5.3 Application segment analysis 2020 - 2024

Historic Market Size - Application Segment 2020 - 2024 ($ million)

5.4 Business segment analysis 2020 - 2024

Historic Market Size - Business Segment 2020 - 2024 ($ million)

5.5 Geography segment analysis 2020 - 2024

Historic Market Size - Geography Segment 2020 - 2024 ($ million)

5.6 Country segment analysis 2020 - 2024

Historic Market Size - Country Segment 2020 - 2024 ($ million)

6. Qualitative Analysis

6.1 The AI impact on Global Organizational Network Analysis Tools Market

7. Five Forces Analysis

7.1 Five forces summary

Five forces analysis - Comparison between 2025 and 2030

7.2 Bargaining power of buyers

Bargaining power of buyers - Impact of key factors 2025 and 2030

7.3 Bargaining power of suppliers

Bargaining power of suppliers - Impact of key factors in 2025 and 2030

7.4 Threat of new entrants

Threat of new entrants - Impact of key factors in 2025 and 2030

7.5 Threat of substitutes

Threat of substitutes - Impact of key factors in 2025 and 2030

7.6 Threat of rivalry

Threat of rivalry - Impact of key factors in 2025 and 2030

7.7 Market condition

Chart on Market condition - Five forces 2025 and 2030

8. Market Segmentation by Deployment

8.1 Market segments

Chart on Deployment - Market share 2025-2030 (%)
Data Table on Deployment - Market share 2025-2030 (%)

8.2 Comparison by Deployment

Chart on Comparison by Deployment
Data Table on Comparison by Deployment

8.3 Cloud based - Market size and forecast 2025-2030

Chart on Cloud based - Market size and forecast 2025-2030 ($ million)
Data Table on Cloud based - Market size and forecast 2025-2030 ($ million)
Chart on Cloud based - Year-over-year growth 2025-2030 (%)
Data Table on Cloud based - Year-over-year growth 2025-2030 (%)

8.4 On premises - Market size and forecast 2025-2030

Chart on On premises - Market size and forecast 2025-2030 ($ million)
Data Table on On premises - Market size and forecast 2025-2030 ($ million)
Chart on On premises - Year-over-year growth 2025-2030 (%)
Data Table on On premises - Year-over-year growth 2025-2030 (%)

8.5 Market opportunity by Deployment

Market opportunity by Deployment ($ million)
Data Table on Market opportunity by Deployment ($ million)

9. Market Segmentation by Application

9.1 Market segments

Chart on Application - Market share 2025-2030 (%)
Data Table on Application - Market share 2025-2030 (%)

9.2 Comparison by Application

Chart on Comparison by Application
Data Table on Comparison by Application

9.3 OND and mapping - Market size and forecast 2025-2030

Chart on OND and mapping - Market size and forecast 2025-2030 ($ million)
Data Table on OND and mapping - Market size and forecast 2025-2030 ($ million)
Chart on OND and mapping - Year-over-year growth 2025-2030 (%)
Data Table on OND and mapping - Year-over-year growth 2025-2030 (%)

9.4 CC analysis - Market size and forecast 2025-2030

Chart on CC analysis - Market size and forecast 2025-2030 ($ million)
Data Table on CC analysis - Market size and forecast 2025-2030 ($ million)
Chart on CC analysis - Year-over-year growth 2025-2030 (%)
Data Table on CC analysis - Year-over-year growth 2025-2030 (%)

9.5 LI identification - Market size and forecast 2025-2030

Chart on LI identification - Market size and forecast 2025-2030 ($ million)
Data Table on LI identification - Market size and forecast 2025-2030 ($ million)
Chart on LI identification - Year-over-year growth 2025-2030 (%)
Data Table on LI identification - Year-over-year growth 2025-2030 (%)

9.6 TK Management - Market size and forecast 2025-2030

Chart on TK Management - Market size and forecast 2025-2030 ($ million)
Data Table on TK Management - Market size and forecast 2025-2030 ($ million)
Chart on TK Management - Year-over-year growth 2025-2030 (%)
Data Table on TK Management - Year-over-year growth 2025-2030 (%)

9.7 Others - Market size and forecast 2025-2030

Chart on Others - Market size and forecast 2025-2030 ($ million)
Data Table on Others - Market size and forecast 2025-2030 ($ million)
Chart on Others - Year-over-year growth 2025-2030 (%)
Data Table on Others - Year-over-year growth 2025-2030 (%)

9.8 Market opportunity by Application

Market opportunity by Application ($ million)
Data Table on Market opportunity by Application ($ million)

10. Market Segmentation by Business Segment

10.1 Market segments

Chart on Market Segmentation by Business Segment - Market share 2025-2030 (%)
Data Table on Market Segmentation by Business Segment - Market share 2025-2030 (%)

10.2 Comparison by Market Segmentation by Business Segment

Chart on Comparison by Market Segmentation by Business Segment
Data Table on Comparison by Market Segmentation by Business Segment

10.3 Large enterprises - Market size and forecast 2025-2030

Chart on Large enterprises - Market size and forecast 2025-2030 ($ million)
Data Table on Large enterprises - Market size and forecast 2025-2030 ($ million)
Chart on Large enterprises - Year-over-year growth 2025-2030 (%)
Data Table on Large enterprises - Year-over-year growth 2025-2030 (%)

10.4 Small and medium enterprises - Market size and forecast 2025-2030

Chart on Small and medium enterprises - Market size and forecast 2025-2030 ($ million)
Data Table on Small and medium enterprises - Market size and forecast 2025-2030 ($ million)
Chart on Small and medium enterprises - Year-over-year growth 2025-2030 (%)
Data Table on Small and medium enterprises - Year-over-year growth 2025-2030 (%)

10.5 Market opportunity by Market Segmentation by Business Segment

Market opportunity by Market Segmentation by Business Segment ($ million)
Data Table on Market opportunity by Market Segmentation by Business Segment ($ million)

11. Customer Landscape

11.1 Customer landscape overview

Analysis of price sensitivity, lifecycle, customer purchase basket, adoption rates, and purchase criteria

12. Geographic Landscape

12.1 Geographic segmentation

Chart on Market share by geography 2025-2030 (%)
Data Table on Market share by geography 2025-2030 (%)

12.2 Geographic comparison

Chart on Geographic comparison
Data Table on Geographic comparison

12.3 North America - Market size and forecast 2025-2030

Chart on North America - Market size and forecast 2025-2030 ($ million)
Data Table on North America - Market size and forecast 2025-2030 ($ million)
Chart on North America - Year-over-year growth 2025-2030 (%)
Data Table on North America - Year-over-year growth 2025-2030 (%)
Chart on Regional Comparison - North America
Data Table on Regional Comparison - North America

12.3.1 US - Market size and forecast 2025-2030

Chart on US - Market size and forecast 2025-2030 ($ million)
Data Table on US - Market size and forecast 2025-2030 ($ million)
Chart on US - Year-over-year growth 2025-2030 (%)
Data Table on US - Year-over-year growth 2025-2030 (%)

12.3.2 Canada - Market size and forecast 2025-2030

Chart on Canada - Market size and forecast 2025-2030 ($ million)
Data Table on Canada - Market size and forecast 2025-2030 ($ million)
Chart on Canada - Year-over-year growth 2025-2030 (%)
Data Table on Canada - Year-over-year growth 2025-2030 (%)

12.3.3 Mexico - Market size and forecast 2025-2030

Chart on Mexico - Market size and forecast 2025-2030 ($ million)
Data Table on Mexico - Market size and forecast 2025-2030 ($ million)
Chart on Mexico - Year-over-year growth 2025-2030 (%)
Data Table on Mexico - Year-over-year growth 2025-2030 (%)

12.4 Europe - Market size and forecast 2025-2030

Chart on Europe - Market size and forecast 2025-2030 ($ million)
Data Table on Europe - Market size and forecast 2025-2030 ($ million)
Chart on Europe - Year-over-year growth 2025-2030 (%)
Data Table on Europe - Year-over-year growth 2025-2030 (%)
Chart on Regional Comparison - Europe
Data Table on Regional Comparison - Europe

12.4.1 Germany - Market size and forecast 2025-2030

Chart on Germany - Market size and forecast 2025-2030 ($ million)
Data Table on Germany - Market size and forecast 2025-2030 ($ million)
Chart on Germany - Year-over-year growth 2025-2030 (%)
Data Table on Germany - Year-over-year growth 2025-2030 (%)

12.4.2 UK - Market size and forecast 2025-2030

Chart on UK - Market size and forecast 2025-2030 ($ million)
Data Table on UK - Market size and forecast 2025-2030 ($ million)
Chart on UK - Year-over-year growth 2025-2030 (%)
Data Table on UK - Year-over-year growth 2025-2030 (%)

12.4.3 France - Market size and forecast 2025-2030

Chart on France - Market size and forecast 2025-2030 ($ million)
Data Table on France - Market size and forecast 2025-2030 ($ million)
Chart on France - Year-over-year growth 2025-2030 (%)
Data Table on France - Year-over-year growth 2025-2030 (%)

12.4.4 Italy - Market size and forecast 2025-2030

Chart on Italy - Market size and forecast 2025-2030 ($ million)
Data Table on Italy - Market size and forecast 2025-2030 ($ million)
Chart on Italy - Year-over-year growth 2025-2030 (%)
Data Table on Italy - Year-over-year growth 2025-2030 (%)

12.4.5 The Netherlands - Market size and forecast 2025-2030

Chart on The Netherlands - Market size and forecast 2025-2030 ($ million)
Data Table on The Netherlands - Market size and forecast 2025-2030 ($ million)
Chart on The Netherlands - Year-over-year growth 2025-2030 (%)
Data Table on The Netherlands - Year-over-year growth 2025-2030 (%)

12.4.6 Spain - Market size and forecast 2025-2030

Chart on Spain - Market size and forecast 2025-2030 ($ million)
Data Table on Spain - Market size and forecast 2025-2030 ($ million)
Chart on Spain - Year-over-year growth 2025-2030 (%)
Data Table on Spain - Year-over-year growth 2025-2030 (%)

12.5 APAC - Market size and forecast 2025-2030

Chart on APAC - Market size and forecast 2025-2030 ($ million)
Data Table on APAC - Market size and forecast 2025-2030 ($ million)
Chart on APAC - Year-over-year growth 2025-2030 (%)
Data Table on APAC - Year-over-year growth 2025-2030 (%)
Chart on Regional Comparison - APAC
Data Table on Regional Comparison - APAC

12.5.1 China - Market size and forecast 2025-2030

Chart on China - Market size and forecast 2025-2030 ($ million)
Data Table on China - Market size and forecast 2025-2030 ($ million)
Chart on China - Year-over-year growth 2025-2030 (%)
Data Table on China - Year-over-year growth 2025-2030 (%)

12.5.2 Japan - Market size and forecast 2025-2030

Chart on Japan - Market size and forecast 2025-2030 ($ million)
Data Table on Japan - Market size and forecast 2025-2030 ($ million)
Chart on Japan - Year-over-year growth 2025-2030 (%)
Data Table on Japan - Year-over-year growth 2025-2030 (%)

12.5.3 India - Market size and forecast 2025-2030

Chart on India - Market size and forecast 2025-2030 ($ million)
Data Table on India - Market size and forecast 2025-2030 ($ million)
Chart on India - Year-over-year growth 2025-2030 (%)
Data Table on India - Year-over-year growth 2025-2030 (%)

12.5.4 South Korea - Market size and forecast 2025-2030

Chart on South Korea - Market size and forecast 2025-2030 ($ million)
Data Table on South Korea - Market size and forecast 2025-2030 ($ million)
Chart on South Korea - Year-over-year growth 2025-2030 (%)
Data Table on South Korea - Year-over-year growth 2025-2030 (%)

12.5.5 Australia - Market size and forecast 2025-2030

Chart on Australia - Market size and forecast 2025-2030 ($ million)
Data Table on Australia - Market size and forecast 2025-2030 ($ million)
Chart on Australia - Year-over-year growth 2025-2030 (%)
Data Table on Australia - Year-over-year growth 2025-2030 (%)

12.5.6 Indonesia - Market size and forecast 2025-2030

Chart on Indonesia - Market size and forecast 2025-2030 ($ million)
Data Table on Indonesia - Market size and forecast 2025-2030 ($ million)
Chart on Indonesia - Year-over-year growth 2025-2030 (%)
Data Table on Indonesia - Year-over-year growth 2025-2030 (%)

12.6 South America - Market size and forecast 2025-2030

Chart on South America - Market size and forecast 2025-2030 ($ million)
Data Table on South America - Market size and forecast 2025-2030 ($ million)
Chart on South America - Year-over-year growth 2025-2030 (%)
Data Table on South America - Year-over-year growth 2025-2030 (%)
Chart on Regional Comparison - South America
Data Table on Regional Comparison - South America

12.6.1 Brazil - Market size and forecast 2025-2030

Chart on Brazil - Market size and forecast 2025-2030 ($ million)
Data Table on Brazil - Market size and forecast 2025-2030 ($ million)
Chart on Brazil - Year-over-year growth 2025-2030 (%)
Data Table on Brazil - Year-over-year growth 2025-2030 (%)

12.6.2 Argentina - Market size and forecast 2025-2030

Chart on Argentina - Market size and forecast 2025-2030 ($ million)
Data Table on Argentina - Market size and forecast 2025-2030 ($ million)
Chart on Argentina - Year-over-year growth 2025-2030 (%)
Data Table on Argentina - Year-over-year growth 2025-2030 (%)

12.6.3 Colombia - Market size and forecast 2025-2030

Chart on Colombia - Market size and forecast 2025-2030 ($ million)
Data Table on Colombia - Market size and forecast 2025-2030 ($ million)
Chart on Colombia - Year-over-year growth 2025-2030 (%)
Data Table on Colombia - Year-over-year growth 2025-2030 (%)

12.7 Middle East and Africa - Market size and forecast 2025-2030

Chart on Middle East and Africa - Market size and forecast 2025-2030 ($ million)
Data Table on Middle East and Africa - Market size and forecast 2025-2030 ($ million)
Chart on Middle East and Africa - Year-over-year growth 2025-2030 (%)
Data Table on Middle East and Africa - Year-over-year growth 2025-2030 (%)
Chart on Regional Comparison - Middle East and Africa
Data Table on Regional Comparison - Middle East and Africa

12.7.1 Saudi Arabia - Market size and forecast 2025-2030

Chart on Saudi Arabia - Market size and forecast 2025-2030 ($ million)
Data Table on Saudi Arabia - Market size and forecast 2025-2030 ($ million)
Chart on Saudi Arabia - Year-over-year growth 2025-2030 (%)
Data Table on Saudi Arabia - Year-over-year growth 2025-2030 (%)

12.7.2 UAE - Market size and forecast 2025-2030

Chart on UAE - Market size and forecast 2025-2030 ($ million)
Data Table on UAE - Market size and forecast 2025-2030 ($ million)
Chart on UAE - Year-over-year growth 2025-2030 (%)
Data Table on UAE - Year-over-year growth 2025-2030 (%)

12.7.3 South Africa - Market size and forecast 2025-2030

Chart on South Africa - Market size and forecast 2025-2030 ($ million)
Data Table on South Africa - Market size and forecast 2025-2030 ($ million)
Chart on South Africa - Year-over-year growth 2025-2030 (%)
Data Table on South Africa - Year-over-year growth 2025-2030 (%)

12.7.4 Israel - Market size and forecast 2025-2030

Chart on Israel - Market size and forecast 2025-2030 ($ million)
Data Table on Israel - Market size and forecast 2025-2030 ($ million)
Chart on Israel - Year-over-year growth 2025-2030 (%)
Data Table on Israel - Year-over-year growth 2025-2030 (%)

12.7.5 Turkey - Market size and forecast 2025-2030

Chart on Turkey - Market size and forecast 2025-2030 ($ million)
Data Table on Turkey - Market size and forecast 2025-2030 ($ million)
Chart on Turkey - Year-over-year growth 2025-2030 (%)
Data Table on Turkey - Year-over-year growth 2025-2030 (%)

12.8 Market opportunity by geography

Market opportunity by geography ($ million)
Data Tables on Market opportunity by geography ($ million)

13. Drivers, Challenges, and Opportunity

13.1 Market drivers

Proliferation of hybrid and remote work environments
Escalating focus on employee well-being and burnout prevention
Acceleration of complex mergers, acquisitions, and cultural integrations

13.2 Market challenges

Heightened data privacy regulations and ethical surveillance concerns
Technical integration complexity and fragmentation of communication data
Deficit in managerial interpretation and challenge of strategic execution

13.3 Impact of drivers and challenges

Impact of drivers and challenges in 2025 and 2030

13.4 Market opportunities

Integration of generative artificial intelligence for prescriptive network insights
Convergence of relational mapping and workforce sentiment analysis
Migration toward continuous passive data acquisition and real-time diagnostic monitoring

14. Competitive Landscape

14.1 Overview

14.2

Overview on criticality of inputs and factors of differentiation

14.3 Landscape disruption

Overview on factors of disruption

14.4 Industry risks

Impact of key risks on business

15. Competitive Analysis

15.1 Companies profiled

Companies covered

15.2 Company ranking index

15.3 Market positioning of companies

Matrix on companies position and classification

15.4 Culture Amp Pty Ltd.

Culture Amp Pty Ltd. - Overview
Culture Amp Pty Ltd. - Product / Service
Culture Amp Pty Ltd. - Key offerings
SWOT

15.5 Humanyze

Humanyze - Overview
Humanyze - Product / Service
Humanyze - Key offerings
SWOT

15.6 Innovisor

Innovisor - Overview
Innovisor - Product / Service
Innovisor - Key offerings
SWOT

15.7 Kumu Inc

Kumu Inc - Overview
Kumu Inc - Product / Service
Kumu Inc - Key offerings
SWOT

15.8 Maven Seven Solutions Plc.

Maven Seven Solutions Plc. - Overview
Maven Seven Solutions Plc. - Product / Service
Maven Seven Solutions Plc. - Key offerings
SWOT

15.9 Microsoft Corp.

Microsoft Corp. - Overview
Microsoft Corp. - Business segments
Microsoft Corp. - Key news
Microsoft Corp. - Key offerings
Microsoft Corp. - Segment focus
SWOT

15.10 Network Perspective

Network Perspective - Overview
Network Perspective - Product / Service
Network Perspective - Key offerings
SWOT

15.11 Panalyt Inc.

Panalyt Inc. - Overview
Panalyt Inc. - Product / Service
Panalyt Inc. - Key offerings
SWOT

15.12 Paycor HCM Inc.

Paycor HCM Inc. - Overview
Paycor HCM Inc. - Product / Service
Paycor HCM Inc. - Key news
Paycor HCM Inc. - Key offerings
SWOT

15.13 Perceptyx Inc.

Perceptyx Inc. - Overview
Perceptyx Inc. - Product / Service
Perceptyx Inc. - Key offerings
SWOT

15.14 Polinode Pty Ltd.

Polinode Pty Ltd. - Overview
Polinode Pty Ltd. - Product / Service
Polinode Pty Ltd. - Key offerings
SWOT

15.15 Qualtrics LLC

Qualtrics LLC - Overview
Qualtrics LLC - Product / Service
Qualtrics LLC - Key offerings
SWOT

15.16 Recognize Services Inc.

Recognize Services Inc. - Overview
Recognize Services Inc. - Product / Service
Recognize Services Inc. - Key offerings
SWOT

15.17 SAP SE

SAP SE - Overview
SAP SE - Business segments
SAP SE - Key news
SAP SE - Key offerings
SAP SE - Segment focus
SWOT

15.18 StarMeUp

StarMeUp - Overview
StarMeUp - Product / Service
StarMeUp - Key offerings
SWOT

16. Appendix

16.1 Scope of the report

Market definition
Objectives
Notes and caveats

16.2 Inclusions and exclusions checklist

Inclusions checklist
Exclusions checklist

16.3 Currency conversion rates for US$

16.4 Research methodology

16.5 Data procurement

Information sources

16.6 Data validation

16.7 Validation techniques employed for market sizing

16.8 Data synthesis

16.9 360 degree market analysis

16.10 List of abbreviations

Research Methodology

Technavio presents a detailed picture of the market by way of study, synthesis, and summation of data from multiple sources. The analysts have presented the various facets of the market with a particular focus on identifying the key industry influencers. The data thus presented is comprehensive, reliable, and the result of extensive research, both primary and secondary.

INFORMATION SOURCES

Primary sources

  • Manufacturers and suppliers
  • Channel partners
  • Industry experts
  • Strategic decision makers

Secondary sources

  • Industry journals and periodicals
  • Government data
  • Financial reports of key industry players
  • Historical data
  • Press releases

DATA ANALYSIS

Data Synthesis

  • Collation of data
  • Estimation of key figures
  • Analysis of derived insights

Data Validation

  • Triangulation with data models
  • Reference against proprietary databases
  • Corroboration with industry experts

REPORT WRITING

Qualitative

  • Market drivers
  • Market challenges
  • Market trends
  • Five forces analysis

Quantitative

  • Market size and forecast
  • Market segmentation
  • Geographical insights
  • Competitive landscape

Interested in this report?

Get your sample now to see our research methodology and insights!

Download Now

Frequently Asked Questions

Organizational Network Analysis Tools market growth will increase by USD 597.5 million during 2026-2030.

The Organizational Network Analysis Tools market is expected to grow at a CAGR of 16.9% during 2026-2030.

Organizational Network Analysis Tools market is segmented by Deployment (Cloud based, On premises) Application (OND and mapping, CC analysis, LI identification, TK Management, Others) Business segment (Large enterprises, Small and medium enterprises)

Culture Amp Pty Ltd., Humanyze, Innovisor, Kumu Inc, Maven Seven Solutions Plc., Microsoft Corp., Network Perspective, Panalyt Inc., Paycor HCM Inc., Perceptyx Inc., Polinode Pty Ltd., Qualtrics LLC, Recognize Services Inc., SAP SE, StarMeUp, SWOOP Analytics Pty Ltd., Time is Ltd., Visier Inc., Workday Inc., Worklytics Co are a few of the key vendors in the Organizational Network Analysis Tools market.

North America will register the highest growth rate of 40.3% among the other regions. Therefore, the Organizational Network Analysis Tools market in North America is expected to garner significant business opportunities for the vendors during the forecast period.

US, Canada, Mexico, Germany, UK, France, Italy, The Netherlands, Spain, China, Japan, India, South Korea, Australia, Indonesia, Brazil, Argentina, Colombia, Saudi Arabia, UAE, South Africa, Israel, Turkey

  • Proliferation of hybrid and remote work environments is the driving factor this market.

The Organizational Network Analysis Tools market vendors should focus on grabbing business opportunities from the Deployment segment as it accounted for the largest market share in the base year.
RIA - Research AI Assistant
Ask RIA