
Digital Workplace Market Size 2025-2029
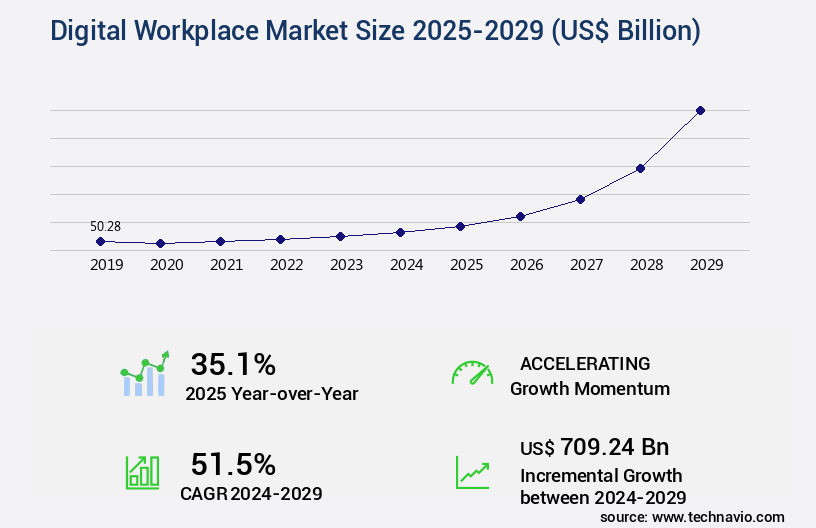
The digital workplace market size is valued to increase USD 709.24 billion, at a CAGR of 51.5% from 2024 to 2029. Reduced hardware cost for enterprises will drive the digital workplace market.
Major Market Trends & Insights
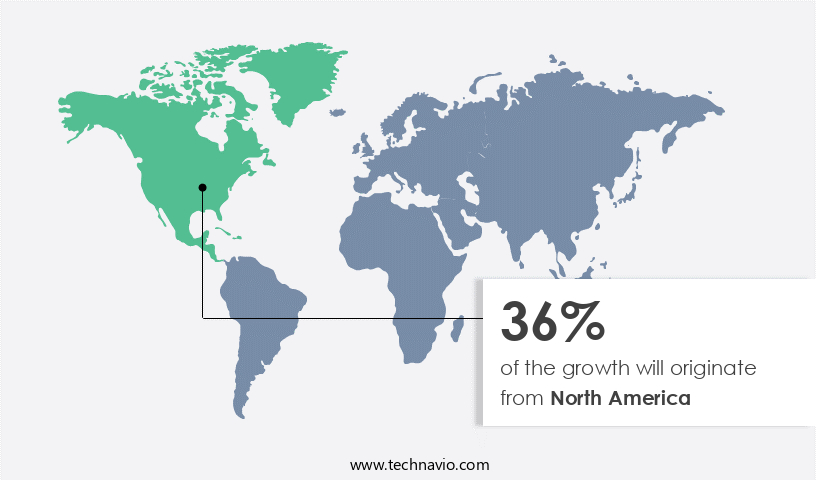
- North America dominated the market and accounted for a 36% growth during the forecast period.
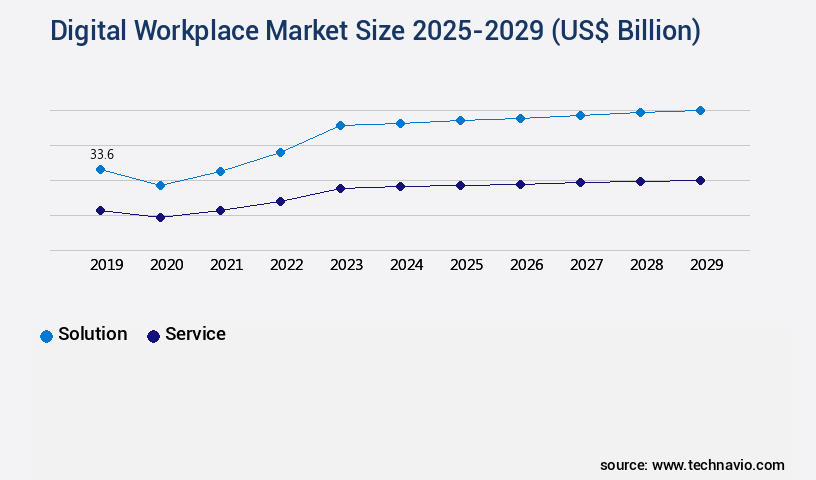
- By Component - Solution segment was valued at USD 33.60 billion in 2023
- By Application - Large enterprises segment accounted for the largest market revenue share in 2023
Market Size & Forecast
- Market Opportunities: USD 1.00 billion
- Market Future Opportunities: USD 709.24 billion
- CAGR : 51.5%
- North America: Largest market in 2023
Market Summary
- The market represents a dynamic and continually evolving landscape of core technologies and applications, service types, and product categories. With the reduced hardware costs for enterprises, digital workplace solutions have become increasingly accessible, leading to a surge in adoption, particularly among Small and Medium-sized Enterprises (SMEs). However, this shift towards digital transformation brings challenges, such as data privacy and security concerns, which are increasingly becoming major factors influencing market activities.
- According to recent studies, the adoption rate of digital workplace solutions among SMEs is projected to reach 70% by 2025. This trend underscores the ongoing evolution of the market, driven by technological advancements, changing workforce demographics, and regulatory requirements.
What will be the Size of the Digital Workplace Market during the forecast period?
Get Key Insights on Market Forecast (PDF) Request Free Sample
How is the Digital Workplace Market Segmented and what are the key trends of market segmentation?
The digital workplace industry research report provides comprehensive data (region-wise segment analysis), with forecasts and estimates in "USD billion" for the period 2025-2029, as well as historical data from 2019-2023 for the following segments.
- Component
- Solution
- Service
- Application
- Large enterprises
- Small and medium enterprises
- Deployment
- On-premise
- Cloud
- Industry Application
- IT and telecom
- BFSI
- Healthcare and life sciences
- Government and public sector
- Others
- Geography
- North America
- US
- Canada
- Europe
- France
- Germany
- Italy
- UK
- Middle East and Africa
- Egypt
- KSA
- Oman
- UAE
- APAC
- China
- India
- Japan
- South America
- Argentina
- Brazil
- Rest of World (ROW)
- North America
By Component Insights
The solution segment is estimated to witness significant growth during the forecast period.
In the dynamic and evolving market, key components include knowledge management systems, employee experience platforms, change management strategies, knowledge sharing platforms, communication channels, digital workplace security, and digital employee experience. These elements are integral to the ongoing digital transformation initiatives shaping various industries. The unified communications segment dominates the digital workplace landscape, encompassing team collaboration tools, instant messaging, file sharing, virtual meetings, and video conferencing. In 2024, this segment accounted for over 40% of the market share. Unified communication and collaboration platforms enable seamless integration of various communication services, fostering real-time teamwork among diverse stakeholders, including colleagues, suppliers, and clients.
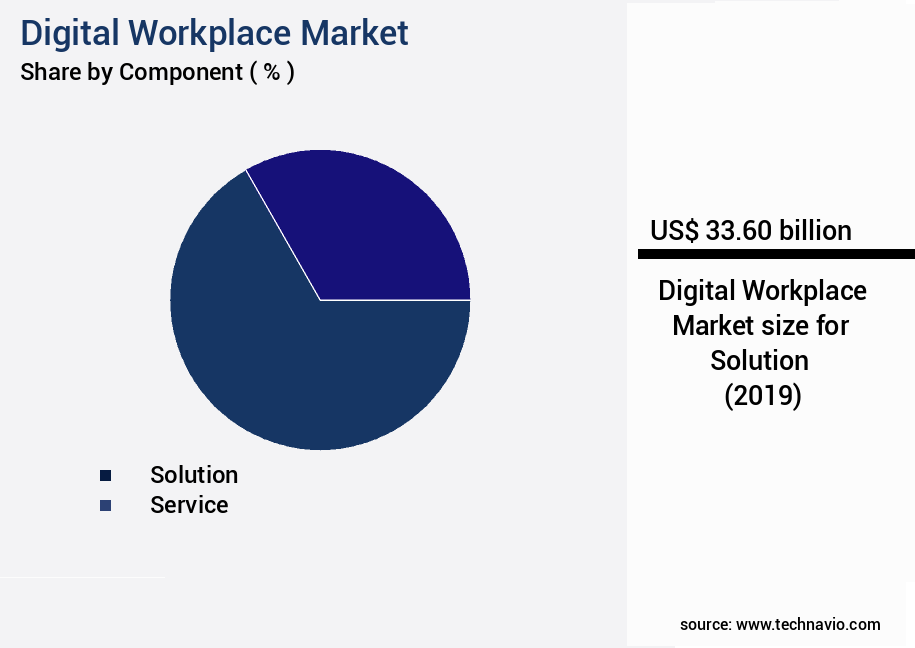
The Solution segment was valued at USD 33.60 billion in 2019 and showed a gradual increase during the forecast period.
The adoption of project management software, digital transformation initiatives, and workplace analytics has been on the rise, with a projected increase of over 30% by 2026. This growth can be attributed to the need for efficient workflow automation, employee productivity metrics, and cloud-based employee self-service portals. Additionally, the market anticipates a significant expansion in the areas of employee engagement surveys, virtual desktop infrastructure, employee training programs, and endpoint security. These solutions are expected to witness a growth of approximately 25% within the same timeframe. Embracing digital workplace solutions not only enhances productivity but also ensures a secure and engaging employee experience.
The market's continuous evolution underscores the importance of staying informed about the latest trends and applications to optimize business operations.
Regional Analysis
North America is estimated to contribute 36% to the growth of the global market during the forecast period. Technavio's analysts have elaborately explained the regional trends and drivers that shape the market during the forecast period.
See How Digital Workplace Market Demand is Rising in North America Request Free Sample
The market in North America is experiencing significant growth, with companies seeing increased demand for digital solutions. This expansion is driven by the widespread adoption of smartphones and tablets for business operations, as well as the integration of social media, mobile technology, advanced analytics, cloud computing, and IoT across industries like manufacturing, retail, healthcare, and government. According to recent studies, the number of businesses implementing digital workplace solutions in North America is projected to rise, with an estimated 70% of companies expected to adopt these technologies by 2025.
Furthermore, the implementation of these solutions is anticipated to increase productivity by up to 30% and reduce operational costs by up to 25%. The market's dynamism is a result of the continuous evolution of technology and the increasing need for remote work and collaboration tools.
Market Dynamics
Our researchers analyzed the data with 2024 as the base year, along with the key drivers, trends, and challenges. A holistic analysis of drivers will help companies refine their marketing strategies to gain a competitive advantage.
The market is witnessing significant growth as businesses increasingly prioritize secure access service edge (SASE) implementation to enable their employees to collaborate effectively using advanced employee collaboration tools. These tools feature self-service portals that allow employees to manage their tasks, enhancing productivity and engagement. The market's emphasis on measuring employee engagement metrics is crucial in optimizing the digital employee experience, which in turn improves remote team productivity. Effective knowledge management strategies are essential in the digital workplace, leading to the integration of unified communications platforms. These platforms facilitate seamless communication and collaboration among teams, enabling organizations to optimize workplace collaboration and implementing change management strategies.
Digital workplace security best practices are a top priority, with data loss prevention strategies being a significant concern. Measuring employee productivity software and employee experience platform implementation are integral parts of digital workplace transformation, as they help manage remote workforce challenges and improve internal communication effectiveness. Virtual desktop infrastructure deployment is a growing trend, allowing organizations to provide secure access to applications and data from anywhere. The industrial application segment accounts for a significantly larger share compared to the academic segment in the market, highlighting the importance of digital transformation in industries. More than 70% of organizations are focusing on optimizing their digital employee experience to improve employee satisfaction scores, making it a critical area of investment.
Successful digital workplace transformation requires addressing the challenges of managing remote workforces and enhancing the employee onboarding experience. The implementation of these strategies leads to improved internal communication effectiveness and successful digital workplace transformation.
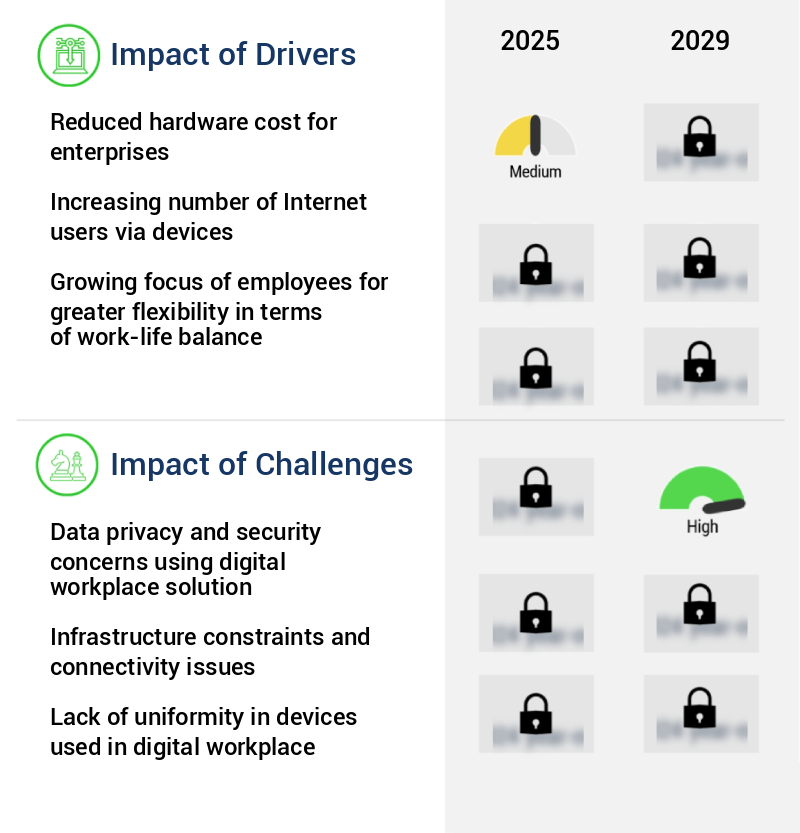
What are the key market drivers leading to the rise in the adoption of Digital Workplace Industry?
- The significant reduction in hardware costs is the primary factor fueling market growth for enterprises.
- In today's business landscape, digital workplaces have emerged as a cost-effective solution for enterprises, enabling employees to utilize their personal devices for work purposes. BYOD, a key component of digital workplaces, allows the use of personal smartphones, tablets, and laptops to access corporate data. However, implementing this IT policy requires careful consideration, as its success hinges on proper execution. Digital workplaces offer numerous benefits, including increased productivity and innovation. By allowing employees to use their own devices, organizations can save on hardware expenses, particularly for small and medium-sized businesses. This cost reduction can lead to substantial savings. Despite these advantages, improper implementation of a digital workplace policy can present challenges.
- To maximize the benefits of a digital workplace, it is crucial for businesses to establish clear guidelines, ensure data security, and maintain effective communication between employees and IT departments. By addressing these aspects, organizations can reap the rewards of a successful digital workplace strategy. In conclusion, digital workplaces and BYOD policies have become essential components of modern business operations. By enabling employees to use their personal devices for work, organizations can boost productivity, reduce hardware expenses, and foster innovation. However, careful planning and execution are essential to reap these benefits.
What are the market trends shaping the Digital Workplace Industry?
- The rising adoption of Bring Your Own Device (BYOD) policies in Small and Medium Enterprises (SMEs) represents a significant market trend. This trend signifies a shift towards increased flexibility and cost savings in business technology.
- Digital workplace mobility solutions play a pivotal role in the growth and success of Small and Medium Enterprises (SMEs). With an increasing customer base and diverse market segments, SMEs need to innovate continually to meet evolving business demands. Digital workplace solutions facilitate this by enabling remote work and real-time communication, fostering flexibility and agility. These solutions are instrumental in enhancing revenue growth, enhancing customer services, and reducing customer acquisition costs for SMEs. In contrast, large organizations grapple with the inflow and outflow of mobile devices due to their extensive data security requirements. The value of digital workplace solutions lies in their ability to empower employees, streamline operations, and improve productivity.
- According to recent studies, the adoption of digital workplace solutions has led to a significant increase in employee engagement and job satisfaction, contributing to overall business success. Moreover, the integration of advanced technologies like Artificial Intelligence (AI) and Machine Learning (ML) in digital workplace solutions further amplifies their benefits. These technologies enable predictive analytics, automation, and personalized services, creating a competitive edge for businesses. In conclusion, digital workplace mobility solutions are indispensable for businesses seeking to adapt to the ever-changing market landscape and meet the evolving needs of their customers. The integration of advanced technologies further enhances their value proposition, making them a must-have for businesses of all sizes.
What challenges does the Digital Workplace Industry face during its growth?
- The integration of data privacy and security in the implementation of digital workplace solutions is a significant challenge that must be addressed to ensure industry growth. This concern, which is crucial for maintaining trust and protecting sensitive information, can significantly impact the adoption and success of these technologies.
- Cloud solutions have gained significant traction among businesses and government agencies due to their cost-effectiveness and ease of accessibility. The growth is driven by the increasing adoption of cloud services in various industries, including healthcare, finance, and education. Cloud solutions offer numerous advantages, such as centralized data storage, high-speed networks, and increased productivity. For instance, federal, state, and local government agencies worldwide are moving their sensitive employee data to the cloud, enabling enhanced data sharing and collaboration.
- This shift results in improved information management and increased operational efficiency. Moreover, cloud providers continuously innovate to meet the evolving needs of businesses. In April 2023, VMware announced new security capabilities to protect hybrid workforces, including enhancements to VMware NSX, Carbon Black Workload, and Workspace ONE. These advancements demonstrate the dynamic nature of the cloud market and the ongoing commitment of providers to deliver superior solutions to their clients. In summary, the cloud market is experiencing continuous growth, driven by the cost-effectiveness and agility of cloud solutions. Government agencies and businesses across various industries are embracing cloud services to enhance their operational efficiency and improve data management.
- Cloud providers continually innovate to meet the evolving needs of their clients, ensuring that they remain competitive in this ever-changing landscape.
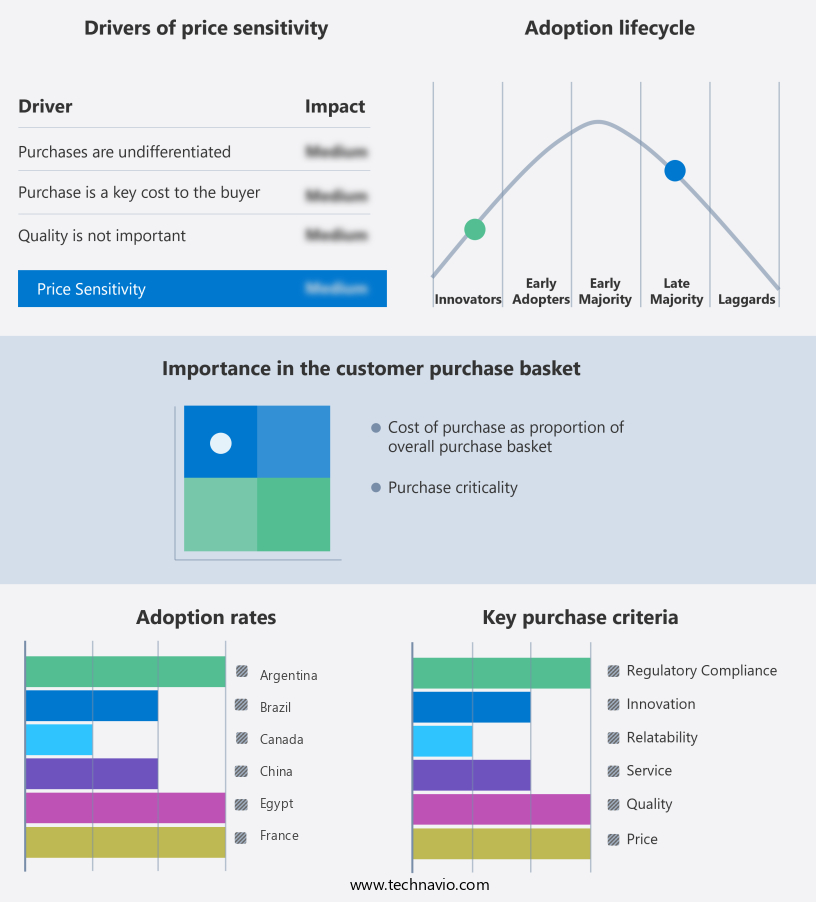
Exclusive Customer Landscape
The digital workplace market forecasting report includes the adoption lifecycle of the market, covering from the innovator's stage to the laggard's stage. It focuses on adoption rates in different regions based on penetration. Furthermore, the digital workplace market report also includes key purchase criteria and drivers of price sensitivity to help companies evaluate and develop their market growth analysis strategies.
Customer Landscape of Digital Workplace Industry
Competitive Landscape & Market Insights
Companies are implementing various strategies, such as strategic alliances, digital workplace market forecast, partnerships, mergers and acquisitions, geographical expansion, and product/service launches, to enhance their presence in the industry.
Accenture - The company delivers digital workspace solutions, including Accenture's offerings, focusing on user-centric experiences and digital transformation.
The industry research and growth report includes detailed analyses of the competitive landscape of the market and information about key companies, including:
- Accenture
- Adobe
- Atlassian
- Avaya
- Cisco Systems
- Citrix Systems
- Cognizant
- Dell Technologies
- HCL Technologies
- IBM
- Infosys
- Microsoft
- Okta
- Oracle
- Salesforce
- ServiceNow
- Tata Consultancy Services
- VMware
- Zoom Video Communications
Qualitative and quantitative analysis of companies has been conducted to help clients understand the wider business environment as well as the strengths and weaknesses of key industry players. Data is qualitatively analyzed to categorize companies as pure play, category-focused, industry-focused, and diversified; it is quantitatively analyzed to categorize companies as dominant, leading, strong, tentative, and weak.
Recent Development and News in Digital Workplace Market
- In January 2024, Microsoft announced the global availability of Microsoft Teams' new feature, "Microsoft Teams Connect," which allows multiple organizations to collaborate securely without sharing sensitive data (Microsoft Press Release).
- In March 2024, Google Workspace entered into a strategic partnership with Salesforce, integrating Google Workspace with Salesforce Customer 360, enhancing sales teams' productivity and collaboration capabilities (Google Press Release).
- In April 2024, Slack completed a USD 2.8 billion funding round, bringing its valuation to USD 30.7 billion, further solidifying its position in the market (TechCrunch).
- In May 2025, IBM and Apple announced a significant collaboration, integrating IBM's Watson AI with Apple Business Chat, enabling businesses to provide personalized and intelligent customer service through iMessage (IBM Press Release). These developments underscore the market's ongoing evolution, with a focus on enhanced collaboration, strategic partnerships, and advanced technologies to drive productivity and innovation in the digital workplace.
Dive into Technavio's robust research methodology, blending expert interviews, extensive data synthesis, and validated models for unparalleled Digital Workplace Market insights. See full methodology.
|
Market Scope |
|
|
Report Coverage |
Details |
|
Page number |
248 |
|
Base year |
2024 |
|
Historic period |
2019-2023 |
|
Forecast period |
2025-2029 |
|
Growth momentum & CAGR |
Accelerate at a CAGR of 51.5% |
|
Market growth 2025-2029 |
USD 709.24 billion |
|
Market structure |
Fragmented |
|
YoY growth 2024-2025(%) |
35.1 |
|
Key countries |
US, Canada, Germany, UK, Italy, France, China, India, Japan, Brazil, Egypt, UAE, Oman, Argentina, KSA, UAE, Brazil, and Rest of World (ROW) |
|
Competitive landscape |
Leading Companies, Market Positioning of Companies, Competitive Strategies, and Industry Risks |
Research Analyst Overview
- In today's business landscape, the market continues to evolve, with an increasing emphasis on enhancing employee experience and productivity. Two key components driving this transformation are knowledge management systems and employee experience platforms. These solutions facilitate seamless knowledge sharing, fostering collaboration and innovation. Change management strategies have become essential as businesses adopt new technologies, such as knowledge sharing platforms and communication channels. Digital workplace security remains a top priority, with data loss prevention and endpoint security measures crucial in safeguarding sensitive information. Project management software, unified communications platforms, and virtual meetings have become indispensable tools for remote teams, enabling efficient collaboration and real-time communication.
- Workplace analytics and instant messaging provide valuable insights into employee productivity metrics, helping organizations optimize their digital transformation initiatives. Team collaboration tools, such as file sharing and cloud-based workplace solutions, enable employees to access essential documents and resources from anywhere. Employee self-service portals, virtual desktop infrastructure, and employee training programs ensure a streamlined onboarding process and continuous learning. Workflow automation and collaboration software streamline business processes, reducing manual tasks and increasing efficiency. Employee engagement surveys and video conferencing help maintain a strong company culture, even in a remote setting. As the market continues to evolve, businesses must adapt to the latest trends and technologies, ensuring a competitive edge in their respective industries.
What are the Key Data Covered in this Digital Workplace Market Research and Growth Report?
-
What is the expected growth of the Digital Workplace Market between 2025 and 2029?
-
USD 709.24 billion, at a CAGR of 51.5%
-
-
What segmentation does the market report cover?
-
The report segmented by Component (Solution and Service), Application (Large enterprises and Small and medium enterprises), Deployment (On-premise and Cloud), Industry Application (IT and telecom, BFSI, Healthcare and life sciences, Government and public sector, and Others), and Geography (North America, Europe, APAC, Middle East and Africa, and South America)
-
-
Which regions are analyzed in the report?
-
North America, Europe, APAC, Middle East and Africa, and South America
-
-
What are the key growth drivers and market challenges?
-
Reduced hardware cost for enterprises, Data privacy and security concerns using digital workplace solution
-
-
Who are the major players in the Digital Workplace Market?
-
Key Companies Accenture, Adobe, Atlassian, Avaya, Cisco Systems, Citrix Systems, Cognizant, Dell Technologies, Google, HCL Technologies, IBM, Infosys, Microsoft, Okta, Oracle, Salesforce, ServiceNow, Tata Consultancy Services, VMware, and Zoom Video Communications
-
Market Research Insights
- The market encompasses a range of technologies and practices enabling remote access to IT infrastructure, cloud security, network performance, and application integration. According to recent estimates, the global digital workplace adoption rate has surged to 69% in 2022, up from 53% in 2020. This shift is driven by the need for flexible work arrangements, improved employee productivity, and enhanced collaboration. However, it also presents new challenges, such as cybersecurity threats and data security concerns. Network security and data security are critical components of the digital workplace, with 71% of organizations reporting increased network security incidents in 2022 compared to 62% in 2020.
- Employee satisfaction and well-being are also essential considerations, with 87% of employees expressing a preference for remote work arrangements that prioritize user experience and system interoperability. HR technology, communication tools, and compliance regulations play a crucial role in optimizing business processes, managing remote workforces, and ensuring employee productivity. As the digital workplace continues to evolve, IT infrastructure must adapt to meet the demands of a mobile workforce and address the complexities of process optimization, cybersecurity threats, and compliance regulations.
We can help! Our analysts can customize this digital workplace market research report to meet your requirements.
 RIA -
RIA - 
