Palletizer Market Size 2025-2029
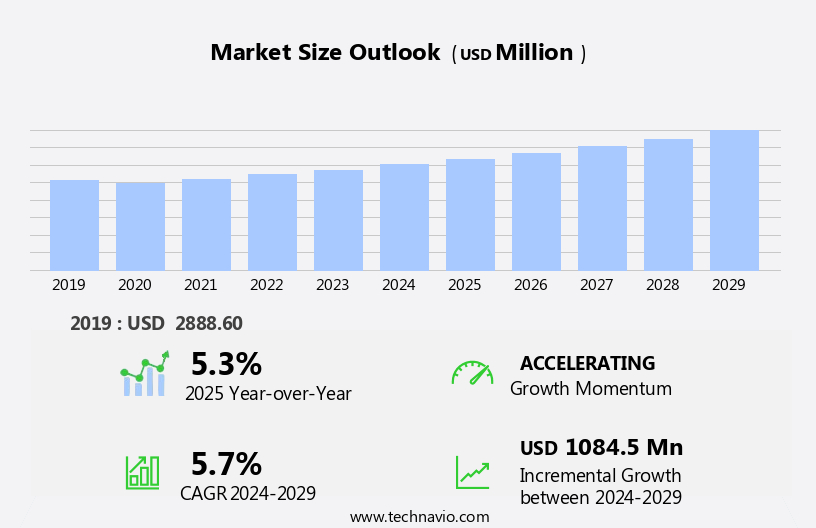
The palletizer market size is forecast to increase by USD 1.08 billion at a CAGR of 5.7% between 2024 and 2029.
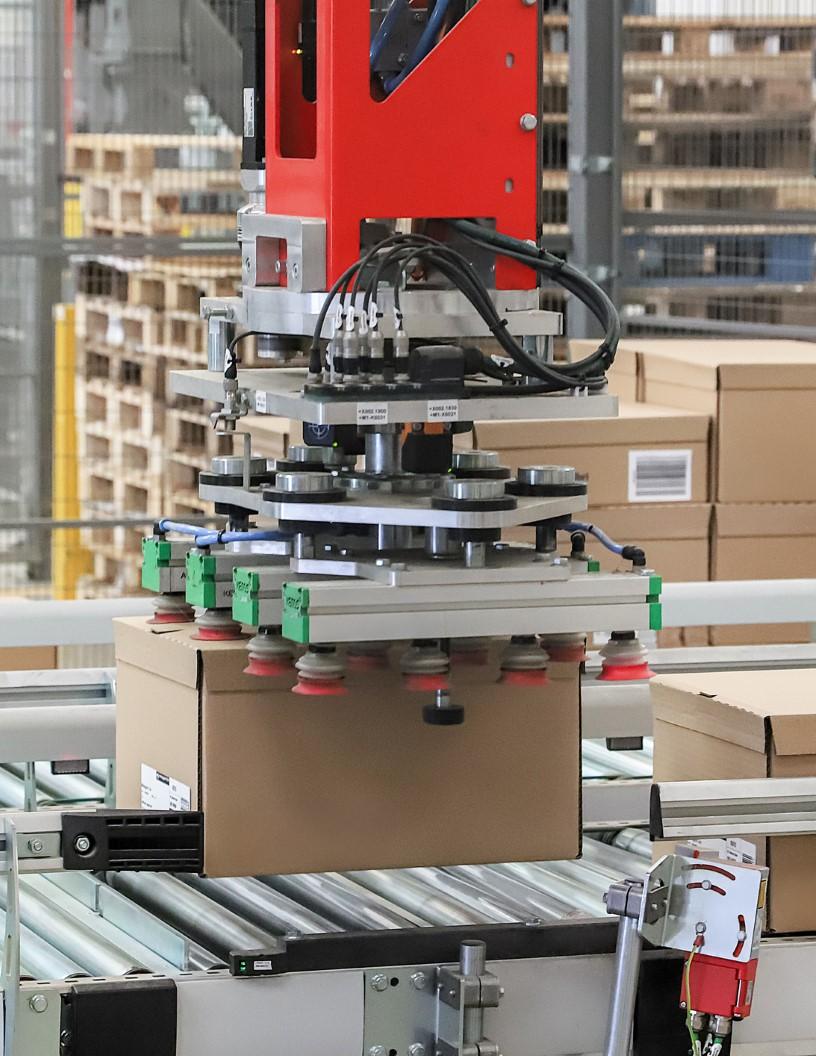
- The market is experiencing significant growth, driven by the increasing adoption of automation and artificial intelligence (AI) in various industries. The automation of palletizing processes offers numerous benefits, including improved productivity, reduced labor costs, and enhanced product quality. However, the high initial investment costs associated with palletizing systems remain a challenge for many companies, particularly small and medium-sized enterprises. Key trends in the market include the introduction of new palletizing technologies, such as robotic palletizers and modular palletizers, which offer greater flexibility and efficiency. These innovations are enabling businesses to streamline their operations and meet the growing demand for faster and more efficient production processes.
- Despite these opportunities, companies must carefully consider the initial investment costs and the long-term benefits of implementing palletizing systems to ensure a strong return on investment. Overall, the market presents significant growth opportunities for businesses seeking to improve their operational efficiency and remain competitive in their respective industries.
What will be the Size of the Palletizer Market during the forecast period?
- The pallet market encompasses a diverse range of products and services, with a focus on the design, production, and implementation of pallets for various industries. This market exhibits growth, driven by the increasing demand for efficient and cost-effective logistics solutions. Key trends include the integration of technology, such as pallet optimization software and data analytics, to enhance productivity and reduce waste. Pallet configuration, certification, and training are also crucial aspects of the market, ensuring compliance with industry standards and safe handling practices.
- Sustainability programs and re-use initiatives are gaining traction, as businesses seek to minimize their environmental footprint and reduce costs. The market further includes rental, leasing, and control systems, as well as consulting and interfacing services, to cater to the unique needs of various industries. Overall, the pallet market is a dynamic and evolving landscape, characterized by continuous innovation and a focus on improving supply chain efficiency.
How is this Palletizer Industry segmented?
The palletizer industry research report provides comprehensive data (region-wise segment analysis), with forecasts and estimates in "USD million" for the period 2025-2029, as well as historical data from 2019-2023 for the following segments.
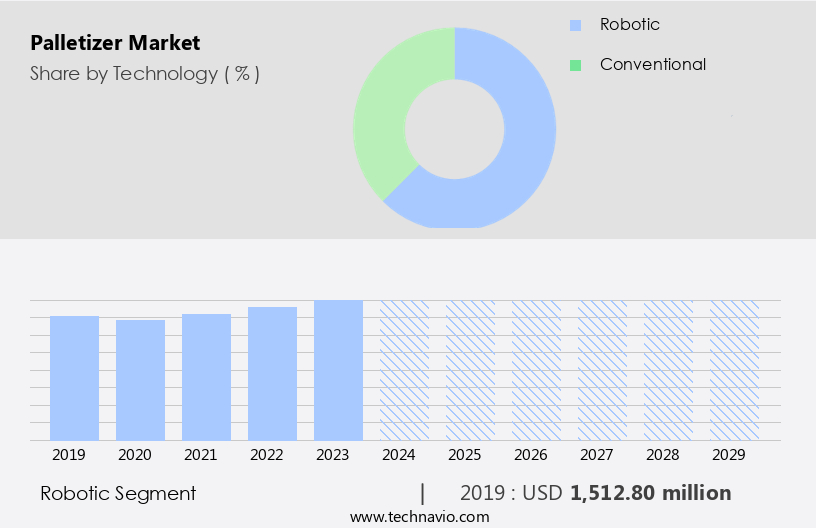
- Technology
- Robotic
- Conventional
- Application
- Food and beverage
- E-commerce and logistics
- Healthcare industry
- Retail industry
- Others
- Geography
- North America
- US
- Canada
- APAC
- China
- India
- Japan
- South Korea
- Europe
- France
- Germany
- UK
- South America
- Brazil
- Middle East and Africa
- North America
By Technology Insights
The robotic segment is estimated to witness significant growth during the forecast period. Robotic palletizers are experiencing significant growth in the global market, fueled by technological advancements in robotics, artificial intelligence (AI), and machine vision. These systems employ robots, often articulated arms, to automate the process of handling and arranging products onto pallets. Key benefits of robotic palletizers include flexibility, high speed and precision, adaptability, and seamless integration. With their ability to handle a wide array of products, regardless of shape, size, or weight, they are particularly valuable in industries with diverse product lines. Robotic palletizers operate at impressive speeds while maintaining accuracy, minimizing product damage, and enhancing throughput. Furthermore, they can be reprogrammed to accommodate new products or production lines, ensuring scalability and adaptability.
Advanced features such as pallet stacking, layer palletizing, pallet size compatibility, and pallet weight capacity further enhance their utility. Additionally, robotic palletizers contribute to cost reduction, safety compliance, and energy efficiency through pallet inventory management, pallet recycling, and pallet transport automation. Machine learning (ML) and vision systems enable real-time data analytics, optimizing pallet load and stability. Human-robot collaboration, through collaborative robots (cobots) and pallet dispensers, streamlines pallet handling processes. Overall, robotic palletizers play a pivotal role in optimizing pallet management, enhancing labor productivity, and improving supply chain efficiency.
Get a glance at the market report of share of various segments Request Free Sample
The Robotic segment was valued at USD 1.51 billion in 2019 and showed a gradual increase during the forecast period.
Regional Analysis
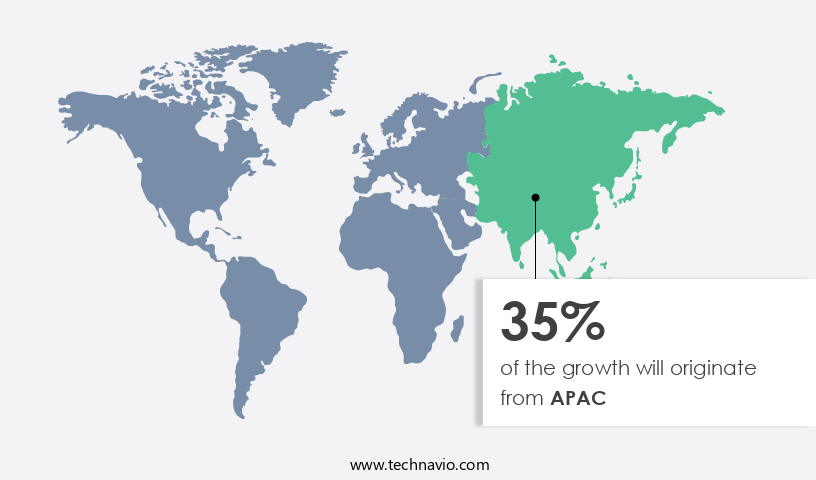
APAC is estimated to contribute 35% to the growth of the global market during the forecast period.Technavio's analysts have elaborately explained the regional trends and drivers that shape the market during the forecast period.
For more insights on the market size of various regions, Request Free Sample
The North American market is shaped by various significant factors. The region's industrial sector's sizeable investments in automation and the expanding e-commerce industry are primary growth drivers. Furthermore, the food and beverage sector, with over 42,700 processing establishments in the United States alone, significantly contributes to the market's importance. Automated palletizers are indispensable in this sector due to their ability to ensure speed, hygiene, and accuracy in handling diverse products. Automation software, pallet stackers, and layer palletizers are popular solutions that enhance labor productivity and throughput optimization. Robotic palletizers, pallet shuttles, and pallet conveyor systems facilitate pallet material flow and pallet inventory management.
Pallet RFID, barcode, and tracking systems enable real-time pallet location and inspection. Artificial intelligence (AI) and machine learning (ML) technologies are increasingly adopted for pallet pooling, pallet design, and pallet size compatibility, contributing to cost reduction and energy efficiency. Collaborative robots (cobots) and human-robot collaboration enable safe and efficient pallet handling. Pallet wrapping, repair, storage, and transport are also essential aspects of pallet management. Palletizing solutions are crucial for distribution centers, enhancing safety compliance, pallet stability, and pallet weight capacity. Vision systems and pallet simulation tools further optimize pallet loading and improve overall supply chain performance. Data analytics and pallet dispensers streamline pallet handling and ensure pallet standardization.
Market Dynamics
Our researchers analyzed the data with 2024 as the base year, along with the key drivers, trends, and challenges. A holistic analysis of drivers will help companies refine their marketing strategies to gain a competitive advantage.
What are the key market drivers leading to the rise in the adoption of Palletizer Industry?
- Rising adoption of automation is the key driver of the market. The market is witnessing increased adoption of automation as industries strive for enhanced efficiency, productivity, and safety. Manual palletizing processes, which historically relied on extensive labor and time, have resulted in higher costs, inconsistencies, and workplace injuries due to repetitive lifting. However, the emergence of robotic and automated palletizing systems is revolutionizing material handling by minimizing human intervention and optimizing operations. These systems offer benefits such as high-speed stacking, precise placement, and multi-product configurations, significantly improving throughput and accuracy.
- A key factor fueling this trend is the demand for operational efficiency in sectors like food and beverage, pharmaceuticals, consumer goods, and logistics. Automated palletizers contribute to reducing labor costs, minimizing errors, and ensuring consistent product quality. This technological evolution is poised to reshape the material handling landscape.
What are the market trends shaping the Palletizer Industry?
- Introduction of new products is the upcoming market trend. The market continues to evolve, driven by technological innovations that improve efficiency, safety, and adaptability in various industries. One recent development comes from FlexLink, a Coesia company, which introduced its third-generation collaborative palletizer, the RC12, on December 4, 2024. This new product showcases advanced robotics and user-friendly features, including a flexible, space-saving design that reduces floor space requirements by over 50 percent compared to traditional robots.
- The RC12 integrates an intuitive Human-Machine Interface (HMI) and Robot Config palletizing software, allowing operators to create custom pallet patterns easily without programming skills. This innovation underscores the ongoing commitment to enhancing end-of-line processes in the market.
What challenges does the Palletizer Industry face during its growth?
- High initial investment costs is a key challenge affecting the industry growth. The market presents significant opportunities for businesses seeking to enhance their production efficiency and reduce labor costs. Automated and robotic palletizing systems are at the forefront of this trend, offering benefits such as improved productivity and enhanced flexibility. However, the high initial investment costs remain a significant challenge, particularly for small and medium-sized enterprises (SMEs). The price of palletizing systems can vary widely based on factors such as system type, complexity, and features. Conventional palletizers, which range from USD50,000 to USD200,000, are a viable option for businesses with simpler palletizing requirements.
- For more complex operations, companies may need to invest in robotic palletizers or hybrid solutions, which come with higher price tags. Despite the upfront costs, the long-term benefits of these advanced systems can outweigh the investment, making them a worthwhile consideration for businesses aiming to stay competitive in their industries.
Exclusive Customer Landscape
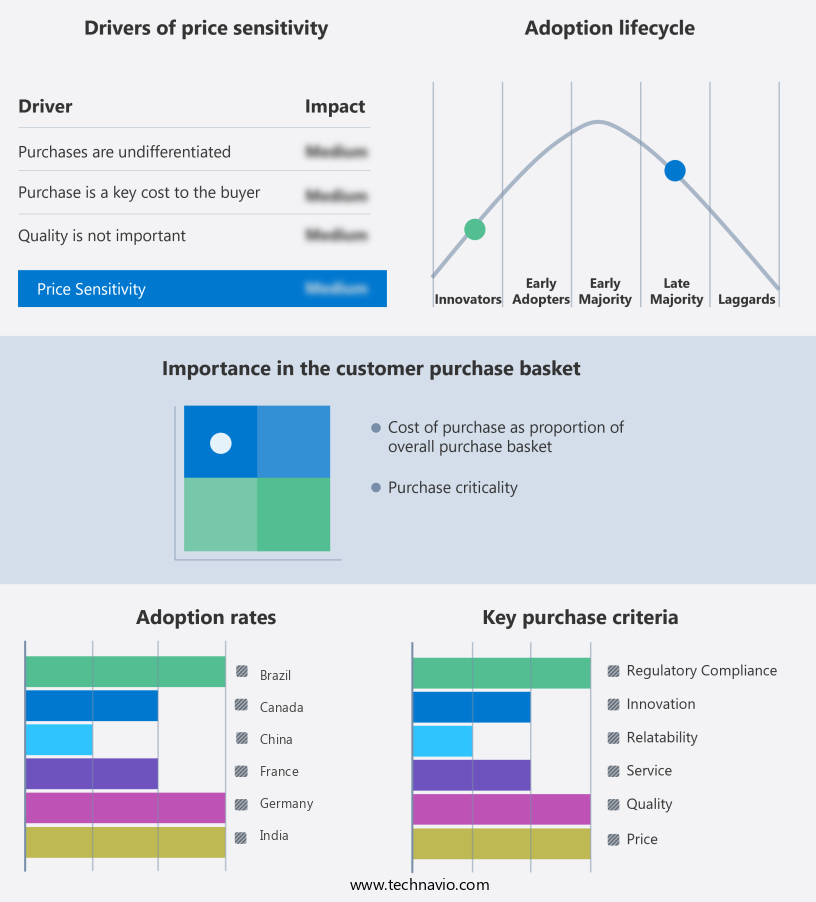
The palletizer market forecasting report includes the adoption lifecycle of the market, covering from the innovator's stage to the laggard's stage. It focuses on adoption rates in different regions based on penetration. Furthermore, the palletizer market report also includes key purchase criteria and drivers of price sensitivity to help companies evaluate and develop their market growth analysis strategies.
Customer Landscape
Key Companies & Market Insights
Companies are implementing various strategies, such as strategic alliances, palletizer market forecast, partnerships, mergers and acquisitions, geographical expansion, and product/service launches, to enhance their presence in the industry.
ABB Ltd. - The company offers palletizer such as IRB 460 which is ideal for end-of-line and bag palletizing. This compact 4-axis robot has a 2.4 m reach, a 110 kg payload, and achieves up to 2,190 cycles/hour with a 60 kg load.
The industry research and growth report includes detailed analyses of the competitive landscape of the market and information about key companies, including:
- ABB Ltd.
- Bastian Solutions LLC
- Beumer Group GmbH and Co. KG
- Brenton LLC
- Ehcolo AS
- FANUC Corp.
- FUJI MACHINERY Co. Ltd.
- Honeywell International Inc.
- Kawasaki Heavy Industries Ltd.
- KION GROUP AG
- Krones AG
- KUKA AG
- Mitsubishi Electric Corp.
- pester pac automation GmbH
- Premier Tech Digital Ltd.
- Yaskawa Electric Corp.
Qualitative and quantitative analysis of companies has been conducted to help clients understand the wider business environment as well as the strengths and weaknesses of key industry players. Data is qualitatively analyzed to categorize companies as pure play, category-focused, industry-focused, and diversified; it is quantitatively analyzed to categorize companies as dominant, leading, strong, tentative, and weak.
Research Analyst Overview
The pallet market encompasses a broad range of solutions and technologies designed to optimize the lifecycle management of pallets in various industries. These offerings include, but are not limited to, pallet jack trucks, pallet lifter machines, and palletizing systems. Pallet lifecycle management refers to the process of maximizing the utilization and minimizing the waste of pallets throughout their entire life cycle. This can be achieved through various means, such as pallet RFID tracking systems, pallet barcode labeling, and pallet inventory management software. Robotic palletizers and pallet shuttle systems are increasingly being adopted to enhance automation and improve labor productivity in distribution centers.
These systems utilize artificial intelligence (AI) and machine learning (ML) algorithms to optimize pallet loading and throughput. Automation software and pallet automation systems play a crucial role in streamlining pallet handling processes, ensuring safety compliance, and reducing costs. These solutions enable real-time data analytics and pallet simulation, allowing for better pallet load optimization and energy efficiency. Pallet design and standardization are essential factors in ensuring pallet compatibility and stability during transportation and storage. Advanced pallet design features, such as pallet recycling and pallet material selection, contribute to reducing waste and improving overall supply chain efficiency. Collaborative robots (cobots) and human-robot collaboration in pallet handling applications have gained popularity due to their ability to increase productivity while maintaining a safe working environment.
Modern supply chains are increasingly focusing on advanced pallet solutions to enhance efficiency and sustainability. Key innovations include optimized pallet layering and customized pallet patterns, managed through intelligent pallet control systems and seamless pallet interfacing. With growing emphasis on digital transformation, companies are investing in pallet integration, pallet data capture, and pallet data analytics to enable real-time pallet performance monitoring and pallet lifecycle tracking. Effective pallet asset management supports models like pallet sharing, pallet rental, and pallet leasing, while also promoting pallet re-use and pallet sustainability programs. To support these initiatives, organizations offer pallet training, pallet certification, and pallet consulting. Industry professionals stay informed through pallet services, pallet innovation, and participation in pallet trade shows and pallet associations, ensuring they remain competitive and aligned with best practices.
|
Market Scope |
|
|
Report Coverage |
Details |
|
Page number |
214 |
|
Base year |
2024 |
|
Historic period |
2019-2023 |
|
Forecast period |
2025-2029 |
|
Growth momentum & CAGR |
Accelerate at a CAGR of 5.7% |
|
Market growth 2025-2029 |
USD 1084.5 million |
|
Market structure |
Fragmented |
|
YoY growth 2024-2025(%) |
5.3 |
|
Key countries |
US, China, Japan, Germany, UK, Canada, India, France, Brazil, and South Korea |
|
Competitive landscape |
Leading Companies, Market Positioning of Companies, Competitive Strategies, and Industry Risks |
What are the Key Data Covered in this Palletizer Market Research and Growth Report?
- CAGR of the Palletizer industry during the forecast period
- Detailed information on factors that will drive the growth and forecasting between 2025 and 2029
- Precise estimation of the size of the market and its contribution of the industry in focus to the parent market
- Accurate predictions about upcoming growth and trends and changes in consumer behaviour
- Growth of the market across North America, APAC, Europe, South America, and Middle East and Africa
- Thorough analysis of the market's competitive landscape and detailed information about companies
- Comprehensive analysis of factors that will challenge the palletizer market growth and forecasting
We can help! Our analysts can customize this palletizer market research report to meet your requirements.
 RIA -
RIA - 
