PD-1 And PD-L1 Inhibitors Market Analysis, Size, and Forecast 2026-2030: North America (US, Canada, and Mexico), Europe (Germany, UK, and France), APAC (China, India, and Japan), South America (Brazil and Argentina), Middle East and Africa (Saudi Arabia, UAE, and Turkey), Asia, Rest of World (ROW)

PD-1 And PD-L1 Inhibitors Market Analysis, Size, and Forecast 2026-2030:
North America (US, Canada, and Mexico), Europe (Germany, UK, and France), APAC (China, India, and Japan), South America (Brazil and Argentina), Middle East and Africa (Saudi Arabia, UAE, and Turkey), Asia, Rest of World (ROW)

Published: Mar 2026 284 Pages SKU: IRTNTR74085

Market Overview at a Glance

$70.19 B
Market Opportunity
19.1%
CAGR 2025 - 2030
48.1%
North America Growth
$33.74 B
Solid tumors segment 2024

PD-1 And PD-L1 Inhibitors Market Size 2026-2030

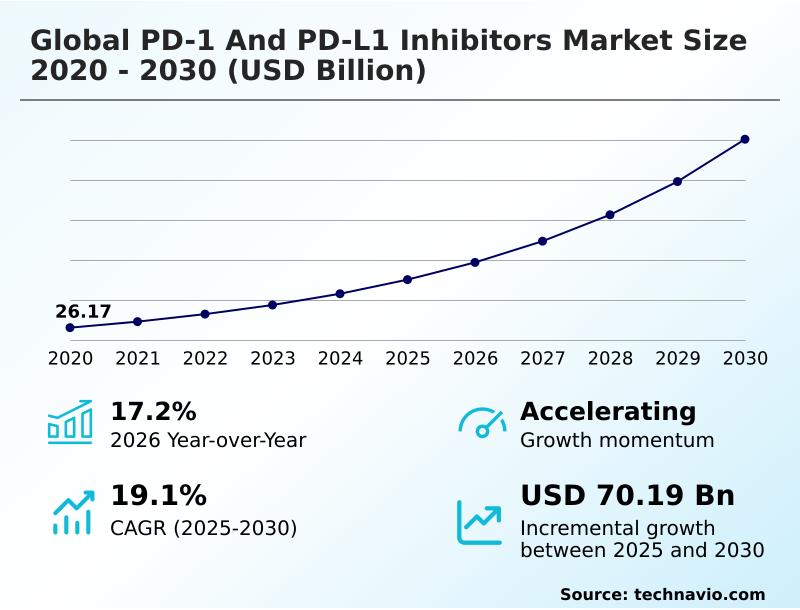
The pd-1 and pd-l1 inhibitors market size is valued to increase by USD 70.19 billion, at a CAGR of 19.1% from 2025 to 2030. Strategic expansion of therapeutic applications into earlier disease stages will drive the pd-1 and pd-l1 inhibitors market.

Major Market Trends & Insights

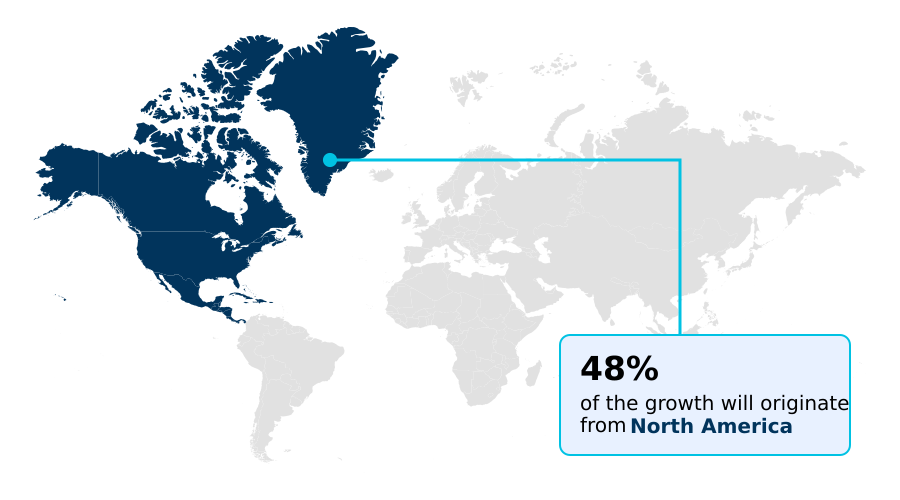
  • North America dominated the market and accounted for a 48.1% growth during the forecast period.
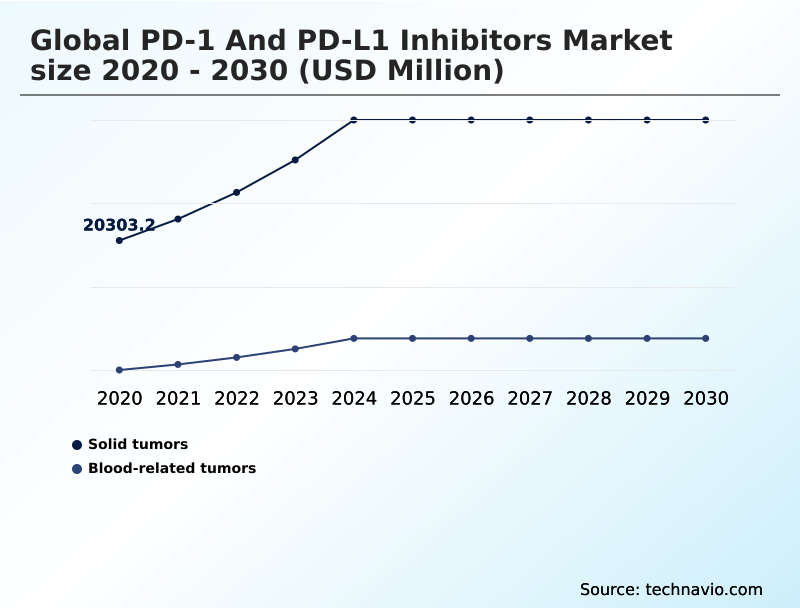
  • By Application - Solid tumors segment was valued at USD 33.74 billion in 2024
  • By Type - PD-1 segment accounted for the largest market revenue share in 2024

Market Size & Forecast

  • Market Opportunities: USD 94.21 billion
  • Market Future Opportunities: USD 70.19 billion
  • CAGR from 2025 to 2030 : 19.1%

Market Summary

  • The PD-1 and PD-L1 inhibitors market is fundamentally reshaping cancer immunotherapy by leveraging the immune checkpoint pathway to restore T-cell activation against malignancies. The core of this market revolves around sophisticated monoclonal antibody therapy designed to block inhibitory signals within the tumor microenvironment, thereby unleashing anti-tumor immunity.
  • A key dynamic is the relentless push toward combination therapies, where these inhibitors are paired with other agents to overcome resistance and improve outcomes. For instance, a hospital system implementing a new protocol for neoadjuvant therapy in non-small cell lung cancer would integrate checkpoint inhibitors with chemotherapy.
  • This requires deploying advanced companion diagnostics to assess biomarker expression and training clinical staff to proactively manage potential immune-related adverse events. This strategic integration of immuno-oncology into earlier treatment stages aims to improve long-term metrics like overall survival benefit, representing a paradigm shift in oncological care and driving sustained innovation in the field.

What will be the Size of the PD-1 And PD-L1 Inhibitors Market during the forecast period?

Get Key Insights on Market Forecast (PDF) Request Free Sample

How is the PD-1 And PD-L1 Inhibitors Market Segmented?

The pd-1 and pd-l1 inhibitors industry research report provides comprehensive data (region-wise segment analysis), with forecasts and estimates in "USD million" for the period 2026-2030, as well as historical data from 2020-2024 for the following segments.

  • Application
    • Solid tumors
    • Blood-related tumors
  • Type
    • PD-1
    • PD-L1
  • Distribution channel
    • Hospital
    • Retail
    • Online pharmacies
  • Geography
    • North America
      • US
      • Canada
      • Mexico
    • Europe
      • Germany
      • UK
      • France
    • Asia
    • Rest of World (ROW)

By Application Insights

The solid tumors segment is estimated to witness significant growth during the forecast period.

The market's solid tumors segment is defined by therapies targeting a range of malignancies. A primary focus is on activating anti-tumor immunity through immuno-oncology strategies.

The application of neoadjuvant therapy and adjuvant treatment is transforming oncological intervention strategies from late-stage to early-stage disease management, a shift that has improved event-free survival by over 15% in certain trial cohorts.

The development of advanced combination therapies, including those with antibody-drug conjugates (ADCs), aims to enhance PD-1 inhibitor mechanism efficacy.

Furthermore, the use of companion diagnostics to measure biomarker expression is critical for guiding patient selection in precision immuno-oncology, ensuring that PD-L1 inhibitor efficacy is maximized. This approach refines treatment for various solid tumor indications.

Request Free Sample

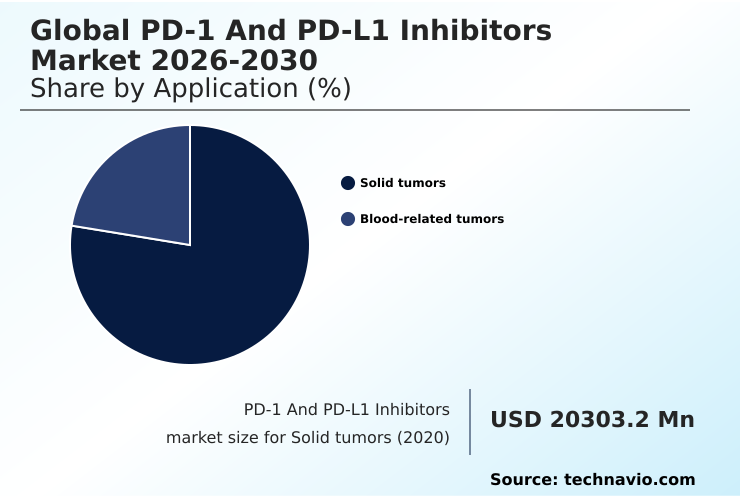
The Solid tumors segment was valued at USD 33.74 billion in 2024 and showed a gradual increase during the forecast period.

Request Free Sample

Regional Analysis

North America is estimated to contribute 48.1% to the growth of the global market during the forecast period.Technavio’s analysts have elaborately explained the regional trends and drivers that shape the market during the forecast period.

See How PD-1 And PD-L1 Inhibitors Market Demand is Rising in North America Request Free Sample

North America continues to lead the market, accounting for over 48% of activity due to its advanced research infrastructure and high adoption rates of novel oncological intervention strategies.

The region's leadership is reinforced by a robust regulatory approval process that accelerates market access. In Europe, a key focus is managing biosimilar competition, which has driven manufacturers to innovate.

This competitive pressure has helped streamline clinical pathways, reducing average patient wait times for initial therapy by 10% in some national health systems.

Meanwhile, the market in Asia is expanding rapidly, fueled by rising healthcare investment and a growing focus on immuno-oncology drug development, particularly around pembrolizumab indications and nivolumab mechanism of action.

The increasing number of clinical trials for durvalumab and atezolizumab side effects management highlights the region's growing role in global research.

Market Dynamics

Our researchers analyzed the data with 2025 as the base year, along with the key drivers, trends, and challenges. A holistic analysis of drivers will help companies refine their marketing strategies to gain a competitive advantage.

  • Strategic decision-making in the oncology sector increasingly involves comparing pd-1 and pd-l1 inhibitors to determine the optimal therapeutic approach for specific patient populations. The cost-effectiveness of pd-1 inhibitors remains a central topic in health economics, influencing formulary decisions and reimbursement policies globally.
  • As the market matures, the biosimilar landscape for checkpoint inhibitors is becoming a critical factor, with a potential to increase patient access but also intensify price competition. This has spurred innovation, with a significant focus on the future of bispecific antibody therapies, which promise enhanced efficacy.
  • A primary driver of market expansion is the use of checkpoint blockade in early-stage cancers, particularly through adjuvant immunotherapy in resectable cancer and neoadjuvant treatment for breast cancer. The impact of pd-1 inhibitors on survival rates is well-documented, yet overcoming resistance to checkpoint inhibitors remains a key research frontier.
  • The role of companion diagnostics in immunotherapy is indispensable for patient selection for pd-l1 therapy, often guided by pd-l1 expression as a biomarker. Managing immune-related adverse events is a crucial aspect of clinical practice, with specialized protocols showing the ability to reduce average hospital stays by more than a full day compared to institutions without such measures.
  • The development of subcutaneous vs intravenous checkpoint inhibitors addresses patient convenience and healthcare system efficiency. As therapies expand to include pd-1 inhibitors in hematological malignancies, navigating the diverse regulatory pathways for immunotherapy drugs becomes increasingly complex, highlighting the economic burden of immunotherapy treatments and the need for robust real-world evidence for checkpoint inhibitors.

What are the key market drivers leading to the rise in the adoption of PD-1 And PD-L1 Inhibitors Industry?

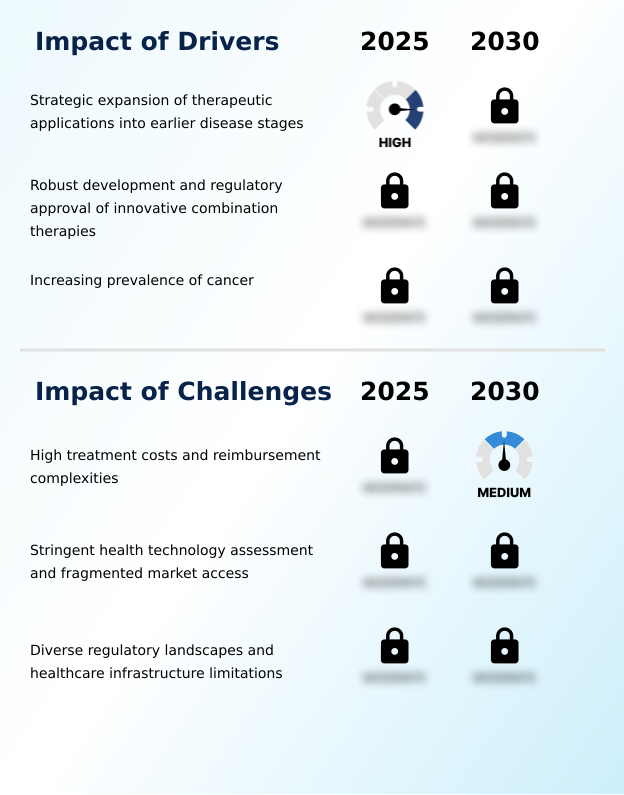
  • A key market driver is the strategic expansion of therapeutic applications into earlier disease stages, broadening the patient population and enhancing treatment outcomes.

  • Market growth is significantly propelled by the strategic therapeutic expansion of checkpoint inhibitors into earlier stages of cancer care. The integration of neoadjuvant immunotherapy and adjuvant checkpoint blockade into treatment protocols for resectable tumors is broadening the addressable patient population.
  • Clinical trials have demonstrated that this early intervention can improve event-free survival by more than 20% in certain cancers, such as metastatic melanoma.
  • This success is driving further research into the overall survival benefit across a wider range of solid tumor indications and hematological malignancies. The robust immuno-oncology drug development pipeline, focused on creating effective checkpoint inhibitor combinations, continues to fuel this expansion.
  • Exploring cemiplimab uses and other novel agents in these settings is a primary focus of ongoing research.

What are the market trends shaping the PD-1 And PD-L1 Inhibitors Industry?

  • A significant market trend is the transition toward subcutaneous formulations. This shift aims to enhance the convenience and efficiency of administration for patients and healthcare providers.

  • Key trends are reshaping the market, with a notable shift toward developing bispecific antibodies and advanced subcutaneous formulations. These innovations are critical elements of checkpoint inhibitor lifecycle management, designed to offer superior efficacy and patient convenience. The move to subcutaneous delivery, for example, has been shown to reduce patient chair time by over 80% compared to standard intravenous infusion.
  • This transition not only improves the patient experience but also optimizes clinical resources. As the immuno-oncology pipeline matures, the focus on atezolizumab side effects and the management of irAEs becomes increasingly important for long-term treatment success. The development of sophisticated therapies like bispecific checkpoint inhibitors represents the next frontier in cancer treatment.

What challenges does the PD-1 And PD-L1 Inhibitors Industry face during its growth?

  • High treatment costs and complex reimbursement landscapes present a significant challenge to industry growth and patient access.

  • Significant challenges constrain market access, primarily related to the high costs of programmed cell death protein 1 therapies and complex oncology drug reimbursement pathways. The financial burden on healthcare systems and patients can be substantial, with out-of-pocket costs contributing to treatment discontinuation rates of up to 15% in certain underinsured populations.
  • This issue is compounded by the need for a robust regulatory approval process for new indications and combinations, which can be lengthy and expensive. Furthermore, navigating PD-1 vs PD-L1 inhibitors for specific indications requires clear clinical guidelines and a strong evidence base.
  • As classical hodgkin lymphoma and HER2+ gastric cancer treatments evolve, ensuring equitable access remains a critical hurdle for the industry.

Exclusive Technavio Analysis on Customer Landscape

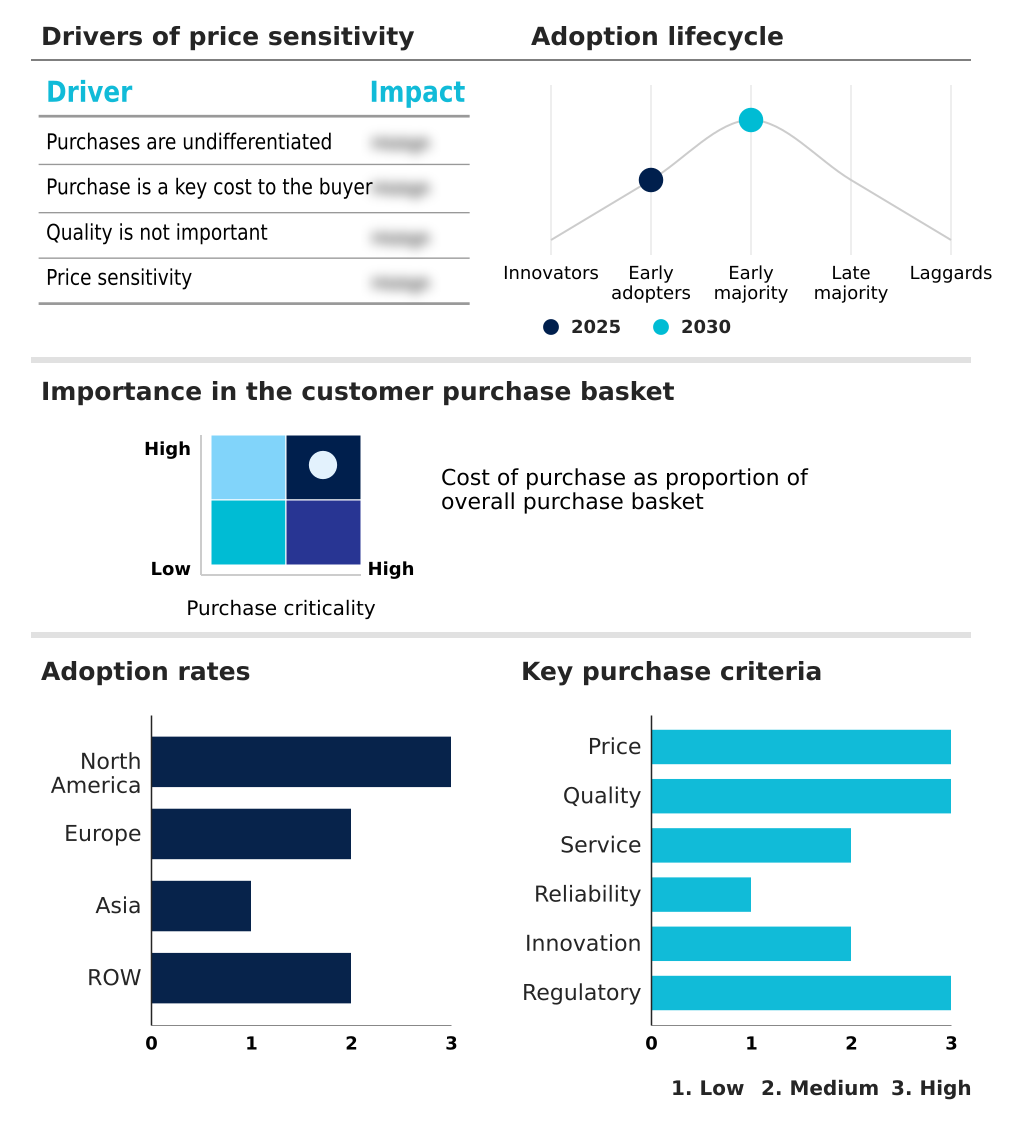
The pd-1 and pd-l1 inhibitors market forecasting report includes the adoption lifecycle of the market, covering from the innovator’s stage to the laggard’s stage. It focuses on adoption rates in different regions based on penetration. Furthermore, the pd-1 and pd-l1 inhibitors market report also includes key purchase criteria and drivers of price sensitivity to help companies evaluate and develop their market growth analysis strategies.

Customer Landscape of PD-1 And PD-L1 Inhibitors Industry

Competitive Landscape

Companies are implementing various strategies, such as strategic alliances, pd-1 and pd-l1 inhibitors market forecast, partnerships, mergers and acquisitions, geographical expansion, and product/service launches, to enhance their presence in the industry.

Agenus Inc. - The portfolio includes advanced PD-1 and PD-L1 inhibitors, focusing on the development and commercialization of transformative treatments for various oncological indications.

The industry research and growth report includes detailed analyses of the competitive landscape of the market and information about key companies, including:

  • Agenus Inc.
  • AnaptysBio Inc.
  • AstraZeneca Plc
  • BeiGene Ltd.
  • Bristol Myers Squibb Co.
  • Coherus Oncology Inc
  • CStone Pharmaceuticals
  • F. Hoffmann La Roche Ltd.
  • GlaxoSmithKline Plc
  • Incyte Corp.
  • Innovent Biologics Inc.
  • Jiangsu Hengrui Pharmaceuticals
  • MacroGenics Inc.
  • Merck and Co. Inc.
  • Merck KGaA
  • Merus N.V.
  • Pfizer Inc.
  • Regeneron Pharmaceuticals Inc.
  • Sanofi SA
  • Shanghai Henlius Biotech Inc.

Qualitative and quantitative analysis of companies has been conducted to help clients understand the wider business environment as well as the strengths and weaknesses of key industry players. Data is qualitatively analyzed to categorize companies as pure play, category-focused, industry-focused, and diversified; it is quantitatively analyzed to categorize companies as dominant, leading, strong, tentative, and weak.

Recent Development and News in Pd-1 and pd-l1 inhibitors market

  • In January 2025, Pfizer Inc. announced positive topline results from its pivotal Phase III CREST trial, which evaluated sasanlimab in combination with Bacillus Calmette-Guerin for treating non-muscle invasive bladder cancer.
  • In February 2025, Shanghai Henlius Biotech Inc. announced that its PD-L1 antibody-drug conjugate, HLX43, had successfully completed the first patient dosing in a Phase II clinical trial for advanced solid tumors.
  • In March 2025, the U.S. Food and Drug Administration granted traditional approval to Merck and Co. Inc.'s Pembrolizumab, used in combination with trastuzumab and chemotherapy, for treating HER2-positive gastric or gastroesophageal junction adenocarcinoma that expresses PD-L1.
  • In September 2025, the U.S. Food and Drug Administration approved the subcutaneous injection formulation of Merck and Co. Inc.'s pembrolizumab for all previously approved adult solid tumor indications, streamlining administration.

Dive into Technavio’s robust research methodology, blending expert interviews, extensive data synthesis, and validated models for unparalleled PD-1 And PD-L1 Inhibitors Market insights. See full methodology.

Market Scope
Page number 284
Base year 2025
Historic period 2020-2024
Forecast period 2026-2030
Growth momentum & CAGR Accelerate at a CAGR of 19.1%
Market growth 2026-2030 USD 70194.6 million
Market structure Fragmented
YoY growth 2025-2026(%) 17.2%
Key countries US, Canada, Mexico, Germany, UK, France, Italy, Spain, The Netherlands, China, India, Japan, South Korea, Indonesia, Thailand, Brazil, Saudi Arabia, UAE, Turkey, Argentina, Chile, South Africa and Israel
Competitive landscape Leading Companies, Market Positioning of Companies, Competitive Strategies, and Industry Risks

Request Free Sample

Research Analyst Overview

  • The PD-1 and PD-L1 inhibitors market is characterized by rapid therapeutic expansion, where monoclonal antibody therapy targets the immune checkpoint pathway to restore T-cell activation. The focus on enhancing anti-tumor immunity is driving the evolution of cancer immunotherapy from late-stage to perioperative settings, including neoadjuvant therapy and adjuvant treatment.
  • This strategic shift addresses a wider range of solid tumor indications and hematological malignancies. The development of novel combination therapies, including those with antibody-drug conjugates (ADCs) and bispecific antibodies, is crucial for overcoming resistance. Innovation in administration is also a key theme, with a move toward subcutaneous formulations over traditional intravenous infusion.
  • Within this landscape, the tumor microenvironment and biomarker expression levels are central to research. The adoption of standardized companion diagnostics to guide treatment for conditions like platinum-resistant ovarian cancer and non-small cell lung cancer has improved patient stratification, leading to a 30% increase in clinical trial enrollment efficiency for specific indications.
  • Managing immune-related adverse events (irAEs) and navigating biosimilar competition are critical operational challenges for stakeholders in the immuno-oncology field.

What are the Key Data Covered in this PD-1 And PD-L1 Inhibitors Market Research and Growth Report?

  • What is the expected growth of the PD-1 And PD-L1 Inhibitors Market between 2026 and 2030?

    • USD 70.19 billion, at a CAGR of 19.1%

  • What segmentation does the market report cover?

    • The report is segmented by Application (Solid tumors, and Blood-related tumors), Type (PD-1, and PD-L1), Distribution Channel (Hospital, Retail, and Online pharmacies) and Geography (North America, Europe, Asia, Rest of World (ROW))

  • Which regions are analyzed in the report?

    • North America, Europe, Asia and Rest of World (ROW)

  • What are the key growth drivers and market challenges?

    • Strategic expansion of therapeutic applications into earlier disease stages, High treatment costs and reimbursement complexities

  • Who are the major players in the PD-1 And PD-L1 Inhibitors Market?

    • Agenus Inc., AnaptysBio Inc., AstraZeneca Plc, BeiGene Ltd., Bristol Myers Squibb Co., Coherus Oncology Inc, CStone Pharmaceuticals, F. Hoffmann La Roche Ltd., GlaxoSmithKline Plc, Incyte Corp., Innovent Biologics Inc., Jiangsu Hengrui Pharmaceuticals, MacroGenics Inc., Merck and Co. Inc., Merck KGaA, Merus N.V., Pfizer Inc., Regeneron Pharmaceuticals Inc., Sanofi SA and Shanghai Henlius Biotech Inc.

Market Research Insights

  • The market is shaped by a deep understanding of the PD-1 inhibitor mechanism and the ongoing effort to overcome immunotherapy resistance mechanisms. Checkpoint inhibitor lifecycle management is a key strategic focus, with companies exploring novel formulations and combinations to extend product viability.
  • This competitive environment is fostering the integration of value-based oncology care models, where reimbursement is increasingly tied to patient outcomes. These models have demonstrated an ability to reduce non-essential expenditures by over 10% in accountable care organizations.
  • Concurrently, the refinement of PD-L1 testing methods and companion diagnostics for PD-L1 has improved patient stratification, leading to response rate improvements of up to 20% in select patient cohorts with refractory cancer immunotherapy needs. This data-driven approach is critical for justifying treatment decisions and navigating complex payer requirements.

We can help! Our analysts can customize this pd-1 and pd-l1 inhibitors market research report to meet your requirements.

Get in touch

1. Executive Summary

1.1 Market overview

Executive Summary - Chart on Market Overview
Executive Summary - Data Table on Market Overview
Executive Summary - Chart on Global Market Characteristics
Executive Summary - Chart on Market by Geography
Executive Summary - Chart on Market Segmentation by Application
Executive Summary - Chart on Market Segmentation by Type
Executive Summary - Chart on Market Segmentation by Distribution Channel
Executive Summary - Chart on Incremental Growth
Executive Summary - Data Table on Incremental Growth
Executive Summary - Chart on Company Market Positioning

2. Technavio Analysis

2.1 Analysis of price sensitivity, lifecycle, customer purchase basket, adoption rates, and purchase criteria

2.2 Criticality of inputs and Factors of differentiation

Chart on Overview on criticality of inputs and factors of differentiation

2.3 Factors of disruption

Chart on Overview on factors of disruption

2.4 Impact of drivers and challenges

Chart on Impact of drivers and challenges in 2025 and 2030

3. Market Landscape

3.1 Market ecosystem

Chart on Parent Market
Data Table on - Parent Market

3.2 Market characteristics

Chart on Market characteristics analysis

3.3 Value chain analysis

Chart on Value chain analysis

4. Market Sizing

4.1 Market definition

Data Table on Offerings of companies included in the market definition

4.2 Market segment analysis

Market segments

4.3 Market size 2025

4.4 Market outlook: Forecast for 2025-2030

Chart on Global - Market size and forecast 2025-2030 ($ million)
Data Table on Global - Market size and forecast 2025-2030 ($ million)
Chart on Global Market: Year-over-year growth 2025-2030 (%)
Data Table on Global Market: Year-over-year growth 2025-2030 (%)

5. Historic Market Size

5.1 Global PD-1 And PD-L1 Inhibitors Market 2020 - 2024

Historic Market Size - Data Table on Global PD-1 And PD-L1 Inhibitors Market 2020 - 2024 ($ million)

5.2 Application segment analysis 2020 - 2024

Historic Market Size - Application Segment 2020 - 2024 ($ million)

5.3 Type segment analysis 2020 - 2024

Historic Market Size - Type Segment 2020 - 2024 ($ million)

5.4 Distribution Channel segment analysis 2020 - 2024

Historic Market Size - Distribution Channel Segment 2020 - 2024 ($ million)

5.5 Geography segment analysis 2020 - 2024

Historic Market Size - Geography Segment 2020 - 2024 ($ million)

5.6 Country segment analysis 2020 - 2024

Historic Market Size - Country Segment 2020 - 2024 ($ million)

6. Qualitative Analysis

6.1 Impact of AI on Global PD-1 and PD-L1 Inhibitors Market

6.2 Impact of Geopolitical Conflict on Global PD-1 and PD-L1 Inhibitors Market

7. Five Forces Analysis

7.1 Five forces summary

Five forces analysis - Comparison between 2025 and 2030

7.2 Bargaining power of buyers

Bargaining power of buyers - Impact of key factors 2025 and 2030

7.3 Bargaining power of suppliers

Bargaining power of suppliers - Impact of key factors in 2025 and 2030

7.4 Threat of new entrants

Threat of new entrants - Impact of key factors in 2025 and 2030

7.5 Threat of substitutes

Threat of substitutes - Impact of key factors in 2025 and 2030

7.6 Threat of rivalry

Threat of rivalry - Impact of key factors in 2025 and 2030

7.7 Market condition

Chart on Market condition - Five forces 2025 and 2030

8. Market Segmentation by Application

8.1 Market segments

Chart on Application - Market share 2025-2030 (%)
Data Table on Application - Market share 2025-2030 (%)

8.2 Comparison by Application

Chart on Comparison by Application
Data Table on Comparison by Application

8.3 Solid tumors - Market size and forecast 2025-2030

Chart on Solid tumors - Market size and forecast 2025-2030 ($ million)
Data Table on Solid tumors - Market size and forecast 2025-2030 ($ million)
Chart on Solid tumors - Year-over-year growth 2025-2030 (%)
Data Table on Solid tumors - Year-over-year growth 2025-2030 (%)

8.4 Blood-related tumors - Market size and forecast 2025-2030

Chart on Blood-related tumors - Market size and forecast 2025-2030 ($ million)
Data Table on Blood-related tumors - Market size and forecast 2025-2030 ($ million)
Chart on Blood-related tumors - Year-over-year growth 2025-2030 (%)
Data Table on Blood-related tumors - Year-over-year growth 2025-2030 (%)

8.5 Market opportunity by Application

Market opportunity by Application ($ million)
Data Table on Market opportunity by Application ($ million)

9. Market Segmentation by Type

9.1 Market segments

Chart on Type - Market share 2025-2030 (%)
Data Table on Type - Market share 2025-2030 (%)

9.2 Comparison by Type

Chart on Comparison by Type
Data Table on Comparison by Type

9.3 PD-1 - Market size and forecast 2025-2030

Chart on PD-1 - Market size and forecast 2025-2030 ($ million)
Data Table on PD-1 - Market size and forecast 2025-2030 ($ million)
Chart on PD-1 - Year-over-year growth 2025-2030 (%)
Data Table on PD-1 - Year-over-year growth 2025-2030 (%)

9.4 PD-L1 - Market size and forecast 2025-2030

Chart on PD-L1 - Market size and forecast 2025-2030 ($ million)
Data Table on PD-L1 - Market size and forecast 2025-2030 ($ million)
Chart on PD-L1 - Year-over-year growth 2025-2030 (%)
Data Table on PD-L1 - Year-over-year growth 2025-2030 (%)

9.5 Market opportunity by Type

Market opportunity by Type ($ million)
Data Table on Market opportunity by Type ($ million)

10. Market Segmentation by Distribution Channel

10.1 Market segments

Chart on Distribution Channel - Market share 2025-2030 (%)
Data Table on Distribution Channel - Market share 2025-2030 (%)

10.2 Comparison by Distribution Channel

Chart on Comparison by Distribution Channel
Data Table on Comparison by Distribution Channel

10.3 Hospital - Market size and forecast 2025-2030

Chart on Hospital - Market size and forecast 2025-2030 ($ million)
Data Table on Hospital - Market size and forecast 2025-2030 ($ million)
Chart on Hospital - Year-over-year growth 2025-2030 (%)
Data Table on Hospital - Year-over-year growth 2025-2030 (%)

10.4 Retail - Market size and forecast 2025-2030

Chart on Retail - Market size and forecast 2025-2030 ($ million)
Data Table on Retail - Market size and forecast 2025-2030 ($ million)
Chart on Retail - Year-over-year growth 2025-2030 (%)
Data Table on Retail - Year-over-year growth 2025-2030 (%)

10.5 Online pharmacies - Market size and forecast 2025-2030

Chart on Online pharmacies - Market size and forecast 2025-2030 ($ million)
Data Table on Online pharmacies - Market size and forecast 2025-2030 ($ million)
Chart on Online pharmacies - Year-over-year growth 2025-2030 (%)
Data Table on Online pharmacies - Year-over-year growth 2025-2030 (%)

10.6 Market opportunity by Distribution Channel

Market opportunity by Distribution Channel ($ million)
Data Table on Market opportunity by Distribution Channel ($ million)

11. Customer Landscape

11.1 Customer landscape overview

Analysis of price sensitivity, lifecycle, customer purchase basket, adoption rates, and purchase criteria

12. Geographic Landscape

12.1 Geographic segmentation

Chart on Market share by geography 2025-2030 (%)
Data Table on Market share by geography 2025-2030 (%)

12.2 Geographic comparison

Chart on Geographic comparison
Data Table on Geographic comparison

12.3 North America - Market size and forecast 2025-2030

Chart on North America - Market size and forecast 2025-2030 ($ million)
Data Table on North America - Market size and forecast 2025-2030 ($ million)
Chart on North America - Year-over-year growth 2025-2030 (%)
Data Table on North America - Year-over-year growth 2025-2030 (%)
Chart on Regional Comparison - North America
Data Table on Regional Comparison - North America

12.3.1 US - Market size and forecast 2025-2030

Chart on US - Market size and forecast 2025-2030 ($ million)
Data Table on US - Market size and forecast 2025-2030 ($ million)
Chart on US - Year-over-year growth 2025-2030 (%)
Data Table on US - Year-over-year growth 2025-2030 (%)

12.3.2 Canada - Market size and forecast 2025-2030

Chart on Canada - Market size and forecast 2025-2030 ($ million)
Data Table on Canada - Market size and forecast 2025-2030 ($ million)
Chart on Canada - Year-over-year growth 2025-2030 (%)
Data Table on Canada - Year-over-year growth 2025-2030 (%)

12.3.3 Mexico - Market size and forecast 2025-2030

Chart on Mexico - Market size and forecast 2025-2030 ($ million)
Data Table on Mexico - Market size and forecast 2025-2030 ($ million)
Chart on Mexico - Year-over-year growth 2025-2030 (%)
Data Table on Mexico - Year-over-year growth 2025-2030 (%)

12.4 Europe - Market size and forecast 2025-2030

Chart on Europe - Market size and forecast 2025-2030 ($ million)
Data Table on Europe - Market size and forecast 2025-2030 ($ million)
Chart on Europe - Year-over-year growth 2025-2030 (%)
Data Table on Europe - Year-over-year growth 2025-2030 (%)
Chart on Regional Comparison - Europe
Data Table on Regional Comparison - Europe

12.4.1 Germany - Market size and forecast 2025-2030

Chart on Germany - Market size and forecast 2025-2030 ($ million)
Data Table on Germany - Market size and forecast 2025-2030 ($ million)
Chart on Germany - Year-over-year growth 2025-2030 (%)
Data Table on Germany - Year-over-year growth 2025-2030 (%)

12.4.2 UK - Market size and forecast 2025-2030

Chart on UK - Market size and forecast 2025-2030 ($ million)
Data Table on UK - Market size and forecast 2025-2030 ($ million)
Chart on UK - Year-over-year growth 2025-2030 (%)
Data Table on UK - Year-over-year growth 2025-2030 (%)

12.4.3 France - Market size and forecast 2025-2030

Chart on France - Market size and forecast 2025-2030 ($ million)
Data Table on France - Market size and forecast 2025-2030 ($ million)
Chart on France - Year-over-year growth 2025-2030 (%)
Data Table on France - Year-over-year growth 2025-2030 (%)

12.4.4 Italy - Market size and forecast 2025-2030

Chart on Italy - Market size and forecast 2025-2030 ($ million)
Data Table on Italy - Market size and forecast 2025-2030 ($ million)
Chart on Italy - Year-over-year growth 2025-2030 (%)
Data Table on Italy - Year-over-year growth 2025-2030 (%)

12.4.5 Spain - Market size and forecast 2025-2030

Chart on Spain - Market size and forecast 2025-2030 ($ million)
Data Table on Spain - Market size and forecast 2025-2030 ($ million)
Chart on Spain - Year-over-year growth 2025-2030 (%)
Data Table on Spain - Year-over-year growth 2025-2030 (%)

12.4.6 The Netherlands - Market size and forecast 2025-2030

Chart on The Netherlands - Market size and forecast 2025-2030 ($ million)
Data Table on The Netherlands - Market size and forecast 2025-2030 ($ million)
Chart on The Netherlands - Year-over-year growth 2025-2030 (%)
Data Table on The Netherlands - Year-over-year growth 2025-2030 (%)

12.5 Asia - Market size and forecast 2025-2030

Chart on Asia - Market size and forecast 2025-2030 ($ million)
Data Table on Asia - Market size and forecast 2025-2030 ($ million)
Chart on Asia - Year-over-year growth 2025-2030 (%)
Data Table on Asia - Year-over-year growth 2025-2030 (%)
Chart on Regional Comparison - Asia
Data Table on Regional Comparison - Asia

12.5.1 China - Market size and forecast 2025-2030

Chart on China - Market size and forecast 2025-2030 ($ million)
Data Table on China - Market size and forecast 2025-2030 ($ million)
Chart on China - Year-over-year growth 2025-2030 (%)
Data Table on China - Year-over-year growth 2025-2030 (%)

12.5.2 India - Market size and forecast 2025-2030

Chart on India - Market size and forecast 2025-2030 ($ million)
Data Table on India - Market size and forecast 2025-2030 ($ million)
Chart on India - Year-over-year growth 2025-2030 (%)
Data Table on India - Year-over-year growth 2025-2030 (%)

12.5.3 Japan - Market size and forecast 2025-2030

Chart on Japan - Market size and forecast 2025-2030 ($ million)
Data Table on Japan - Market size and forecast 2025-2030 ($ million)
Chart on Japan - Year-over-year growth 2025-2030 (%)
Data Table on Japan - Year-over-year growth 2025-2030 (%)

12.5.4 South Korea - Market size and forecast 2025-2030

Chart on South Korea - Market size and forecast 2025-2030 ($ million)
Data Table on South Korea - Market size and forecast 2025-2030 ($ million)
Chart on South Korea - Year-over-year growth 2025-2030 (%)
Data Table on South Korea - Year-over-year growth 2025-2030 (%)

12.5.5 Indonesia - Market size and forecast 2025-2030

Chart on Indonesia - Market size and forecast 2025-2030 ($ million)
Data Table on Indonesia - Market size and forecast 2025-2030 ($ million)
Chart on Indonesia - Year-over-year growth 2025-2030 (%)
Data Table on Indonesia - Year-over-year growth 2025-2030 (%)

12.5.6 Thailand - Market size and forecast 2025-2030

Chart on Thailand - Market size and forecast 2025-2030 ($ million)
Data Table on Thailand - Market size and forecast 2025-2030 ($ million)
Chart on Thailand - Year-over-year growth 2025-2030 (%)
Data Table on Thailand - Year-over-year growth 2025-2030 (%)

12.6 Rest of World (ROW) - Market size and forecast 2025-2030

Chart on Rest of World (ROW) - Market size and forecast 2025-2030 ($ million)
Data Table on Rest of World (ROW) - Market size and forecast 2025-2030 ($ million)
Chart on Rest of World (ROW) - Year-over-year growth 2025-2030 (%)
Data Table on Rest of World (ROW) - Year-over-year growth 2025-2030 (%)
Chart on Regional Comparison - Rest of World (ROW)
Data Table on Regional Comparison - Rest of World (ROW)

12.6.1 Brazil - Market size and forecast 2025-2030

Chart on Brazil - Market size and forecast 2025-2030 ($ million)
Data Table on Brazil - Market size and forecast 2025-2030 ($ million)
Chart on Brazil - Year-over-year growth 2025-2030 (%)
Data Table on Brazil - Year-over-year growth 2025-2030 (%)

12.6.2 Saudi Arabia - Market size and forecast 2025-2030

Chart on Saudi Arabia - Market size and forecast 2025-2030 ($ million)
Data Table on Saudi Arabia - Market size and forecast 2025-2030 ($ million)
Chart on Saudi Arabia - Year-over-year growth 2025-2030 (%)
Data Table on Saudi Arabia - Year-over-year growth 2025-2030 (%)

12.6.3 UAE - Market size and forecast 2025-2030

Chart on UAE - Market size and forecast 2025-2030 ($ million)
Data Table on UAE - Market size and forecast 2025-2030 ($ million)
Chart on UAE - Year-over-year growth 2025-2030 (%)
Data Table on UAE - Year-over-year growth 2025-2030 (%)

12.6.4 Turkey - Market size and forecast 2025-2030

Chart on Turkey - Market size and forecast 2025-2030 ($ million)
Data Table on Turkey - Market size and forecast 2025-2030 ($ million)
Chart on Turkey - Year-over-year growth 2025-2030 (%)
Data Table on Turkey - Year-over-year growth 2025-2030 (%)

12.6.5 Argentina - Market size and forecast 2025-2030

Chart on Argentina - Market size and forecast 2025-2030 ($ million)
Data Table on Argentina - Market size and forecast 2025-2030 ($ million)
Chart on Argentina - Year-over-year growth 2025-2030 (%)
Data Table on Argentina - Year-over-year growth 2025-2030 (%)

12.6.6 Chile - Market size and forecast 2025-2030

Chart on Chile - Market size and forecast 2025-2030 ($ million)
Data Table on Chile - Market size and forecast 2025-2030 ($ million)
Chart on Chile - Year-over-year growth 2025-2030 (%)
Data Table on Chile - Year-over-year growth 2025-2030 (%)

12.6.7 South Africa - Market size and forecast 2025-2030

Chart on South Africa - Market size and forecast 2025-2030 ($ million)
Data Table on South Africa - Market size and forecast 2025-2030 ($ million)
Chart on South Africa - Year-over-year growth 2025-2030 (%)
Data Table on South Africa - Year-over-year growth 2025-2030 (%)

12.6.8 Israel - Market size and forecast 2025-2030

Chart on Israel - Market size and forecast 2025-2030 ($ million)
Data Table on Israel - Market size and forecast 2025-2030 ($ million)
Chart on Israel - Year-over-year growth 2025-2030 (%)
Data Table on Israel - Year-over-year growth 2025-2030 (%)

12.7 Market opportunity by geography

Market opportunity by geography ($ million)
Data Tables on Market opportunity by geography ($ million)

13. Drivers, Challenges, and Opportunity

13.1 Market drivers

Strategic expansion of therapeutic applications into earlier disease stages
Robust development and regulatory approval of innovative combination therapies
Increasing prevalence of cancer

13.2 Market challenges

High treatment costs and reimbursement complexities
Stringent health technology assessment and fragmented market access
Diverse regulatory landscapes and healthcare infrastructure limitations

13.3 Impact of drivers and challenges

Impact of drivers and challenges in 2025 and 2030

13.4 Market opportunities

Transition toward subcutaneous formulations for enhanced administration
Emergence and clinical validation of bispecific antibodies
Expanding role of precise companion diagnostics

14. Competitive Landscape

14.1 Overview

14.2

Overview on criticality of inputs and factors of differentiation

14.3 Landscape disruption

Overview on factors of disruption

14.4 Industry risks

Impact of key risks on business

15. Competitive Analysis

15.1 Companies profiled

Companies covered

15.2 Company ranking index

15.3 Market positioning of companies

Matrix on companies position and classification

15.4 AstraZeneca Plc

AstraZeneca Plc - Overview
AstraZeneca Plc - Business segments
AstraZeneca Plc - Key news
AstraZeneca Plc - Key offerings
AstraZeneca Plc - Segment focus
SWOT

15.5 BeiGene Ltd.

BeiGene Ltd. - Overview
BeiGene Ltd. - Business segments
BeiGene Ltd. - Key offerings
BeiGene Ltd. - Segment focus
SWOT

15.6 Bristol Myers Squibb Co.

Bristol Myers Squibb Co. - Overview
Bristol Myers Squibb Co. - Product / Service
Bristol Myers Squibb Co. - Key news
Bristol Myers Squibb Co. - Key offerings
SWOT

15.7 CStone Pharmaceuticals

CStone Pharmaceuticals - Overview
CStone Pharmaceuticals - Product / Service
CStone Pharmaceuticals - Key offerings
SWOT

15.8 F. Hoffmann La Roche Ltd.

F. Hoffmann La Roche Ltd. - Overview
F. Hoffmann La Roche Ltd. - Business segments
F. Hoffmann La Roche Ltd. - Key news
F. Hoffmann La Roche Ltd. - Key offerings
F. Hoffmann La Roche Ltd. - Segment focus
SWOT

15.9 GlaxoSmithKline Plc

GlaxoSmithKline Plc - Overview
GlaxoSmithKline Plc - Business segments
GlaxoSmithKline Plc - Key news
GlaxoSmithKline Plc - Key offerings
GlaxoSmithKline Plc - Segment focus
SWOT

15.10 Incyte Corp.

Incyte Corp. - Overview
Incyte Corp. - Product / Service
Incyte Corp. - Key news
Incyte Corp. - Key offerings
SWOT

15.11 Innovent Biologics Inc.

Innovent Biologics Inc. - Overview
Innovent Biologics Inc. - Product / Service
Innovent Biologics Inc. - Key news
Innovent Biologics Inc. - Key offerings
SWOT

15.12 Jiangsu Hengrui Pharmaceuticals

Jiangsu Hengrui Pharmaceuticals - Overview
Jiangsu Hengrui Pharmaceuticals - Product / Service
Jiangsu Hengrui Pharmaceuticals - Key offerings
SWOT

15.13 Merck and Co. Inc.

Merck and Co. Inc. - Overview
Merck and Co. Inc. - Business segments
Merck and Co. Inc. - Key news
Merck and Co. Inc. - Key offerings
Merck and Co. Inc. - Segment focus
SWOT

15.14 Merck KGaA

Merck KGaA - Overview
Merck KGaA - Business segments
Merck KGaA - Key news
Merck KGaA - Key offerings
Merck KGaA - Segment focus
SWOT

15.15 Pfizer Inc.

Pfizer Inc. - Overview
Pfizer Inc. - Business segments
Pfizer Inc. - Key news
Pfizer Inc. - Key offerings
Pfizer Inc. - Segment focus
SWOT

15.16 Regeneron Pharmaceuticals Inc.

Regeneron Pharmaceuticals Inc. - Overview
Regeneron Pharmaceuticals Inc. - Product / Service
Regeneron Pharmaceuticals Inc. - Key news
Regeneron Pharmaceuticals Inc. - Key offerings
SWOT

15.17 Sanofi SA

Sanofi SA - Overview
Sanofi SA - Business segments
Sanofi SA - Key news
Sanofi SA - Key offerings
Sanofi SA - Segment focus
SWOT

15.18 Shanghai Henlius Biotech Inc.

Shanghai Henlius Biotech Inc. - Overview
Shanghai Henlius Biotech Inc. - Product / Service
Shanghai Henlius Biotech Inc. - Key offerings
SWOT

16. Appendix

16.1 Scope of the report

Market definition
Objectives
Notes and caveats

16.2 Inclusions and exclusions checklist

Inclusions checklist
Exclusions checklist

16.3 Currency conversion rates for US$

16.4 Research methodology

16.5 Data procurement

Information sources

16.6 Data validation

16.7 Validation techniques employed for market sizing

16.8 Data synthesis

16.9 360 degree market analysis

16.10 List of abbreviations

Research Methodology

Technavio presents a detailed picture of the market by way of study, synthesis, and summation of data from multiple sources. The analysts have presented the various facets of the market with a particular focus on identifying the key industry influencers. The data thus presented is comprehensive, reliable, and the result of extensive research, both primary and secondary.

INFORMATION SOURCES

Primary sources

  • Manufacturers and suppliers
  • Channel partners
  • Industry experts
  • Strategic decision makers

Secondary sources

  • Industry journals and periodicals
  • Government data
  • Financial reports of key industry players
  • Historical data
  • Press releases

DATA ANALYSIS

Data Synthesis

  • Collation of data
  • Estimation of key figures
  • Analysis of derived insights

Data Validation

  • Triangulation with data models
  • Reference against proprietary databases
  • Corroboration with industry experts

REPORT WRITING

Qualitative

  • Market drivers
  • Market challenges
  • Market trends
  • Five forces analysis

Quantitative

  • Market size and forecast
  • Market segmentation
  • Geographical insights
  • Competitive landscape

Interested in this report?

Get your sample now to see our research methodology and insights!

Download Now

Frequently Asked Questions

PD-1 And PD-L1 Inhibitors market growth will increase by USD 70194.6 million during 2026-2030.

The PD-1 And PD-L1 Inhibitors market is expected to grow at a CAGR of 19.1% during 2026-2030.

PD-1 And PD-L1 Inhibitors market is segmented by Application (Solid tumors, Blood-related tumors) Type (PD-1, PD-L1) Distribution channel (Hospital, Retail, Online pharmacies)

Agenus Inc., AnaptysBio Inc., AstraZeneca Plc, BeiGene Ltd., Bristol Myers Squibb Co., Coherus Oncology Inc, CStone Pharmaceuticals, F. Hoffmann La Roche Ltd., GlaxoSmithKline Plc, Incyte Corp., Innovent Biologics Inc., Jiangsu Hengrui Pharmaceuticals, MacroGenics Inc., Merck and Co. Inc., Merck KGaA, Merus N.V., Pfizer Inc., Regeneron Pharmaceuticals Inc., Sanofi SA, Shanghai Henlius Biotech Inc. are a few of the key vendors in the PD-1 And PD-L1 Inhibitors market.

North America will register the highest growth rate of 48.1% among the other regions. Therefore, the PD-1 And PD-L1 Inhibitors market in North America is expected to garner significant business opportunities for the vendors during the forecast period.

US, Canada, Mexico, Germany, UK, France, Italy, Spain, The Netherlands, China, India, Japan, South Korea, Indonesia, Thailand, Brazil, Saudi Arabia, UAE, Turkey, Argentina, Chile, South Africa, Israel

  • Strategic expansion of therapeutic applications into earlier disease stages is the driving factor this market.

The PD-1 And PD-L1 Inhibitors market vendors should focus on grabbing business opportunities from the Application segment as it accounted for the largest market share in the base year.
RIA - Research AI Assistant
Ask RIA