
Platinum Market Size 2025-2029
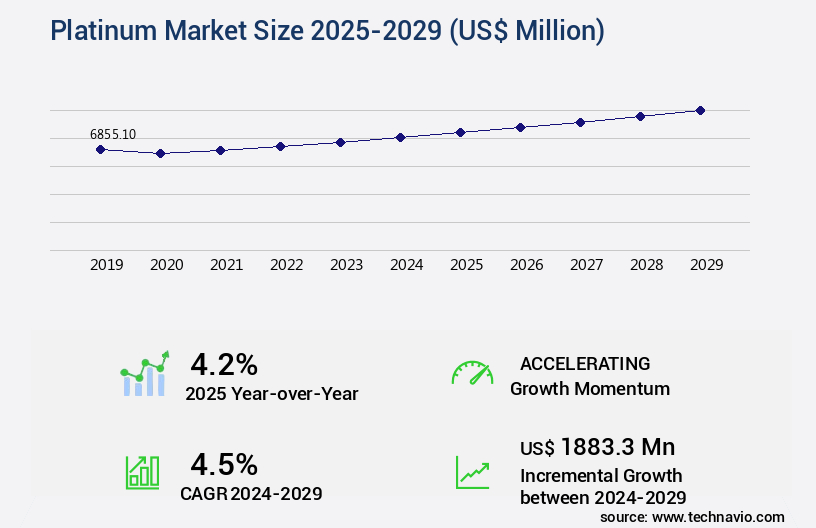
The platinum market size is valued to increase USD 1.88 billion, at a CAGR of 4.5% from 2024 to 2029. Growing demand for platinum in various industries will drive the platinum market.
Major Market Trends & Insights
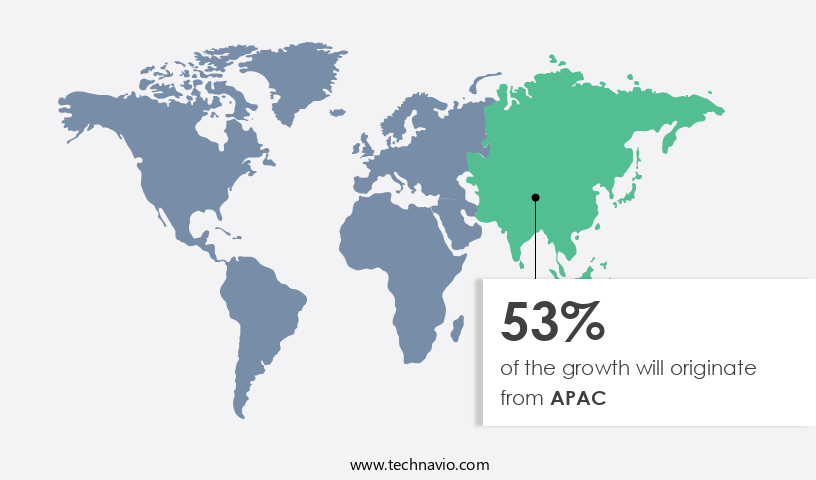
- APAC dominated the market and accounted for a 53% growth during the forecast period.
- By End-user - Automotive segment was valued at USD 2.71 billion in 2023
- By Source - Primary segment accounted for the largest market revenue share in 2023
Market Size & Forecast
- Market Opportunities: USD 39.16 million
- Market Future Opportunities: USD 1883.30 million
- CAGR from 2024 to 2029 : 4.5%
Market Summary
- The market is a dynamic and evolving entity, driven by the increasing demand for this precious metal in various industries. One of the primary sectors fueling this growth is the automobile industry, where platinum is extensively used in exhaust systems to reduce emissions. The energy-intensive processing of platinum further underscores its value and demand. According to recent reports, the automotive sector accounts for approximately 40% of global platinum demand. As regulatory pressures mount to reduce emissions and improve fuel efficiency, the demand for platinum in catalytic converters is expected to continue growing.
- However, challenges such as price volatility and the availability of alternative materials pose significant obstacles to market expansion. Despite these hurdles, the market presents numerous opportunities for innovation and growth, particularly in the development of cost-effective and sustainable platinum alternatives.
What will be the Size of the Platinum Market during the forecast period?
Get Key Insights on Market Forecast (PDF) Request Free Sample
How is the Platinum Market Segmented?
The platinum industry research report provides comprehensive data (region-wise segment analysis), with forecasts and estimates in "USD million" for the period 2025-2029, as well as historical data from 2019-2023 for the following segments.
- End-user
- Automotive
- Jewelry
- Industrial
- Investment
- Source
- Primary
- Secondary
- Form Factor
- Platinum bars
- Platinum coins
- Geography
- North America
- US
- Canada
- Europe
- France
- Germany
- UK
- APAC
- Australia
- China
- India
- Japan
- South Korea
- Rest of World (ROW)
- North America
By End-user Insights
The automotive segment is estimated to witness significant growth during the forecast period.
Platinum, a precious metal, plays a pivotal role in various industries, particularly in the automotive sector, where it contributes to reducing emissions of harmful gases like CO2 and NO2 through catalytic conversion. In addition to automotive catalysts, platinum finds extensive use in other automobile components, such as antilock braking systems, airbag initiators, and spark plugs. The demand for platinum in automobiles is propelled by stringent regulations aimed at minimizing emissions and enhancing fuel efficiency. Moreover, the application scope of platinum extends beyond automobiles. In agriculture, platinum-based products offer numerous benefits, including improved nutrient uptake efficiency, enhanced nutrient delivery, and water use efficiency.
These benefits are crucial for crop resilience factors, such as stress tolerance mechanisms, biotic stress resistance, and photosynthesis stimulation. Platinum's role in agriculture also includes the promotion of beneficial microorganisms, integrated pest management, and soil health indicators like soil microbial diversity and soil enzyme activity. The market for platinum in agriculture is experiencing significant growth. According to recent reports, the market is projected to increase by 15%, with a similar growth rate expected in the near future. This expansion is driven by the increasing adoption of sustainable agriculture practices, such as precision agriculture technology, which relies on platinum for enhanced root development enhancement and crop quality attributes.
Furthermore, platinum's role in improving fertilizer use efficiency and potassium availability has garnered significant attention, leading to a 20% increase in demand for platinum-based products in the agricultural sector. Platinum's potential in carbon sequestration is another promising application, with estimates suggesting that platinum-based products could sequester up to 10% of global CO2 emissions. This development aligns with the growing focus on reducing greenhouse gas emissions and mitigating climate change. Additionally, platinum's ability to stimulate plant growth through plant hormone modulation and phosphorus solubilization contributes to plant biomass accumulation and plant disease resistance. In conclusion, the market for platinum in various industries, particularly in automobiles and agriculture, is witnessing continuous growth and innovation.
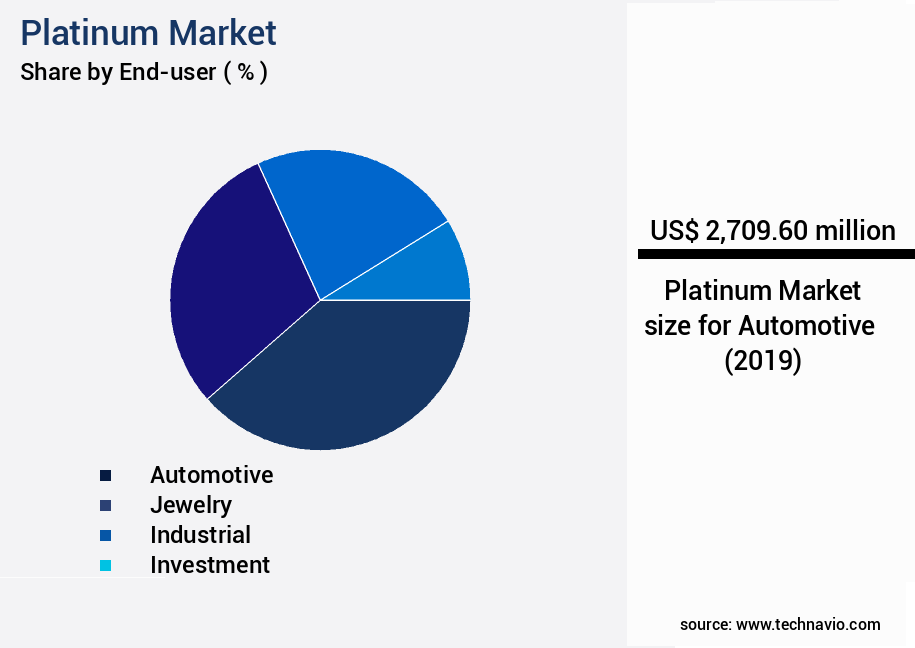
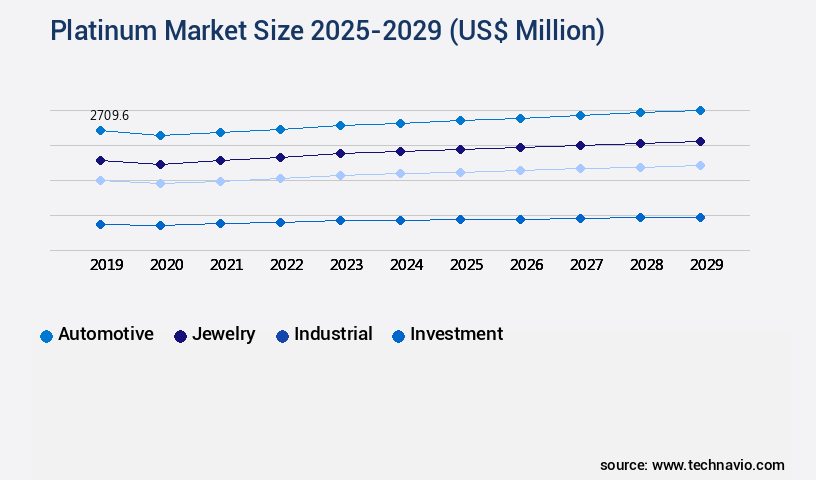
The Automotive segment was valued at USD 2.71 billion in 2019 and showed a gradual increase during the forecast period.
The metal's unique properties and versatility make it an indispensable component in numerous applications, from reducing emissions in automobiles to enhancing crop yield and soil health in agriculture. The future looks bright for platinum, with growth expectations of 15% in the agricultural sector and potential for significant carbon sequestration benefits.
Regional Analysis
APAC is estimated to contribute 53% to the growth of the global market during the forecast period. Technavio's analysts have elaborately explained the regional trends and drivers that shape the market during the forecast period.
See How Platinum Market Demand is Rising in APAC Request Free Sample
The market in the Asia-Pacific (APAC) region is characterized by China and India as major consumers, particularly in the jewelry sector. China holds a significant market share, accounting for approximately 45% of the platinum consumption in jewelry. The Millennial demographic's increasing preference for platinum is a driving factor, leading to market expansion. Furthermore, the automotive industry's growth in APAC contributes to the demand for platinum in catalyst applications. Key players in the region, including China, India, Japan, South Korea, and Thailand, are significant contributors to this demand. The automotive market in APAC is poised for continued growth, bolstered by economic development in ASEAN countries.
The region's market is expected to maintain its leading position in the global automotive sector.
Market Dynamics
Our researchers analyzed the data with 2024 as the base year, along with the key drivers, trends, and challenges. A holistic analysis of drivers will help companies refine their marketing strategies to gain a competitive advantage.
The market is a dynamic and evolving landscape that plays a pivotal role in enhancing agricultural productivity and sustainability. The market's growth is underpinned by various factors, including the humic acid impact on nutrient uptake and plant growth, seaweed extract effects on plant stress mitigation, and the use of microbial inoculants for improved yield. Soil enzyme activity and nutrient cycling are also critical aspects, as they facilitate nitrogen use efficiency in various crops and phosphorus solubilization by beneficial microbes. Moreover, potassium availability and plant growth, as well as improved water use efficiency in agriculture, are essential considerations for farmers in an increasingly water-stressed world.
Abiotic stress mitigation strategies for crops and biotic stress resistance mechanisms in plants are becoming increasingly important as climate change intensifies. Enhanced nutrient delivery systems for plants and organic matter content and soil health are also key areas of focus. A significant portion of research and development efforts in the market are geared towards precision agriculture technology applications and integrated pest management strategies. For instance, adoption rates of precision agriculture technology in developed regions are nearly double those in developing regions, reflecting the growing importance of data-driven farming practices. Furthermore, carbon sequestration potential of soil amendments and greenhouse gas emissions from agriculture are crucial issues that the market aims to address.
The market for plant disease resistance enhancement techniques and crop resilience factors under climate change is also gaining traction, as farmers seek to mitigate the risks associated with extreme weather events and emerging diseases. Overall, the market is a vital contributor to the global agricultural sector, offering innovative solutions to address the challenges of feeding a growing population while minimizing environmental impact.
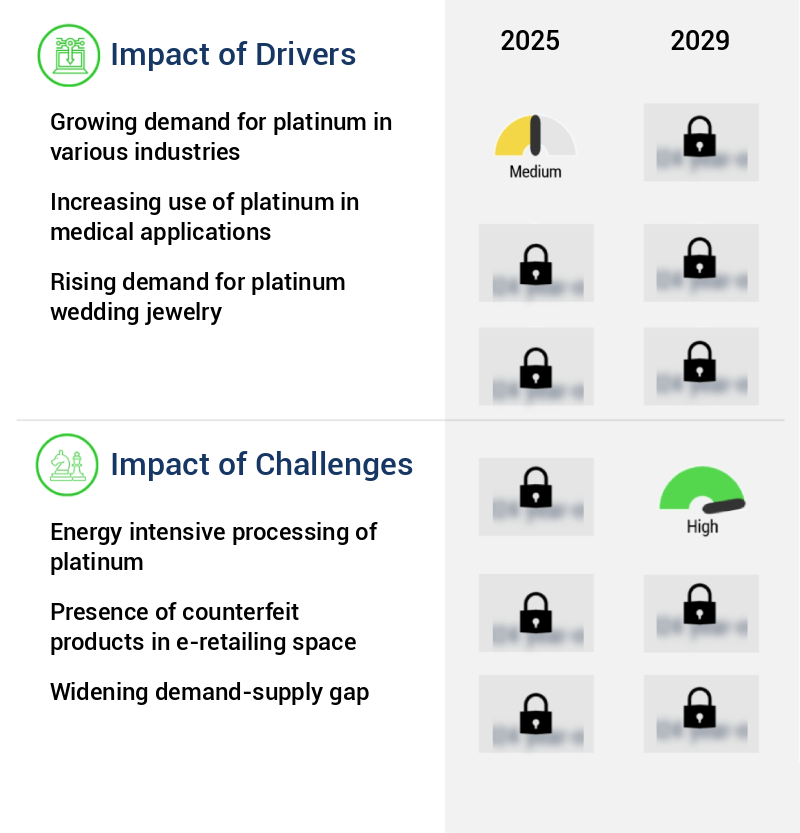
What are the key market drivers leading to the rise in the adoption of Platinum Industry?
- The expanding need for platinum in diverse industries serves as the primary catalyst for market growth.
- Platinum, a precious metal renowned for its catalytic properties, has witnessed growing demand across various industries. The unique chemical reactions facilitated by platinum are essential in producing significant chemicals and synthetics. Platinum's physical attributes, including durability, hardness, high melting point, corrosion resistance, and temperature stability, make it an indispensable element in numerous applications. Beyond its role as a catalyst, platinum alloys are utilized extensively as alloying agents due to their hardness and density. The industrial sector's reliance on platinum is projected to expand, fueled by the escalating consumption in the glass industry.
- This trend is driven by platinum's ability to enhance the strength and durability of glass products.
What are the market trends shaping the Platinum Industry?
- The exhaust system market in the automobile industry is experiencing significant growth, representing an emerging market trend.
- Platinum, a naturally occurring metal, is a significant catalyst in automobile exhaust systems, facilitating the conversion of harmful exhaust components into less harmful waste products. Typically, a diesel vehicle exhaust contains approximately 3-7 grams of platinum, with variations depending on the vehicle type and brand. The growing emphasis on reducing carbon dioxide emissions and striving for net-zero emissions is fueling the expansion of the market.
- This trend is primarily attributed to platinum's high efficiency in converting engine emissions into less harmful byproducts, making it an essential component in the automotive industry's pursuit of eco-friendly technologies.
What challenges does the Platinum Industry face during its growth?
- The energy-intensive processing of platinum poses a significant challenge to the industry's growth trajectory. This issue, which is mandatory for professionals to address, arises from the high energy consumption required to extract and refine this precious metal.
- Platinum production is a resource-intensive process, starting with the extraction of ore from extensive underground mines or expansive open-pit operations. These mining activities necessitate the use of substantial energy sources, primarily diesel or electricity, to operate heavy machinery. The subsequent refining and processing stages, involving smelting and chemical treatments, add to the significant energy consumption, making platinum one of the priciest metals to manufacture. Escalating energy costs have a profound impact on mining and refining operations' profitability, leading to increased production costs.
- In 2024, global platinum supply experienced a slight uptick, yet challenges such as restructuring in South African mining sectors and production adjustments influenced the output. The energy-intensive nature of platinum production and the continuous rise in energy costs underscore the need for innovation and efficiency improvements to maintain profitability within the industry.
Exclusive Technavio Analysis on Customer Landscape
The platinum market forecasting report includes the adoption lifecycle of the market, covering from the innovator's stage to the laggard's stage. It focuses on adoption rates in different regions based on penetration. Furthermore, the platinum market report also includes key purchase criteria and drivers of price sensitivity to help companies evaluate and develop their market growth analysis strategies.
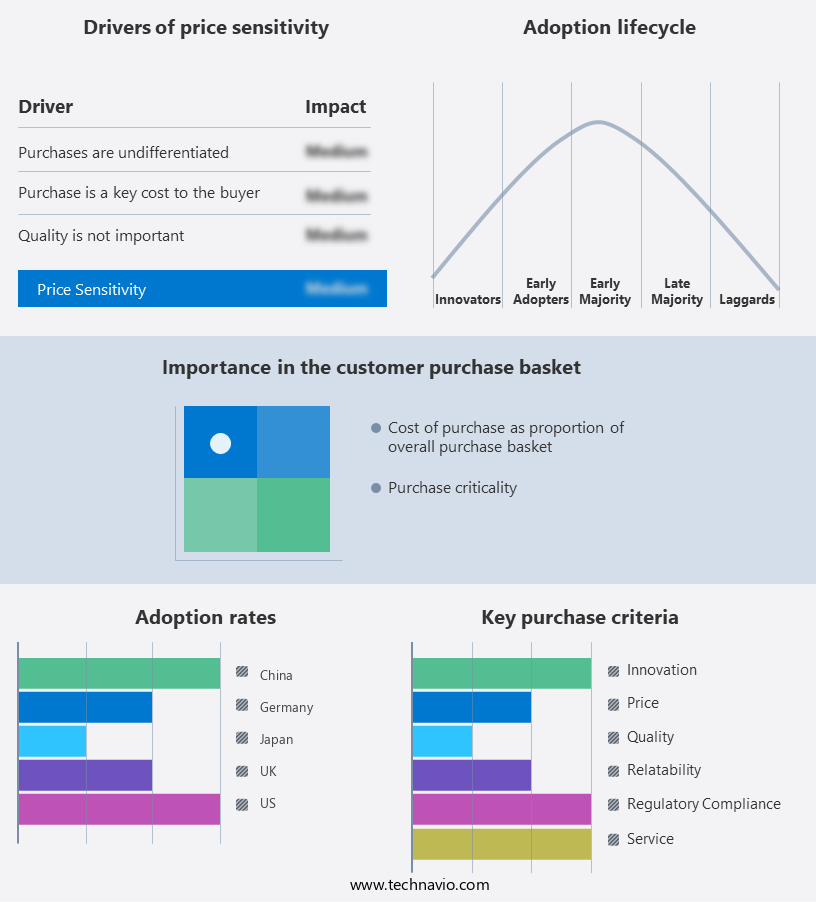
Customer Landscape of Platinum Industry
Competitive Landscape
Companies are implementing various strategies, such as strategic alliances, platinum market forecast, partnerships, mergers and acquisitions, geographical expansion, and product/service launches, to enhance their presence in the industry.
African Rainbow Minerals Ltd. - The company provides premium offerings including Modikwa, Two Rivers, and Nkomati, delivering top-tier services to clients in various industries.
The industry research and growth report includes detailed analyses of the competitive landscape of the market and information about key companies, including:
- African Rainbow Minerals Ltd.
- Anglo American South Africa Investments Proprietary Ltd.
- Asahi Group Holdings Ltd.
- Chimet Spa
- Eastern Platinum Ltd.
- Emerald Jewel Industry India Ltd.
- Eurasia Mining PLC
- Glencore Plc
- Heesung PMTech Corp.
- Heraeus Holding GmbH
- Hindustan Platinum Pvt. Ltd.
- Impala Platinum Holdings Ltd.
- Indian Platinum Pvt. Ltd.
- Johnson Matthey Plc
- Nihon Material Co.Ltd.
- Northam Platinum Ltd.
- PJSC MMC Norilsk Nickel
- Platinum Industries Pvt. Ltd
- Sibanye Stillwater Ltd.
- Vale SA
Qualitative and quantitative analysis of companies has been conducted to help clients understand the wider business environment as well as the strengths and weaknesses of key industry players. Data is qualitatively analyzed to categorize companies as pure play, category-focused, industry-focused, and diversified; it is quantitatively analyzed to categorize companies as dominant, leading, strong, tentative, and weak.
Recent Development and News in Platinum Market
- In January 2024, Anglo American Platinum, the world's largest primary platinum producer, announced the launch of its innovative Green Platinum project in South Africa. This initiative aimed to reduce the carbon footprint of platinum production by 15% through the implementation of renewable energy sources and energy-efficient technologies (Anglo American Platinum press release).
- In March 2024, Nippon Steel Corporation, the leading Japanese steel manufacturer, and South Africa's Sibanye-Stillwater, a major precious metals producer, formed a strategic partnership to jointly develop a platinum group metals (PGM) smelting and refining complex in South Africa. This collaboration aimed to secure a stable supply of PGMs for Nippon Steel's automotive business (Nippon Steel Corporation press release).
- In July 2024, Sibanye-Stillwater completed the acquisition of Lonmin Plc, a significant platinum miner in South Africa, for approximately USD 2.2 billion. This acquisition strengthened Sibanye-Stillwater's position as the world's largest primary producer of platinum (Bloomberg).
- In May 2025, the European Union (EU) approved the European Battery Alliance's (EBA) strategic action plan for battery cell production in Europe. This initiative included the allocation of € 3 billion in funding to support the development of a competitive battery cell manufacturing industry in Europe, with a focus on using recycled platinum and other critical raw materials (European Commission press release).
Dive into Technavio's robust research methodology, blending expert interviews, extensive data synthesis, and validated models for unparalleled Platinum Market insights. See full methodology.
|
Market Scope |
|
|
Report Coverage |
Details |
|
Page number |
219 |
|
Base year |
2024 |
|
Historic period |
2019-2023 |
|
Forecast period |
2025-2029 |
|
Growth momentum & CAGR |
Accelerate at a CAGR of 4.5% |
|
Market growth 2025-2029 |
USD 1883.3 million |
|
Market structure |
Fragmented |
|
YoY growth 2024-2025(%) |
4.2 |
|
Key countries |
China, US, Japan, India, South Korea, Germany, UK, Australia, France, and Canada |
|
Competitive landscape |
Leading Companies, Market Positioning of Companies, Competitive Strategies, and Industry Risks |
Research Analyst Overview
- The market encompasses a diverse range of applications, with a significant focus on the agricultural sector. One of the most promising areas of research is the use of platinum in enhancing the productivity and sustainability of crops. Platinum extracts derived from seaweed have emerged as a potential game-changer, offering benefits such as carbon sequestration, abiotic stress mitigation, and improved nutrient uptake efficiency. Platinum's role in plant hormone modulation is another area of intense interest. By optimizing plant growth regulators, platinum can help improve crop resilience factors, enabling farmers to better cope with environmental stressors. Moreover, platinum-based solutions can enhance fertilizer use efficiency, ensuring that nutrients are effectively delivered to plants while minimizing waste.
- Humic acid-based platinum products have gained traction due to their ability to increase potassium availability and organic matter content in soil. This, in turn, leads to enhanced nutrient delivery and improved water use efficiency. Platinum's influence on soil microbial diversity is another key factor, as it can stimulate soil enzyme activity and promote the growth of beneficial microorganisms. Precision agriculture technology plays a crucial role in maximizing the benefits of platinum in agriculture. By employing advanced techniques, farmers can optimize platinum application, ensuring that it is used effectively during critical crop development stages such as seed germination, floral initiation, and fruit development.
- Platinum's impact on crop quality attributes extends beyond yield improvement metrics. It can also help enhance root development, improve crop resistance to biotic stress, and stimulate photosynthesis. Furthermore, platinum's role in phosphorus solubilization and plant biomass accumulation can lead to significant reductions in greenhouse gas emissions, making it an essential component of sustainable agriculture practices. In summary, the market is undergoing continuous evolution, with a growing focus on its application in agriculture. From enhancing nutrient uptake efficiency and improving crop resilience to promoting sustainable farming practices and reducing greenhouse gas emissions, platinum's role in agriculture is set to become increasingly significant.
What are the Key Data Covered in this Platinum Market Research and Growth Report?
-
What is the expected growth of the Platinum Market between 2025 and 2029?
-
USD 1.88 billion, at a CAGR of 4.5%
-
-
What segmentation does the market report cover?
-
The report is segmented by End-user (Automotive, Jewelry, Industrial, and Investment), Source (Primary and Secondary), Form Factor (Platinum bars and Platinum coins), and Geography (APAC, Europe, North America, South America, and Middle East and Africa)
-
-
Which regions are analyzed in the report?
-
APAC, Europe, North America, South America, and Middle East and Africa
-
-
What are the key growth drivers and market challenges?
-
Growing demand for platinum in various industries, Energy intensive processing of platinum
-
-
Who are the major players in the Platinum Market?
-
African Rainbow Minerals Ltd., Anglo American South Africa Investments Proprietary Ltd., Asahi Group Holdings Ltd., Chimet Spa, Eastern Platinum Ltd., Emerald Jewel Industry India Ltd., Eurasia Mining PLC, Glencore Plc, Heesung PMTech Corp., Heraeus Holding GmbH, Hindustan Platinum Pvt. Ltd., Impala Platinum Holdings Ltd., Indian Platinum Pvt. Ltd., Johnson Matthey Plc, Nihon Material Co.Ltd., Northam Platinum Ltd., PJSC MMC Norilsk Nickel, Platinum Industries Pvt. Ltd, Sibanye Stillwater Ltd., and Vale SA
-
Market Research Insights
- The market plays a significant role in nutrient cycling processes within integrated nutrient management systems, enhancing agricultural productivity gains through precision farming techniques. Platinum, a noble metal, is increasingly utilized due to its economic viability factors. For instance, its catalytic properties contribute to improved land productivity by optimizing resource use in fertilizer production and reducing the need for mineral nutrient balancing through soil amendment strategies. Moreover, platinum's integration into farm management practices facilitates water conservation methods, enabling farmers to maintain mineral nutrient balance while minimizing the use of reduced fertilizer inputs. Platinum's application in organic fertilizer options and soil fertility improvement further bolsters its importance in sustainable farming systems.
- By enhancing plant growth characteristics, platinum contributes to crop production optimization and climate change adaptation. Two notable examples of platinum's impact on agriculture are the reduction of nitrogen oxides during ammonia production by approximately 95%, and the improvement of crop-specific applications, which can increase yield by up to 20%. These advancements underscore the market's continuous evolution and the significant role platinum plays in sustainable agricultural practices.
We can help! Our analysts can customize this platinum market research report to meet your requirements.
 RIA -
RIA - 
