Pharmaceutical Continuous Manufacturing Market Analysis North America, Europe, Asia, Rest of World (ROW) - US, Germany, UK, China, Japan - Size and Forecast 2024-2028

Pharmaceutical Continuous Manufacturing Market Analysis North America, Europe, Asia, Rest of World (ROW) - US, Germany, UK, China, Japan - Size and Forecast 2024-2028

Published: Nov 2023 171 Pages SKU: IRTNTR76800

Market Overview at a Glance

$548.94 Mn
Market Opportunity
12.74%
CAGR
12.26
YoY growth 2023-2024(%)

Pharmaceutical Continuous Manufacturing Market Size 2024-2028 

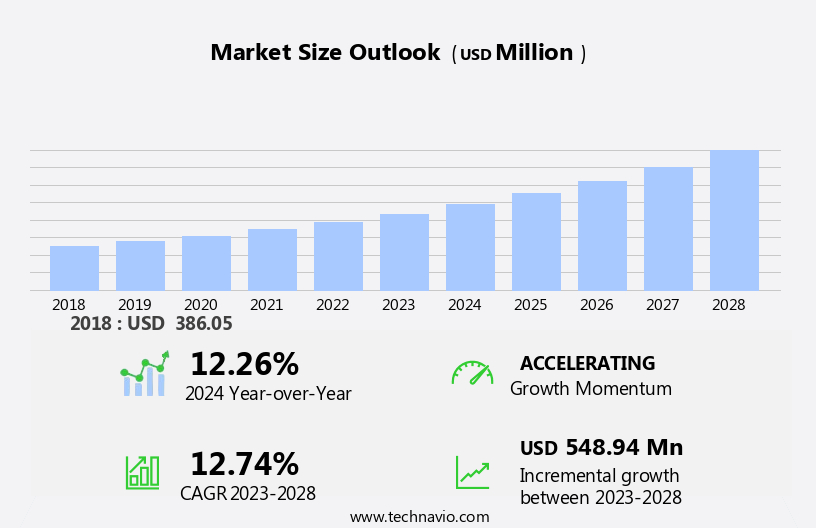
The pharmaceutical continuous manufacturing market size is forecast to increase by USD 548.94 million at a CAGR of 12.74% between 2023 and 2028. The pharmaceutical industry, like many others, is increasingly focused on sustainability, recognizing its importance in reducing environmental impacts, conserving resources, and meeting corporate responsibility goals. Sustainability initiatives include minimizing waste, reducing energy consumption, and implementing environmentally friendly production methods. Moreover, the integration of technologies like Artificial Intelligence (AI) and Machine Learning (ML) in continuous manufacturing However, continuous manufacturing methods not only enhance efficiency and product quality but also significantly reduce the environmental impact of pharmaceutical production. As the industry continues to prioritize sustainability, the global market for continuous manufacturing is expected to grow substantially during the forecast period.

Pharmaceutical Continuous Manufacturing Market Size

 Request Free Sample

The market is witnessing significant growth in various sectors, including tablets, capsules, coatings, and dosage forms. This manufacturing approach offers several advantages, such as increased productivity, improved product quality, and reduced production costs. The use of advanced technologies like Syntem and Caterpillar's Continuous Manufacturing Cell (CMC) is driving the market forward. The tablets segment is expected to dominate the market due to the high demand for oral solid dosage forms. The capsules segment is also gaining popularity due to their advantages over tablets, such as better bioavailability and patient compliance.

Consequently, coatings, another significant application area, are essential for improving the efficacy and stability of pharmaceutical products. The global market for Pharmaceutical Continuous Manufacturing is projected to grow at a steady pace, with key players focusing on innovation and collaboration to expand their offerings. The market is expected to face challenges such as regulatory compliance and high initial investment costs. However, the benefits of continuous manufacturing are expected to outweigh these challenges, making it a promising trend in the pharmaceutical industry. 

Market Segmentation

The market research report provides comprehensive data (region-wise segment analysis), with forecasts and estimates in "USD million" for the period 2024-2028, as well as historical data from 2018-2022 for the following segments.
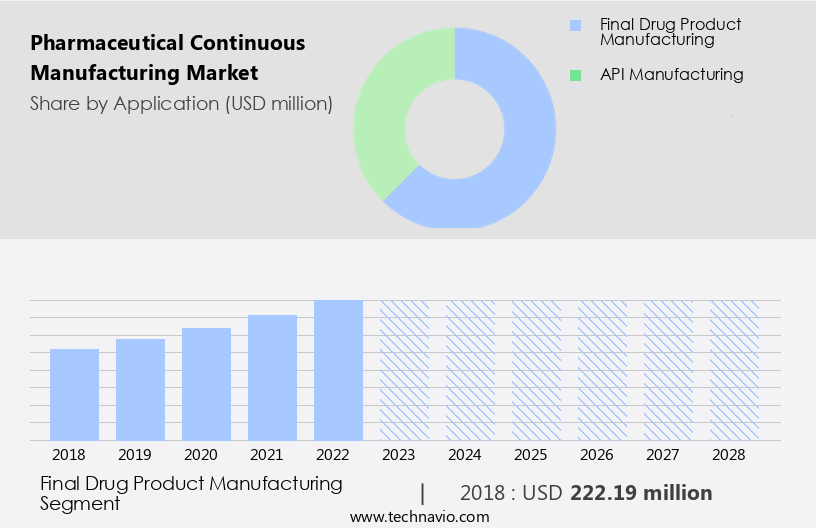
  • Application
    • Final drug product manufacturing
    • API manufacturing
  • Product
    • Integrated systems
    • Semi-continuous systems
    • Controls or software
  • Geography
    • North America
      • US
    • Europe
      • Germany
      • UK
    • Asia
      • China
      • Japan
    • Rest of World (ROW)

By Application Insights

The final drug product manufacturing segment is estimated to witness significant growth during the forecast period. Continuous manufacturing streamlines the production process by integrating Upstream Bioprocessing and Downstream Bioprocessing, reducing timelines and increasing productivity. It ensures better control over critical process parameters, leading to improved product consistency and quality. Essential medicines, including small molecule drugs and their APIs, can be produced more efficiently and cost-effectively using this method. Continuous manufacturing minimizes variability and reduces the risk of defects, ensuring regulatory compliance. Operating costs are also reduced through labor savings, equipment maintenance, and energy consumption.

Pharmaceutical Continuous Manufacturing Market Size

Get a glance at the market share of various segments Request Free Sample

The final drug product manufacturing segment was valued at USD 222.19 million in 2018 and showed a gradual increase during the forecast period.

Regional Insights

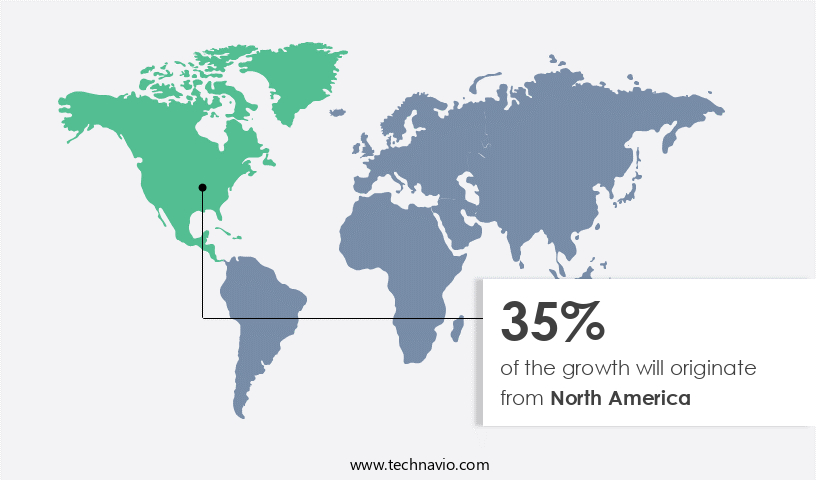
North America is estimated to contribute 35% to the growth of the global market during the forecast period. Technavio's analysts have elaborately explained the regional trends and drivers that shape the market during the forecast period.

Pharmaceutical Continuous Manufacturing Market Share by Geography

For more insights on the market share of various regions Request Free Sample

The Pharmaceuticals industry in North America utilizes continuous manufacturing to address drug shortages and patient demands for high-quality, affordable medicines. Technologies such as semi-continuous systems, continuous granulators, blenders, compressors, coaters, and dryers streamline the production of sterile injectables, oncology treatments, and biologics. Integrated continuous systems, including tablet and granulation processes, offer real-time monitoring, quality control, and material waste reduction. Untapped emerging markets and integrated process control enhance the production of pharmaceutical drug substances from raw materials to finished products, ensuring drug quality through active ingredient management and staff training. Other semi-continuous systems support solid and liquid dosage manufacturing.

Our researchers analyzed the data with 2023 as the base year, along with the key drivers, trends, and challenges. A holistic analysis of drivers will help companies refine their marketing strategies to gain a competitive advantage.

Market Driver

The increasing prevalence of chronic diseases is the key driver of the market. The market is driven by the increasing production of small molecule drugs and Active Pharmaceutical Ingredients (APIs) in emerging economies. With preclinical and clinical trials leading to the approval of new drugs, the demand for finished dosage forms is surging.

Further, this trend is particularly noticeable in countries like India and China, where urbanization and rising disposable incomes are fueling pharmaceutical industry growth. To meet this demand, manufacturers are expanding their production capacity for essential medicines, focusing on both upstream bioprocessing and downstream bioprocessing. This growth is anticipated to continue during the forecast period.

Market Trends

The growing digitalization and integration of Industry 4.0 in continuous manufacturing is the upcoming trend in the market. The trend towards lightweighting in the automotive industry is mirrored in the pharmaceutical sector with the continuous manufacturing market for small molecule drugs. The use of lighter materials, such as titanium and advanced alloys, in the production of Active Pharmaceutical Ingredients (APIs) and Finished Dosage Forms (FDFs) is encouraged.

Further, this approach reduces the overall weight of pharmaceutical products without compromising performance, contributing to improved fuel efficiency and reduced emissions, similar to the automotive industry. Upstream bioprocessing and downstream bioprocessing are being optimized through the development of novel designs, utilizing lightweight materials to enhance endurance and performance. This focus on lightweighting aligns with the broader pharmaceutical industry goals of sustainability and enhanced performance, driving the growth of continuous manufacturing technology for essential medicines and small molecule drugs.

Market Challenge

The regulatory complexity in the pharmaceutical industry is a key challenge affecting the market growth. In the pharmaceutical industry, the production of small molecule drugs and active pharmaceutical ingredients (APIs) for finished dosage forms must adhere to stringent environmental regulations. The upstream bioprocessing and downstream processing of pharmaceutical ingredients, including essential medicines, are subject to scrutiny during preclinical and clinical stages. Traditional manufacturing methods may be reevaluated due to their energy-intensive nature and potential toxic emissions.

However, to minimize the carbon footprint, pharmaceutical companies are investigating alternative materials and processes, such as continuous manufacturing and the use of lightweight metals or composites in the production of APIs. Waste management is also a critical concern, as abandoned materials and byproducts must be disposed of properly. Sustainable manufacturing practices, including recycling and minimizing toxic emissions, are essential for meeting regulatory requirements and consumer expectations in the market.

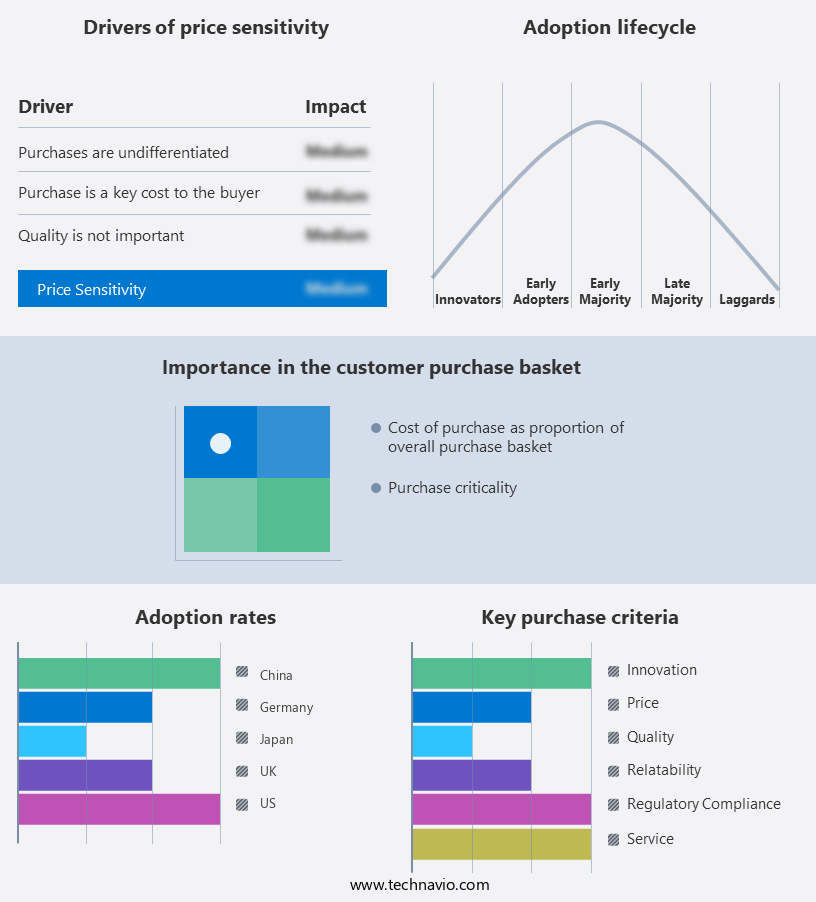
Exclusive Customer Landscape

The market forecasting report includes the adoption lifecycle of the market, covering from the innovator's stage to the laggard's stage. It focuses on adoption rates in different regions based on penetration. Furthermore, the report also includes key purchase criteria and drivers of price sensitivity to help companies evaluate and develop their market growth analysis strategies.

Pharmaceutical Continuous Manufacturing Market Share by Geography

 Customer Landscape

Key Companies & Market Insights

Companies are implementing various strategies, such as strategic alliances, partnerships, mergers and acquisitions, geographical expansion, and product/service launches, to enhance their presence in the market.

Coperion GmbHThe company offers products such as pharma extruders, and process equipment.

The market research and growth report includes detailed analyses of the competitive landscape of the market and information about key companies, including:

  • Chemtrix BV
  • Continuus Pharmaceuticals
  • Corning Inc.
  • Dr. Helmut Rothenberger Holding GmbH
  • Eli Lilly and Co.
  • Freund Vector Corp.
  • GE Healthcare Technologies Inc.
  • GEA Group AG
  • Gebruder Lodige Maschinenbau GmbH
  • Gericke AG
  • Honeywell International Inc.
  • Hosokawa Micron Corp.
  • Hovione
  • KORSCH AG
  • L.B. Bohle Maschinen und Verfahren GmbH
  • LMT Group
  • Novartis AG
  • Pfizer Inc.
  • Siemens AG
  • SK Inc.
  • Syntegon Technology GmbH
  • Thermo Fisher Scientific Inc.

Qualitative and quantitative analysis of companies has been conducted to help clients understand the wider business environment as well as the strengths and weaknesses of key market players. Data is qualitatively analyzed to categorize companies as pure play, category-focused, industry-focused, and diversified; it is quantitatively analyzed to categorize companies as dominant, leading, strong, tentative, and weak.

Research Analyst Overview

The market is experiencing significant growth due to the increasing demand for efficient and cost-effective production methods in the industry. Systems and technologies, such as Patents, Drugs, Shortages, Syntheses, Compressors, Oncology, Quality, Unprocessed, Producers, and Solids, play a crucial role in this market. Continuous manufacturing in pharmaceuticals involves the production of drugs without interruption, allowing for real-time monitoring and adjustment of the process. The Pharmaceutical Continuous Manufacturing Market is gaining significant traction due to its potential to address critical issues in the healthcare sector, including drug shortages and the production of essential medicines and drugs, particularly in areas like oncology and cancer treatments. Continuous manufacturing, which includes processes such as continuous blenders, compressors, coaters, and dryers, offers several advantages over traditional batch manufacturing methods. Continuous manufacturing streamlines the production of active pharmaceutical ingredients (APIs) and base ingredients, ensuring a consistent supply of molecules and biologics for health systems and patients. This integrated continuous system is particularly beneficial for sterile injectable medications, where manual handling is minimized, reducing the risk of contamination.

The pharmaceutical industry is increasingly adopting continuous manufacturing for solid dosage manufacturing, including tablet production and coating processes. Quality monitoring is ensured through real-time analysis, ensuring the production of finished dosage forms that meet regulatory requirements. The Drug Shortage Task Force has identified continuous manufacturing as a potential solution to address drug shortages, particularly for essential medicines. Continuous manufacturing systems, including semicontinuous systems, offer the flexibility to produce multiple products, reducing the risk of production downtime and ensuring a consistent supply of APIs and finished dosage forms. In the preclinical and clinical stages of drug development, continuous manufacturing can help streamline the production of drug molecules and APIs, reducing development timelines and costs. Overall, the Pharmaceutical Continuous Manufacturing Market is poised for significant growth, offering numerous benefits to the healthcare sector and patients.

In conclusion, this results in improved product quality, increased efficiency, and reduced costs. The processes further enhances their capabilities. These technologies enable predictive maintenance, real-time process optimization, and improved yield. The market for Pharmaceutical Continuous Manufacturing is expected to grow at a steady pace in the coming years, driven by the increasing adoption of these advanced technologies and the need for more efficient and cost-effective production methods in the industry.

Market Scope

Report Coverage

Details

Page number

171

Base year

2023

Historic period

2018-2022

Forecast period

2024-2028

Growth momentum & CAGR

Accelerate at a CAGR of 12.74%

Market growth 2024-2028

USD 548.94 million

Market structure

Fragmented

YoY growth 2023-2024(%)

12.26

Regional analysis

North America, Europe, Asia, and Rest of World (ROW)

Performing market contribution

North America at 35%

Key countries

US, Germany, UK, China, and Japan

Competitive landscape

Leading Companies, Market Positioning of Companies, Competitive Strategies, and Industry Risks

Key companies profiled

Chemtrix BV, Continuus Pharmaceuticals, Coperion GmbH, Corning Inc., Dr. Helmut Rothenberger Holding GmbH, Eli Lilly and Co., Freund Vector Corp., GE Healthcare Technologies Inc., GEA Group AG, Gebruder Lodige Maschinenbau GmbH, Gericke AG, Honeywell International Inc., Hosokawa Micron Corp., Hovione, KORSCH AG, L.B. Bohle Maschinen und Verfahren GmbH, LMT Group, Novartis AG, Pfizer Inc., Siemens AG, SK Inc., Syntegon Technology GmbH, and Thermo Fisher Scientific Inc.

Market dynamics

Parent market analysis, market growth inducers and obstacles, market forecast, fast-growing and slow-growing segment analysis, COVID-19 impact and recovery analysis and future consumer dynamics, market condition analysis for the forecast period

Customization purview

If our market report has not included the data that you are looking for, you can reach out to our analysts and get segments customized.

Request Free Sample

What are the Key Data Covered in this Market Research and Growth Report?

  • CAGR of the market during the forecast period
  • Detailed information on factors that will drive the market growth and forecasting between 2024 and 2028
  • Precise estimation of the size of the market  and its contribution of the market in focus to the parent market
  • Accurate predictions about upcoming market growth and trends and changes in consumer behaviour
  • Growth of the market across North America, Europe, Asia, and Rest of World (ROW)
  • Thorough analysis of the market's competitive landscape and detailed information about companies
  • Comprehensive analysis of factors that will challenge the growth of market companies

We can help! Our analysts can customize this market research report to meet your requirements. Get in touch

1 Executive Summary

  • 1.1 Market overview
    • Exhibit 01: Executive Summary – Chart on Market Overview
    • Exhibit 02: Executive Summary – Data Table on Market Overview
    • Exhibit 03: Executive Summary – Chart on Global Market Characteristics
    • Exhibit 04: Executive Summary – Chart on Market by Geography
    • Exhibit 05: Executive Summary – Chart on Market Segmentation by Application
    • Exhibit 06: Executive Summary – Chart on Market Segmentation by Product
    • Exhibit 07: Executive Summary – Chart on Incremental Growth
    • Exhibit 08: Executive Summary – Data Table on Incremental Growth
    • Exhibit 09: Executive Summary – Chart on Vendor Market Positioning

2 Market Landscape

  • 2.1 Market ecosystem
    • Exhibit 10: Parent market
    • Exhibit 11: Market Characteristics

3 Market Sizing

  • 3.1 Market definition
    • Exhibit 12: Offerings of vendors included in the market definition
  • 3.2 Market segment analysis
    • Exhibit 13: Market segments
  • 3.3 Market size 2023
    • 3.4 Market outlook: Forecast for 2023-2028
      • Exhibit 14: Chart on Global - Market size and forecast 2023-2028 ($ million)
      • Exhibit 15: Data Table on Global - Market size and forecast 2023-2028 ($ million)
      • Exhibit 16: Chart on Global Market: Year-over-year growth 2023-2028 (%)
      • Exhibit 17: Data Table on Global Market: Year-over-year growth 2023-2028 (%)

    4 Historic Market Size

    • 4.1 Global pharmaceutical continuous manufacturing market 2018 - 2022
      • Exhibit 18: Historic Market Size – Data Table on global pharmaceutical continuous manufacturing market 2018 - 2022 ($ million)
    • 4.2 Application Segment Analysis 2018 - 2022
      • Exhibit 19: Historic Market Size – Application Segment 2018 - 2022 ($ million)
    • 4.3 Product Segment Analysis 2018 - 2022
      • Exhibit 20: Historic Market Size – Product Segment 2018 - 2022 ($ million)
    • 4.4 Geography Segment Analysis 2018 - 2022
      • Exhibit 21: Historic Market Size – Geography Segment 2018 - 2022 ($ million)
    • 4.5 Country Segment Analysis 2018 - 2022
      • Exhibit 22: Historic Market Size – Country Segment 2018 - 2022 ($ million)

    5 Five Forces Analysis

    • 5.1 Five forces summary
      • Exhibit 23: Five forces analysis - Comparison between 2023 and 2028
    • 5.2 Bargaining power of buyers
      • Exhibit 24: Chart on Bargaining power of buyers – Impact of key factors 2023 and 2028
    • 5.3 Bargaining power of suppliers
      • Exhibit 25: Bargaining power of suppliers – Impact of key factors in 2023 and 2028
    • 5.4 Threat of new entrants
      • Exhibit 26: Threat of new entrants – Impact of key factors in 2023 and 2028
    • 5.5 Threat of substitutes
      • Exhibit 27: Threat of substitutes – Impact of key factors in 2023 and 2028
    • 5.6 Threat of rivalry
      • Exhibit 28: Threat of rivalry – Impact of key factors in 2023 and 2028
    • 5.7 Market condition
      • Exhibit 29: Chart on Market condition - Five forces 2023 and 2028

    6 Market Segmentation by Application

    • 6.1 Market segments
      • Exhibit 30: Chart on Application - Market share 2023-2028 (%)
      • Exhibit 31: Data Table on Application - Market share 2023-2028 (%)
    • 6.2 Comparison by Application
      • Exhibit 32: Chart on Comparison by Application
      • Exhibit 33: Data Table on Comparison by Application
    • 6.3 Final drug product manufacturing - Market size and forecast 2023-2028
      • Exhibit 34: Chart on Final drug product manufacturing - Market size and forecast 2023-2028 ($ million)
      • Exhibit 35: Data Table on Final drug product manufacturing - Market size and forecast 2023-2028 ($ million)
      • Exhibit 36: Chart on Final drug product manufacturing - Year-over-year growth 2023-2028 (%)
      • Exhibit 37: Data Table on Final drug product manufacturing - Year-over-year growth 2023-2028 (%)
    • 6.4 API manufacturing - Market size and forecast 2023-2028
      • Exhibit 38: Chart on API manufacturing - Market size and forecast 2023-2028 ($ million)
      • Exhibit 39: Data Table on API manufacturing - Market size and forecast 2023-2028 ($ million)
      • Exhibit 40: Chart on API manufacturing - Year-over-year growth 2023-2028 (%)
      • Exhibit 41: Data Table on API manufacturing - Year-over-year growth 2023-2028 (%)
    • 6.5 Market opportunity by Application
      • Exhibit 42: Market opportunity by Application ($ million)
      • Exhibit 43: Data Table on Market opportunity by Application ($ million)

    7 Market Segmentation by Product

    • 7.1 Market segments
      • Exhibit 44: Chart on Product - Market share 2023-2028 (%)
      • Exhibit 45: Data Table on Product - Market share 2023-2028 (%)
    • 7.2 Comparison by Product
      • Exhibit 46: Chart on Comparison by Product
      • Exhibit 47: Data Table on Comparison by Product
    • 7.3 Integrated systems - Market size and forecast 2023-2028
      • Exhibit 48: Chart on Integrated systems - Market size and forecast 2023-2028 ($ million)
      • Exhibit 49: Data Table on Integrated systems - Market size and forecast 2023-2028 ($ million)
      • Exhibit 50: Chart on Integrated systems - Year-over-year growth 2023-2028 (%)
      • Exhibit 51: Data Table on Integrated systems - Year-over-year growth 2023-2028 (%)
    • 7.4 Semi-continuous systems - Market size and forecast 2023-2028
      • Exhibit 52: Chart on Semi-continuous systems - Market size and forecast 2023-2028 ($ million)
      • Exhibit 53: Data Table on Semi-continuous systems - Market size and forecast 2023-2028 ($ million)
      • Exhibit 54: Chart on Semi-continuous systems - Year-over-year growth 2023-2028 (%)
      • Exhibit 55: Data Table on Semi-continuous systems - Year-over-year growth 2023-2028 (%)
    • 7.5 Controls or software - Market size and forecast 2023-2028
      • Exhibit 56: Chart on Controls or software - Market size and forecast 2023-2028 ($ million)
      • Exhibit 57: Data Table on Controls or software - Market size and forecast 2023-2028 ($ million)
      • Exhibit 58: Chart on Controls or software - Year-over-year growth 2023-2028 (%)
      • Exhibit 59: Data Table on Controls or software - Year-over-year growth 2023-2028 (%)
    • 7.6 Market opportunity by Product
      • Exhibit 60: Market opportunity by Product ($ million)
      • Exhibit 61: Data Table on Market opportunity by Product ($ million)

    8 Customer Landscape

    • 8.1 Customer landscape overview
      • Exhibit 62: Analysis of price sensitivity, lifecycle, customer purchase basket, adoption rates, and purchase criteria

    9 Geographic Landscape

    • 9.1 Geographic segmentation
      • Exhibit 63: Chart on Market share by geography 2023-2028 (%)
      • Exhibit 64: Data Table on Market share by geography 2023-2028 (%)
    • 9.2 Geographic comparison
      • Exhibit 65: Chart on Geographic comparison
      • Exhibit 66: Data Table on Geographic comparison
    • 9.3 North America - Market size and forecast 2023-2028
      • Exhibit 67: Chart on North America - Market size and forecast 2023-2028 ($ million)
      • Exhibit 68: Data Table on North America - Market size and forecast 2023-2028 ($ million)
      • Exhibit 69: Chart on North America - Year-over-year growth 2023-2028 (%)
      • Exhibit 70: Data Table on North America - Year-over-year growth 2023-2028 (%)
    • 9.4 Europe - Market size and forecast 2023-2028
      • Exhibit 71: Chart on Europe - Market size and forecast 2023-2028 ($ million)
      • Exhibit 72: Data Table on Europe - Market size and forecast 2023-2028 ($ million)
      • Exhibit 73: Chart on Europe - Year-over-year growth 2023-2028 (%)
      • Exhibit 74: Data Table on Europe - Year-over-year growth 2023-2028 (%)
    • 9.5 Asia - Market size and forecast 2023-2028
      • Exhibit 75: Chart on Asia - Market size and forecast 2023-2028 ($ million)
      • Exhibit 76: Data Table on Asia - Market size and forecast 2023-2028 ($ million)
      • Exhibit 77: Chart on Asia - Year-over-year growth 2023-2028 (%)
      • Exhibit 78: Data Table on Asia - Year-over-year growth 2023-2028 (%)
    • 9.6 Rest of World (ROW) - Market size and forecast 2023-2028
      • Exhibit 79: Chart on Rest of World (ROW) - Market size and forecast 2023-2028 ($ million)
      • Exhibit 80: Data Table on Rest of World (ROW) - Market size and forecast 2023-2028 ($ million)
      • Exhibit 81: Chart on Rest of World (ROW) - Year-over-year growth 2023-2028 (%)
      • Exhibit 82: Data Table on Rest of World (ROW) - Year-over-year growth 2023-2028 (%)
    • 9.7 US - Market size and forecast 2023-2028
      • Exhibit 83: Chart on US - Market size and forecast 2023-2028 ($ million)
      • Exhibit 84: Data Table on US - Market size and forecast 2023-2028 ($ million)
      • Exhibit 85: Chart on US - Year-over-year growth 2023-2028 (%)
      • Exhibit 86: Data Table on US - Year-over-year growth 2023-2028 (%)
    • 9.8 Germany - Market size and forecast 2023-2028
      • Exhibit 87: Chart on Germany - Market size and forecast 2023-2028 ($ million)
      • Exhibit 88: Data Table on Germany - Market size and forecast 2023-2028 ($ million)
      • Exhibit 89: Chart on Germany - Year-over-year growth 2023-2028 (%)
      • Exhibit 90: Data Table on Germany - Year-over-year growth 2023-2028 (%)
    • 9.9 China - Market size and forecast 2023-2028
      • Exhibit 91: Chart on China - Market size and forecast 2023-2028 ($ million)
      • Exhibit 92: Data Table on China - Market size and forecast 2023-2028 ($ million)
      • Exhibit 93: Chart on China - Year-over-year growth 2023-2028 (%)
      • Exhibit 94: Data Table on China - Year-over-year growth 2023-2028 (%)
    • 9.10 UK - Market size and forecast 2023-2028
      • Exhibit 95: Chart on UK - Market size and forecast 2023-2028 ($ million)
      • Exhibit 96: Data Table on UK - Market size and forecast 2023-2028 ($ million)
      • Exhibit 97: Chart on UK - Year-over-year growth 2023-2028 (%)
      • Exhibit 98: Data Table on UK - Year-over-year growth 2023-2028 (%)
    • 9.11 Japan - Market size and forecast 2023-2028
      • Exhibit 99: Chart on Japan - Market size and forecast 2023-2028 ($ million)
      • Exhibit 100: Data Table on Japan - Market size and forecast 2023-2028 ($ million)
      • Exhibit 101: Chart on Japan - Year-over-year growth 2023-2028 (%)
      • Exhibit 102: Data Table on Japan - Year-over-year growth 2023-2028 (%)
    • 9.12 Market opportunity by geography
      • Exhibit 103: Market opportunity by geography ($ million)
      • Exhibit 104: Data Tables on Market opportunity by geography ($ million)

    10 Drivers, Challenges, and Trends

    • 10.1 Market drivers
      • 10.2 Market challenges
        • 10.3 Impact of drivers and challenges
          • Exhibit 105: Impact of drivers and challenges in 2023 and 2028
        • 10.4 Market trends

          11 Vendor Landscape

          • 11.1 Overview
            • 11.2 Vendor landscape
              • Exhibit 106: Overview on Criticality of inputs and Factors of differentiation
            • 11.3 Landscape disruption
              • Exhibit 107: Overview on factors of disruption
            • 11.4 Industry risks
              • Exhibit 108: Impact of key risks on business

            12 Vendor Analysis

            • 12.1 Vendors covered
              • Exhibit 109: Vendors covered
            • 12.2 Market positioning of vendors
              • Exhibit 110: Matrix on vendor position and classification
            • 12.3 Coperion GmbH
              • Exhibit 111: Coperion GmbH - Overview
              • Exhibit 112: Coperion GmbH - Product / Service
              • Exhibit 113: Coperion GmbH - Key offerings
            • 12.4 Corning Inc.
              • Exhibit 114: Corning Inc. - Overview
              • Exhibit 115: Corning Inc. - Business segments
              • Exhibit 116: Corning Inc. - Key news
              • Exhibit 117: Corning Inc. - Key offerings
              • Exhibit 118: Corning Inc. - Segment focus
            • 12.5 Eli Lilly and Co.
              • Exhibit 119: Eli Lilly and Co. - Overview
              • Exhibit 120: Eli Lilly and Co. - Product / Service
              • Exhibit 121: Eli Lilly and Co. - Key news
              • Exhibit 122: Eli Lilly and Co. - Key offerings
            • 12.6 GE Healthcare Technologies Inc.
              • Exhibit 123: GE Healthcare Technologies Inc. - Overview
              • Exhibit 124: GE Healthcare Technologies Inc. - Business segments
              • Exhibit 125: GE Healthcare Technologies Inc. - Key offerings
              • Exhibit 126: GE Healthcare Technologies Inc. - Segment focus
            • 12.7 GEA Group AG
              • Exhibit 127: GEA Group AG - Overview
              • Exhibit 128: GEA Group AG - Business segments
              • Exhibit 129: GEA Group AG - Key offerings
              • Exhibit 130: GEA Group AG - Segment focus
            • 12.8 Gebruder Lodige Maschinenbau GmbH
              • Exhibit 131: Gebruder Lodige Maschinenbau GmbH - Overview
              • Exhibit 132: Gebruder Lodige Maschinenbau GmbH - Product / Service
              • Exhibit 133: Gebruder Lodige Maschinenbau GmbH - Key offerings
            • 12.9 Honeywell International Inc.
              • Exhibit 134: Honeywell International Inc. - Overview
              • Exhibit 135: Honeywell International Inc. - Business segments
              • Exhibit 136: Honeywell International Inc. - Key news
              • Exhibit 137: Honeywell International Inc. - Key offerings
              • Exhibit 138: Honeywell International Inc. - Segment focus
            • 12.10 Hosokawa Micron Corp.
              • Exhibit 139: Hosokawa Micron Corp. - Overview
              • Exhibit 140: Hosokawa Micron Corp. - Business segments
              • Exhibit 141: Hosokawa Micron Corp. - Key offerings
              • Exhibit 142: Hosokawa Micron Corp. - Segment focus
            • 12.11 L.B. Bohle Maschinen und Verfahren GmbH
              • Exhibit 143: L.B. Bohle Maschinen und Verfahren GmbH - Overview
              • Exhibit 144: L.B. Bohle Maschinen und Verfahren GmbH - Product / Service
              • Exhibit 145: L.B. Bohle Maschinen und Verfahren GmbH - Key offerings
            • 12.12 Novartis AG
              • Exhibit 146: Novartis AG - Overview
              • Exhibit 147: Novartis AG - Business segments
              • Exhibit 148: Novartis AG - Key offerings
              • Exhibit 149: Novartis AG - Segment focus
            • 12.13 Pfizer Inc.
              • Exhibit 150: Pfizer Inc. - Overview
              • Exhibit 151: Pfizer Inc. - Product / Service
              • Exhibit 152: Pfizer Inc. - Key news
              • Exhibit 153: Pfizer Inc. - Key offerings
            • 12.14 Siemens AG
              • Exhibit 154: Siemens AG - Overview
              • Exhibit 155: Siemens AG - Business segments
              • Exhibit 156: Siemens AG - Key news
              • Exhibit 157: Siemens AG - Key offerings
              • Exhibit 158: Siemens AG - Segment focus
            • 12.15 SK Inc.
              • Exhibit 159: SK Inc. - Overview
              • Exhibit 160: SK Inc. - Product / Service
              • Exhibit 161: SK Inc. - Key offerings
            • 12.16 Syntegon Technology GmbH
              • Exhibit 162: Syntegon Technology GmbH - Overview
              • Exhibit 163: Syntegon Technology GmbH - Product / Service
              • Exhibit 164: Syntegon Technology GmbH - Key offerings
            • 12.17 Thermo Fisher Scientific Inc.
              • Exhibit 165: Thermo Fisher Scientific Inc. - Overview
              • Exhibit 166: Thermo Fisher Scientific Inc. - Business segments
              • Exhibit 167: Thermo Fisher Scientific Inc. - Key news
              • Exhibit 168: Thermo Fisher Scientific Inc. - Key offerings
              • Exhibit 169: Thermo Fisher Scientific Inc. - Segment focus

            13 Appendix

            • 13.1 Scope of the report
              • 13.2 Inclusions and exclusions checklist
                • Exhibit 170: Inclusions checklist
                • Exhibit 171: Exclusions checklist
              • 13.3 Currency conversion rates for US$
                • Exhibit 172: Currency conversion rates for US$
              • 13.4 Research methodology
                • Exhibit 173: Research methodology
                • Exhibit 174: Validation techniques employed for market sizing
                • Exhibit 175: Information sources
              • 13.5 List of abbreviations
                • Exhibit 176: List of abbreviations

              Research Methodology

              Technavio presents a detailed picture of the market by way of study, synthesis, and summation of data from multiple sources. The analysts have presented the various facets of the market with a particular focus on identifying the key industry influencers. The data thus presented is comprehensive, reliable, and the result of extensive research, both primary and secondary.

              INFORMATION SOURCES

              Primary sources

              • Manufacturers and suppliers
              • Channel partners
              • Industry experts
              • Strategic decision makers

              Secondary sources

              • Industry journals and periodicals
              • Government data
              • Financial reports of key industry players
              • Historical data
              • Press releases

              DATA ANALYSIS

              Data Synthesis

              • Collation of data
              • Estimation of key figures
              • Analysis of derived insights

              Data Validation

              • Triangulation with data models
              • Reference against proprietary databases
              • Corroboration with industry experts

              REPORT WRITING

              Qualitative

              • Market drivers
              • Market challenges
              • Market trends
              • Five forces analysis

              Quantitative

              • Market size and forecast
              • Market segmentation
              • Geographical insights
              • Competitive landscape

              Interested in this report?

              Get your sample now to see our research methodology and insights!

              Download Now

              Frequently Asked Questions

              Pharmaceutical Continuous Manufacturing market growth will increase by $ 548.94 mn during 2024-2028 .

              The Pharmaceutical Continuous Manufacturing market is expected to grow at a CAGR of 12.74% during 2024-2028 .

              Pharmaceutical Continuous Manufacturing market is segmented by Application( Final drug product manufacturing, API manufacturing) Product( Integrated systems, Semi-continuous systems, Controls or software)

              Chemtrix BV, Continuus Pharmaceuticals, Coperion GmbH, Corning Inc., Dr. Helmut Rothenberger Holding GmbH, Eli Lilly and Co., Freund Vector Corp., GE Healthcare Technologies Inc., GEA Group AG, Gebruder Lodige Maschinenbau GmbH, Gericke AG, Honeywell International Inc., Hosokawa Micron Corp., Hovione, KORSCH AG, L.B. Bohle Maschinen und Verfahren GmbH, LMT Group, Novartis AG, Pfizer Inc., Siemens AG, SK Inc., Syntegon Technology GmbH, Thermo Fisher Scientific Inc. are a few of the key vendors in the Pharmaceutical Continuous Manufacturing market.

              North America will register the highest growth rate of 35% among the other regions. Therefore, the Pharmaceutical Continuous Manufacturing market in North America is expected to garner significant business opportunities for the vendors during the forecast period.

              US, Germany, UK, China, Japan

              • Increasing prevalence of chronic diseasesThe global prevalence of acute and chronic diseases is the driving factor this market.
              • including cardiovascular is the driving factor this market.
              • neurological is the driving factor this market.
              • orthopedic is the driving factor this market.
              • and respiratory diseases is the driving factor this market.
              • is increasing significantly. According to Eurostat is the driving factor this market.
              • every year is the driving factor this market.
              • CVD causes 3.9 million deaths in Europe and over 1.8 million deaths in the European Union (EU) countries. CVD accounts for 45% of all deaths in Europe and 37% of all deaths in the EU.. According to the NIH is the driving factor this market.
              • more than 500 is the driving factor this market.
              • 000 people are diagnosed with heart failure every year in the US. According to the Centers for Disease Control and Prevention (CDC) is the driving factor this market.
              • every year is the driving factor this market.
              • approximately 790 is the driving factor this market.
              • 000 people in the US have a heart attack is the driving factor this market.
              • of which nearly 580 is the driving factor this market.
              • 000 are first heart attacks and 210 is the driving factor this market.
              • 000 are recurrent attacks. According to the NIH is the driving factor this market.
              • the number of people with osteoarthritis (OA) in Australia is expected to increase from around 2.2 million in 2015 to nearly 3.1 million by 2030. I. According to the NIH is the driving factor this market.
              • in 2019 is the driving factor this market.
              • more than 1.7 million hip fractures were reported across the world is the driving factor this market.
              • and the number is expected to reach approximately 6.3 million by 2050. One out of every 100 people across the world has rheumatoid arthritis is the driving factor this market.
              • and it is one of the most common chronic diseases. According to the CDC is the driving factor this market.
              • as of 2019 is the driving factor this market.
              • more than 25% of the population in the US had arthritis is the driving factor this market.
              • while approximately 60 million adults in the country are estimated to have doctor-diagnosed arthritis by 2025. Globally is the driving factor this market.
              • the incidence of several respiratory diseases is the driving factor this market.
              • such as chronic obstructive pulmonary disease (COPD) is the driving factor this market.
              • asthma is the driving factor this market.
              • and lung cancer is the driving factor this market.
              • is increasing. The prevalence of asthma is increasing rapidly in low and middle-income countries is the driving factor this market.
              • especially those in Asia. According to NIH is the driving factor this market.
              • approximately 16 million US population are currently living with COPD. According to American Lung Association is the driving factor this market.
              • 12.5 million people is the driving factor this market.
              • or 5.0% of adults is the driving factor this market.
              • reported a diagnosis of COPD in the US in 2020. The five commonly diagnosed types of cancers were lung cancer is the driving factor this market.
              • breast cancer is the driving factor this market.
              • prostate cancer is the driving factor this market.
              • colorectal cancer is the driving factor this market.
              • and stomach cancer. Such cancers accounted for approximately 49% of all diagnosed cases of cancer. Among such cancers is the driving factor this market.
              • lung cancer and breast cancer accounted for the largest number of diagnosed cases. The prevalence of various types of cancers is increasing. According to National Cancer Institute is the driving factor this market.
              • the number of cancer survivors is projected to increase by 24.4% is the driving factor this market.
              • to 22.5 million is the driving factor this market.
              • by 2032. The prevalence of ophthalmic diseases is the driving factor this market.
              • hearing disorders is the driving factor this market.
              • and periodontal diseases is rising across the world. Age-related macular degeneration (AMD) is the third-leading cause of visual disability across the world and the leading cause in the industrialized world. According to NIH is the driving factor this market.
              • the projected number of people with age-related macular degeneration in 2020 is 196 million which is expected to increase 288 million by 2024.   . Diabetic retinopathy (DR) is the most common eye disease among diabetic people and a leading cause of blindness among such adults in the US. The number of people in the US with DR is expected to increase from approximately 8.50 million in 2016 to more than 9 million by 2022. According to the NIH is the driving factor this market.
              • in the US is the driving factor this market.
              • 2-3 out of every 1 is the driving factor this market.
              • 000 children are born with significant hearing loss in one or both ears. Approximately 37 million people in the country aged over 18 years reported trouble hearing. The prevalence of these chronic diseases increases significantly with age. Globally is the driving factor this market.
              • the aging population is also growing rapidly due to the increasing average life expectancy. According to the World Health Organization (WHO) is the driving factor this market.
              • by 2030 is the driving factor this market.
              • 1 in 6 people in the world will be aged 60 years or over. At this time the share of the population aged 60 years and over will increase from 1 billion in 2020 to 1.4 billion. By 2050 is the driving factor this market.
              • the world population of people aged 60 years and older will double (2.1 billion).  The prevalence of chronic cardiac is the driving factor this market.
              • neurological is the driving factor this market.
              • and orthopedic diseases is on the rise due to risk factors such as diabetes is the driving factor this market.
              • hypertension is the driving factor this market.
              • the consumption of tobacco is the driving factor this market.
              • and obesity. Hence is the driving factor this market.
              • the demand for pharmaceutical products such as drugs will increase is the driving factor this market.
              • which will spur the growth of the global pharmaceutical continuous manufacturing market during the forecast period. is the driving factor this market.

              The Pharmaceutical Continuous Manufacturing market vendors should focus on grabbing business opportunities from the Final drug product manufacturing segment as it accounted for the largest market share in the base year.