Titanium Market Size 2026-2030
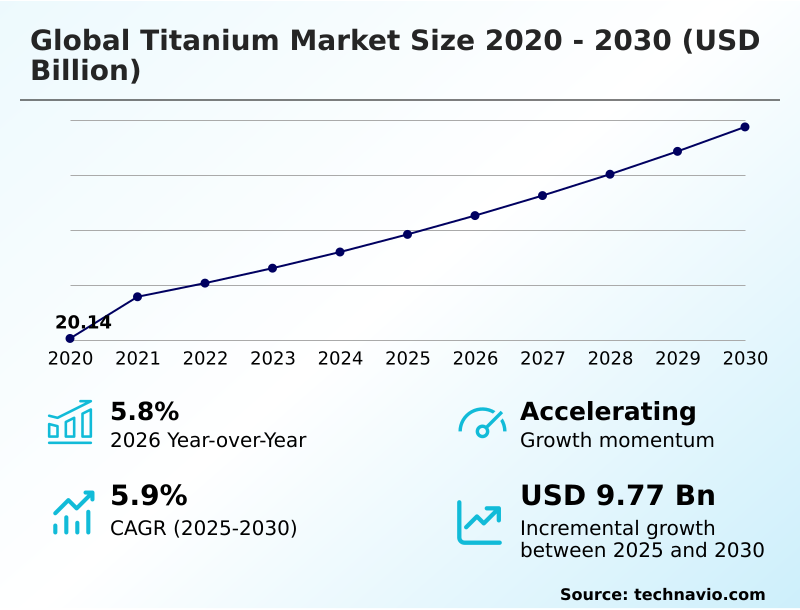
The titanium market size is valued to increase by USD 9.77 billion, at a CAGR of 5.9% from 2025 to 2030. Medical sector advancements associated with titanium will drive the titanium market.
Major Market Trends & Insights
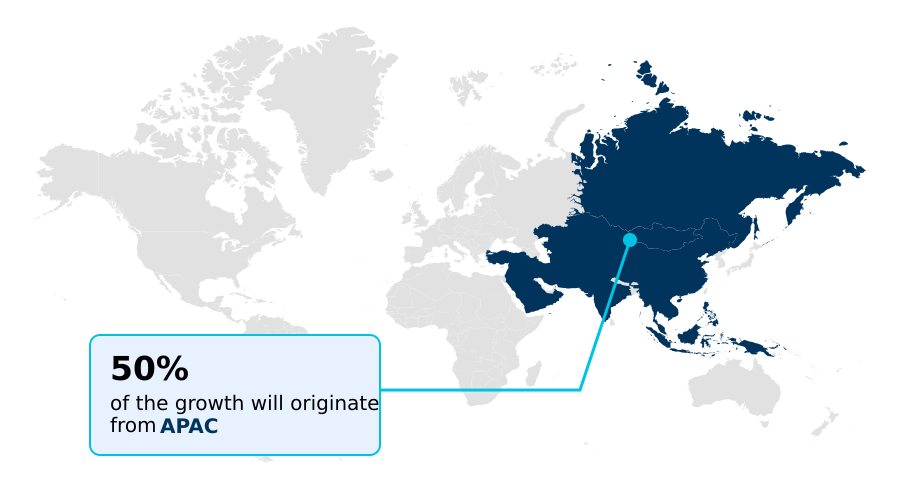
- APAC dominated the market and accounted for a 49.9% growth during the forecast period.
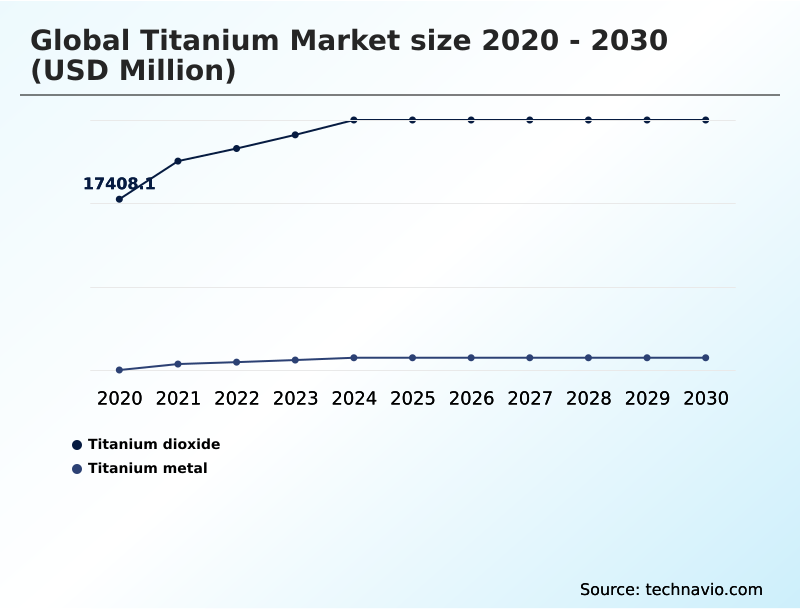
- By Product Type - Titanium dioxide segment was valued at USD 24.22 billion in 2024
- By Application - Aerospace and marine segment accounted for the largest market revenue share in 2024
Market Size & Forecast
- Market Opportunities: USD 19.23 billion
- Market Future Opportunities: USD 9.77 billion
- CAGR from 2025 to 2030 : 5.9%
Market Summary
- The titanium market is shaped by demand for materials with a superior high strength-to-weight ratio and exceptional corrosion resistance. Key sectors like aerospace, defense, and medical drive consumption, where material performance is non-negotiable. Growth is supported by the adoption of additive manufacturing, which allows for the creation of intricate lightweight structures and reduces material waste.
- For instance, an aerospace manufacturer can use powder-based additive techniques to produce a complex engine component, achieving a component weight reduction of 20% compared to traditional casting, directly improving fuel efficiency. However, the industry faces persistent challenges, including the capital-intensive nature of expanding titanium sponge production and the complexities of energy-intensive metallurgical methods.
- The supply of titanium feedstock minerals such as rutile and ilmenite is also a critical factor influencing price stability and availability. Furthermore, the development of new materials like titanium aluminide alloy and processing methods like vacuum arc remelting are essential for meeting the evolving demands of high-performance applications, ensuring the material's continued relevance in technologically advanced industries.
What will be the Size of the Titanium Market during the forecast period?
Get Key Insights on Market Forecast (PDF) Get Free Sample
How is the Titanium Market Segmented?
The titanium industry research report provides comprehensive data (region-wise segment analysis), with forecasts and estimates in "USD million" for the period 2026-2030, as well as historical data from 2020-2024 for the following segments.
- Product type
- Titanium dioxide
- Titanium metal
- Application
- Aerospace and marine
- Industrial
- Medical
- Others
- Form factor
- Sheets and plates
- Bars and billets
- Others
- Geography
- APAC
- China
- Japan
- India
- North America
- US
- Canada
- Mexico
- Europe
- Germany
- France
- UK
- South America
- Brazil
- Argentina
- Colombia
- Middle East and Africa
- Saudi Arabia
- UAE
- South Africa
- Rest of World (ROW)
- APAC
By Product Type Insights
The titanium dioxide segment is estimated to witness significant growth during the forecast period.
The titanium dioxide pigment segment is defined by its use in applications demanding high opacity and brightness.
The shift toward the chloride process for chloride-based production over traditional sulfate methods reflects a focus on creating a more consistent and higher quality specialized grade of titanium dioxide.
This focus on process improvements and advanced metallurgical solutions is critical for producers. Manufacturers are optimizing the production of both rutile and anatase grades to meet diverse industrial needs in downstream processing.
Implementing these advanced techniques has enabled some facilities to achieve a 15% improvement in yield rate optimization, enhancing cost-effectiveness and reducing waste. This push for efficiency ensures the material remains a vital component in coatings, plastics, and paper industries.
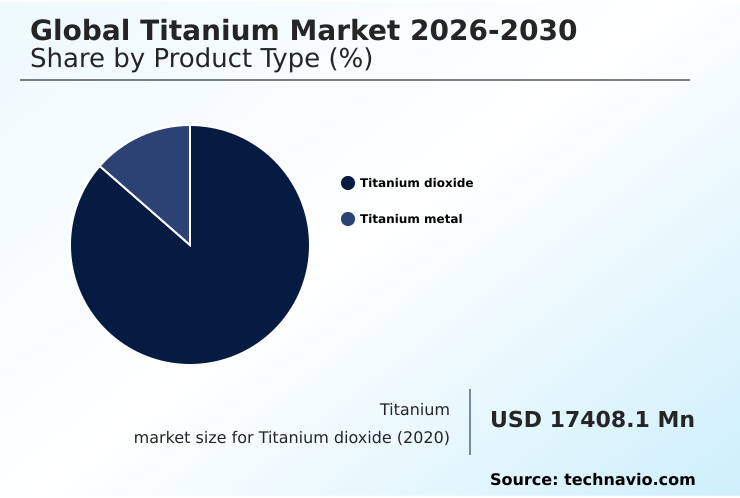
The Titanium dioxide segment was valued at USD 24.22 billion in 2024 and showed a gradual increase during the forecast period.
Regional Analysis
APAC is estimated to contribute 49.9% to the growth of the global market during the forecast period.Technavio’s analysts have elaborately explained the regional trends and drivers that shape the market during the forecast period.
See How Titanium Market Demand is Rising in APAC Get Free Sample
The geographic landscape is defined by regional specializations in value-added processing. North America leads in producing high-spec titanium alloy billets for aerospace, leveraging advanced technologies like vacuum arc remelting.
APAC, particularly China, dominates raw material processing, including the conversion of rutile ore. European producers focus on specialized products like cold rolled titanium sheets and titanium clad plates for industrial applications, emphasizing stringent regulatory compliance.
Across regions, there is a push for yield rate optimization, with some APAC facilities using digital twin technology to increase output by 5%.
This regional focus supports the development of a resilient critical minerals supply chain, with APAC contributing nearly 50% of the market's incremental growth.
Market Dynamics
Our researchers analyzed the data with 2025 as the base year, along with the key drivers, trends, and challenges. A holistic analysis of drivers will help companies refine their marketing strategies to gain a competitive advantage.
- Strategic decisions in the global titanium market are shaped by several interconnected factors. The cost analysis of titanium production reveals significant pressures from price volatility of titanium minerals and the capital-intensive nature of investment in titanium processing facilities. A primary concern remains the titanium sponge supply chain challenges, which are compounded by the impact of geopolitics on titanium supply.
- This has accelerated interest in sustainable practices in titanium recycling to create a more circular economy. The growth of titanium applications in renewable energy and the need for lightweighting vehicles with titanium alloys are creating new demand streams beyond traditional sectors.
- Additive manufacturing of titanium components is a key enabler, though it introduces new fabrication challenges of titanium metal that require specialized expertise in high purity titanium powder production. In the medical field, the use of biocompatible titanium for medical implants is expanding, governed by strict regulatory standards for medical titanium.
- Simultaneously, the market dynamics of titanium feedstock influence the entire value chain, from producers of titanium dioxide for architectural coatings to specialized industries requiring high corrosion resistance in marine applications or advanced materials for the role of titanium in defense applications.
- As a result, firms are focused on improving yield in titanium dioxide manufacturing and securing stable supply chains for both titanium use in chemical processing equipment and titanium alloy for aerospace structures, with vertically integrated players demonstrating a 20% greater resilience to supply shocks compared to those reliant on open markets.
What are the key market drivers leading to the rise in the adoption of Titanium Industry?
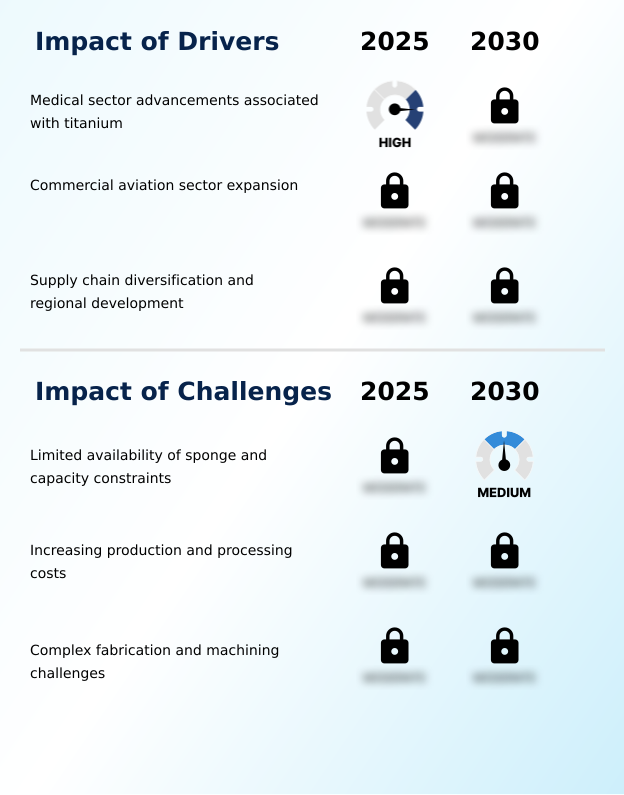
- Advancements in the medical sector, driven by titanium's biocompatibility and mechanical properties, are a key driver for market growth.
- Growth is heavily driven by demand from high-performance applications where material properties are paramount.
- The material's inherent biocompatibility makes it ideal for medical uses, including custom three-dimensional printed implants, while its high strength-to-weight ratio and excellent corrosion resistance are indispensable for aerospace-grade titanium components.
- Innovations in materials like titanium aluminide alloy offer enhanced thermal stability for next-generation jet engines, improving fuel efficiency by over 10%.
- In industrial settings, titanium ensures structural integrity and provides environmental degradation protection in harsh chemical environments, extending equipment lifespan and reducing maintenance costs significantly compared to conventional alloys.
What are the market trends shaping the Titanium Industry?
- The adoption of additive manufacturing technologies is an emerging trend, enabling the production of complex, lightweight components with greater material efficiency.
- A significant trend is the increasing adoption of additive manufacturing, which enables precision fabrication of complex lightweight structures. Techniques such as metal injection molding and other powder-based additive techniques are becoming mainstream, particularly with the use of high-purity titanium powders. This shift drives greater material efficiency, with some processes reducing waste by up to 40% compared to subtractive methods.
- The focus on sustainable production and recycling practices is also growing, with companies exploring closed-loop systems. Advanced topology optimization software allows engineers to design components that are both lighter and stronger, pushing performance boundaries in demanding sectors like aerospace and medical device manufacturing.
What challenges does the Titanium Industry face during its growth?
- The limited availability of titanium sponge and constraints on production capacity present a key challenge to the market's growth trajectory.
- The market grapples with structural challenges related to feedstock security and production capacity. The supply of titanium sponge is constrained by the high capital investment needed for energy-intensive metallurgical methods and new facilities. Volatility in titanium feedstock minerals like ilmenite affects cost structures, while the complex ore beneficiation process adds another layer of operational difficulty.
- Companies are exploring supply chain diversification to improve production resilience. However, high asset specificity, such as reliance on specialized synthetic rutile kilns, creates exit barriers and limits flexibility. These constraints can lead to supply bottlenecks, with lead times for certain specialty alloys increasing by up to 25% during periods of high demand.
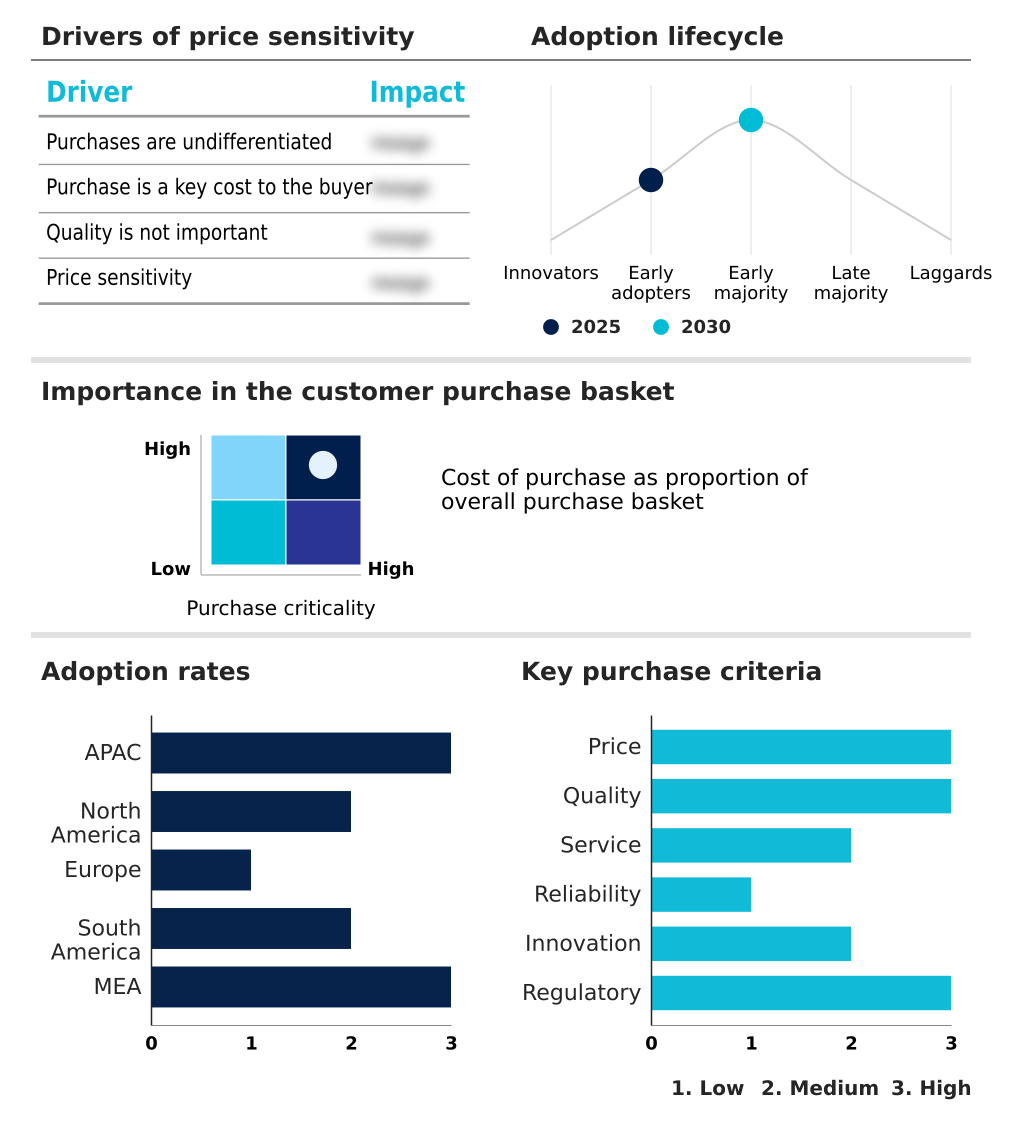
Exclusive Technavio Analysis on Customer Landscape
The titanium market forecasting report includes the adoption lifecycle of the market, covering from the innovator’s stage to the laggard’s stage. It focuses on adoption rates in different regions based on penetration. Furthermore, the titanium market report also includes key purchase criteria and drivers of price sensitivity to help companies evaluate and develop their market growth analysis strategies.
Customer Landscape of Titanium Industry
Competitive Landscape
Companies are implementing various strategies, such as strategic alliances, titanium market forecast, partnerships, mergers and acquisitions, geographical expansion, and product/service launches, to enhance their presence in the industry.
Allegheny Technologies Inc. - Provides high-performance titanium alloy sheets engineered for critical airframe structural components, meeting stringent aerospace and defense industry specifications.
The industry research and growth report includes detailed analyses of the competitive landscape of the market and information about key companies, including:
- Allegheny Technologies Inc.
- BAOTI METAL LIMITED
- Hangzhou King Titanium Co. Ltd.
- Iluka Resources Ltd.
- INEOS Group Holdings S.A.
- JX Advanced Metals Corp
- Kerala Minerals and Metals Ltd.
- Kobe Steel Ltd.
- Kronos Worldwide Inc.
- Precision Castparts Corp.
- PTC Industries Ltd
- Rоsatom Metal Tech
- Tayca Corp.
- The Chemours Co.
- Titanium Industries Inc.
- Toho Titanium Co. Ltd.
- Venator Materials Plc
- VVTi Pigments
Qualitative and quantitative analysis of companies has been conducted to help clients understand the wider business environment as well as the strengths and weaknesses of key industry players. Data is qualitatively analyzed to categorize companies as pure play, category-focused, industry-focused, and diversified; it is quantitatively analyzed to categorize companies as dominant, leading, strong, tentative, and weak.
Recent Development and News in Titanium market
- In February 2025, Chemours launched Ti-Pure TS-6706, a TMP- and TME-free variant of its universal grade pigment for low-VOC coatings.
- In March 2025, Chemours formed a strategic alliance with Energy Fuels to establish a domestic supply chain for critical minerals, including titanium ilmenite.
- In May 2025, Tekna secured substantial orders for its titanium metal injection molding powder from multiple customers, indicating rising confidence in powder-based additive manufacturing.
- In September 2025, PTC Industries commissioned a state-of-the-art vacuum arc remelting furnace, expanding its capability to produce large titanium castings for aerospace applications.
Dive into Technavio’s robust research methodology, blending expert interviews, extensive data synthesis, and validated models for unparalleled Titanium Market insights. See full methodology.
| Market Scope | |
|---|---|
| Page number | 288 |
| Base year | 2025 |
| Historic period | 2020-2024 |
| Forecast period | 2026-2030 |
| Growth momentum & CAGR | Accelerate at a CAGR of 5.9% |
| Market growth 2026-2030 | USD 9769.5 million |
| Market structure | Fragmented |
| YoY growth 2025-2026(%) | 5.8% |
| Key countries | China, Japan, India, South Korea, Australia, Indonesia, US, Canada, Mexico, Germany, France, UK, Italy, Spain, The Netherlands, Brazil, Argentina, Colombia, Saudi Arabia, UAE, South Africa, Egypt and Turkey |
| Competitive landscape | Leading Companies, Market Positioning of Companies, Competitive Strategies, and Industry Risks |
Research Analyst Overview
- The titanium market is driven by its unique material properties, including superior corrosion resistance and a high strength-to-weight ratio, making it indispensable for aerospace-grade titanium and medical applications demanding biocompatibility. Production of primary titanium sponge remains a bottleneck, reliant on energy-intensive metallurgical methods and a consistent supply of titanium feedstock minerals like rutile and ilmenite.
- The titanium dioxide pigment market, dominated by anatase and rutile grades, is increasingly adopting the cleaner chloride process and investing in synthetic rutile kilns. In the metals segment, additive manufacturing is transformative, enabling the creation of complex lightweight structures via powder-based additive techniques using high-purity titanium powders. Technologies like metal injection molding are gaining traction.
- For high-performance alloys, advanced processing such as vacuum arc remelting is critical for producing titanium alloy billets and innovative materials like titanium aluminide alloy. Downstream, demand for products like cold rolled titanium sheets and titanium clad plates is steady, with some producers achieving a 15% improvement in processing time for specialized grades.
What are the Key Data Covered in this Titanium Market Research and Growth Report?
-
What is the expected growth of the Titanium Market between 2026 and 2030?
-
USD 9.77 billion, at a CAGR of 5.9%
-
-
What segmentation does the market report cover?
-
The report is segmented by Product Type (Titanium dioxide, and Titanium metal), Application (Aerospace and marine, Industrial, Medical, and Others), Form Factor (Sheets and plates, Bars and billets, and Others) and Geography (APAC, North America, Europe, South America, Middle East and Africa)
-
-
Which regions are analyzed in the report?
-
APAC, North America, Europe, South America and Middle East and Africa
-
-
What are the key growth drivers and market challenges?
-
Medical sector advancements associated with titanium, Limited availability of sponge and capacity constraints
-
-
Who are the major players in the Titanium Market?
-
Allegheny Technologies Inc., BAOTI METAL LIMITED, Hangzhou King Titanium Co. Ltd., Iluka Resources Ltd., INEOS Group Holdings S.A., JX Advanced Metals Corp, Kerala Minerals and Metals Ltd., Kobe Steel Ltd., Kronos Worldwide Inc., Precision Castparts Corp., PTC Industries Ltd, Rоsatom Metal Tech, Tayca Corp., The Chemours Co., Titanium Industries Inc., Toho Titanium Co. Ltd., Venator Materials Plc and VVTi Pigments
-
Market Research Insights
- The market's dynamics are shifting toward supply chain diversification and enhanced production resilience to ensure feedstock security. Firms are adopting advanced metallurgical solutions and process improvements to boost efficiency, with some achieving a 12% reduction in energy consumption through yield rate optimization.
- The trend of sustainable production and recycling practices is gaining momentum, driven by regulatory compliance and a focus on material efficiency. In high-performance applications, precision fabrication using digital twin technology allows for advanced topology optimization and improved structural integrity. This enables unique products like custom three-dimensional printed implants and strengthens the critical minerals supply chain for defense.
- This focus on value-added processing and environmental degradation protection highlights a move toward higher-margin, technologically advanced segments.
We can help! Our analysts can customize this titanium market research report to meet your requirements.
 RIA -
RIA - 
