Pharmacovigilance And Drug Safety Software Market Analysis, Size, and Forecast 2026-2030: North America (US, Canada, and Mexico), Europe (Germany, UK, and France), APAC (China, Japan, and India), South America (Brazil, Argentina, and Colombia), Middle East and Africa (Saudi Arabia, UAE, and South Africa), Asia, Rest of World (ROW)

Pharmacovigilance And Drug Safety Software Market Analysis, Size, and Forecast 2026-2030:
North America (US, Canada, and Mexico), Europe (Germany, UK, and France), APAC (China, Japan, and India), South America (Brazil, Argentina, and Colombia), Middle East and Africa (Saudi Arabia, UAE, and South Africa), Asia, Rest of World (ROW)

Published: Dec 2025 294 Pages SKU: IRTNTR70377

Market Overview at a Glance

$84.8 Mn
Market Opportunity
7.3%
CAGR 2025 - 2030
39.2%
North America Growth
$107.1 Mn
Pharmaceutical and biotechnology companies segment 2024

Pharmacovigilance And Drug Safety Software Market Size 2026-2030

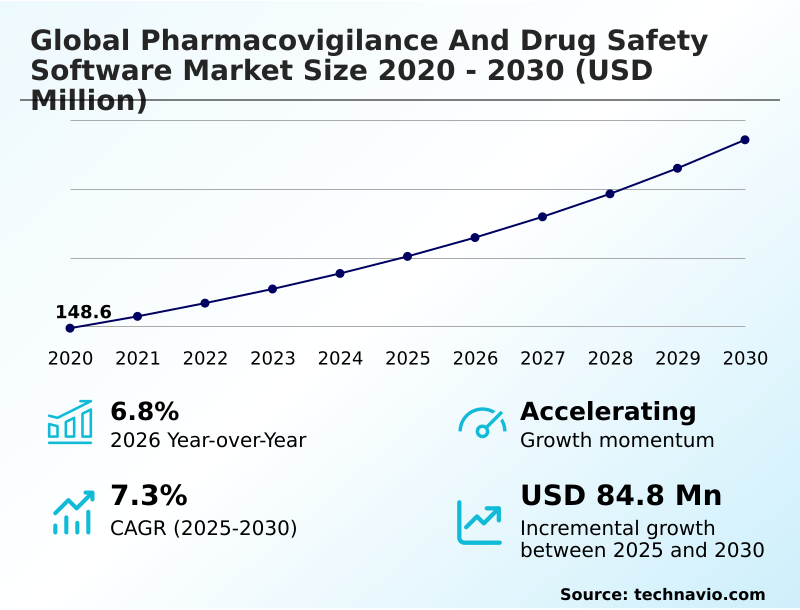
The pharmacovigilance and drug safety software market size is valued to increase by USD 84.8 million, at a CAGR of 7.3% from 2025 to 2030. Rising incidence rates of adverse drug events will drive the pharmacovigilance and drug safety software market.

Major Market Trends & Insights

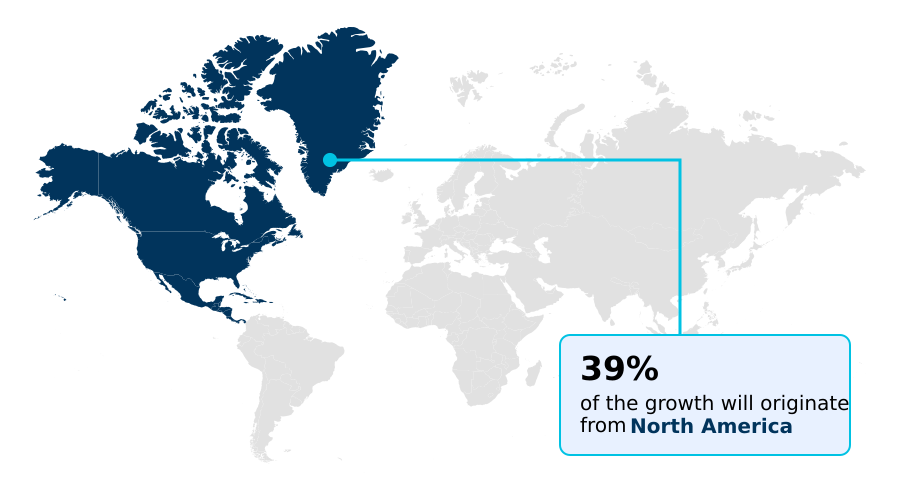
  • North America dominated the market and accounted for a 39.2% growth during the forecast period.
  • By End-user - Pharmaceutical and biotechnology companies segment was valued at USD 107.1 million in 2024
  • By Deployment - Cloud-based segment accounted for the largest market revenue share in 2024

Market Size & Forecast

  • Market Opportunities: USD 137 million
  • Market Future Opportunities: USD 84.8 million
  • CAGR from 2025 to 2030 : 7.3%

Market Summary

  • The pharmacovigilance and drug safety software market is fundamentally shaped by the need to ensure patient safety amid increasingly complex global regulations. Key drivers include the rising volume of adverse drug events and the stringent compliance mandates from health authorities worldwide, which necessitate sophisticated systems for data collection, analysis, and reporting.
  • A primary trend is the rapid adoption of artificial intelligence and machine learning to automate routine tasks, such as case processing and signal detection, which enhances efficiency and accuracy. Cloud-based solutions are also becoming standard, offering scalability and reducing the infrastructure burden for companies of all sizes.
  • For instance, a mid-sized biotechnology firm launching its first drug globally can leverage a cloud-based software-as-a-service platform to manage safety reporting across different regions without a large upfront capital investment, ensuring timely compliance.
  • However, the market faces challenges related to the high cost of implementation, data security concerns in a cloud environment, and the difficulty of integrating new software with existing legacy IT systems. Addressing these issues is crucial for vendors aiming to provide effective and accessible solutions that help life sciences companies navigate the intricate landscape of drug safety and regulatory adherence.

What will be the Size of the Pharmacovigilance And Drug Safety Software Market during the forecast period?

Get Key Insights on Market Forecast (PDF) Request Free Sample

How is the Pharmacovigilance And Drug Safety Software Market Segmented?

The pharmacovigilance and drug safety software industry research report provides comprehensive data (region-wise segment analysis), with forecasts and estimates in "USD million" for the period 2026-2030, as well as historical data from 2020-2024 for the following segments.
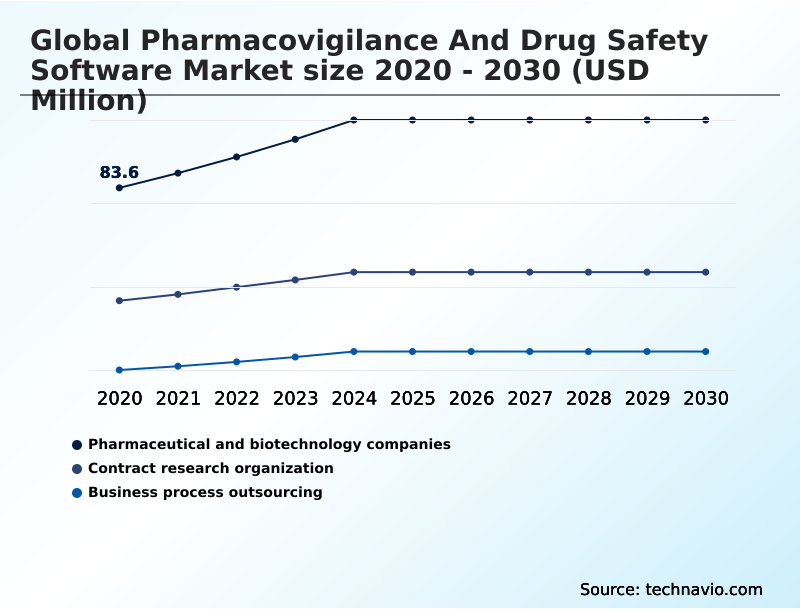
  • End-user
    • Pharmaceutical and biotechnology companies
    • Contract research organization
    • Business process outsourcing
  • Deployment
    • Cloud-based
    • On-premises
  • Application
    • Post-marketing surveillance
    • Clinical trials
    • Regulatory compliance
  • Geography
    • North America
      • US
      • Canada
      • Mexico
    • Europe
      • Germany
      • UK
      • France
    • Asia
    • Rest of World (ROW)

By End-user Insights

The pharmaceutical and biotechnology companies segment is estimated to witness significant growth during the forecast period.

The pharmaceutical and biotechnology sector's demand is driven by stringent regulatory requirements and the need for robust benefit-risk assessment.

These organizations leverage dedicated software for pre-market and post-market safety studies, employing causality assessment tools and safety signal management to identify unrecognized adverse events.

With high R&D spending, managing the pharmacovigilance system master file and preparing aggregate reporting tools like periodic safety update reports are critical.

The integration of electronic health record integration is a key focus, with modern platforms improving the efficiency of PV literature screening by over 40%.

Companies also utilize pharmacovigilance consulting to refine their pharmacovigilance business strategy and ensure compliance for products like medical device vigilance and cosmetovigilance software, while managing pharmacovigilance SOPs and complex tasks such as E2B R3 conversion and MedDRA coding automation.

Request Free Sample

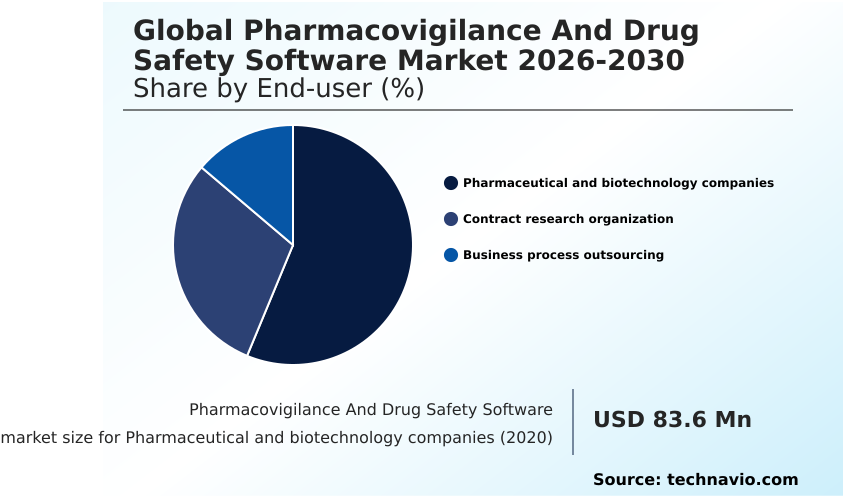
The Pharmaceutical and biotechnology companies segment was valued at USD 107.1 million in 2024 and showed a gradual increase during the forecast period.

Request Free Sample

Regional Analysis

North America is estimated to contribute 39.2% to the growth of the global market during the forecast period.Technavio’s analysts have elaborately explained the regional trends and drivers that shape the market during the forecast period.

See How Pharmacovigilance And Drug Safety Software Market Demand is Rising in North America Request Free Sample

The global landscape is led by North America, which accounts for over 39% of market opportunities, driven by its stringent regulatory environment that mandates advanced signal detection analytics and E2B(R3) compliance.

Europe remains a significant region, with a strong focus on comprehensive risk management planning and pharmacovigilance risk assessment. The fastest growth is seen in Asia, where pharmacovigilance outsourcing to CRO pharmacovigilance platforms is common.

These service providers leverage systems with multi-tenant architecture to manage global client portfolios efficiently. The adoption of case processing automation and automated case intake in this region has improved operational efficiency by up to 35%.

A key focus across all mature regions is clinical trial safety management and the implementation of a rigorous signal validation process to support benefit-risk management and facilitate ongoing pharmacovigilance training.

Market Dynamics

Our researchers analyzed the data with 2025 as the base year, along with the key drivers, trends, and challenges. A holistic analysis of drivers will help companies refine their marketing strategies to gain a competitive advantage.

  • Strategic decision-making for pharmacovigilance systems requires a thorough evaluation of multiple factors. A primary consideration is the cloud versus on-premise PV debate, where the drug safety software TCO is often a deciding factor. For emerging biotech pharmacovigilance platforms, scalable solutions are critical, whereas established firms may prioritize a robust global safety database selection process.
  • The integration of AI-powered signal detection and machine learning in signal detection is becoming a standard expectation, with systems leveraging NLP for adverse events to process unstructured data. Ensuring compliance requires solutions for E2B R3 compliance solutions and automated MedDRA coding tools. For organizations conducting clinical studies, managing data from EHR data integration software is essential.
  • The functionality must also extend to medical device vigilance software and support for PSUR management software features. Key operational aspects include selecting the right pharmacovigilance audit trail software, planning for data migration in pharmacovigilance, and engaging PV software validation services.
  • Ultimately, the choice of automated case processing tools and a comprehensive risk management plan software is vital for ensuring patient data security in PV and maintaining regulatory adherence. Systems that streamline these processes are shown to accelerate reporting cycles significantly compared to legacy methods.

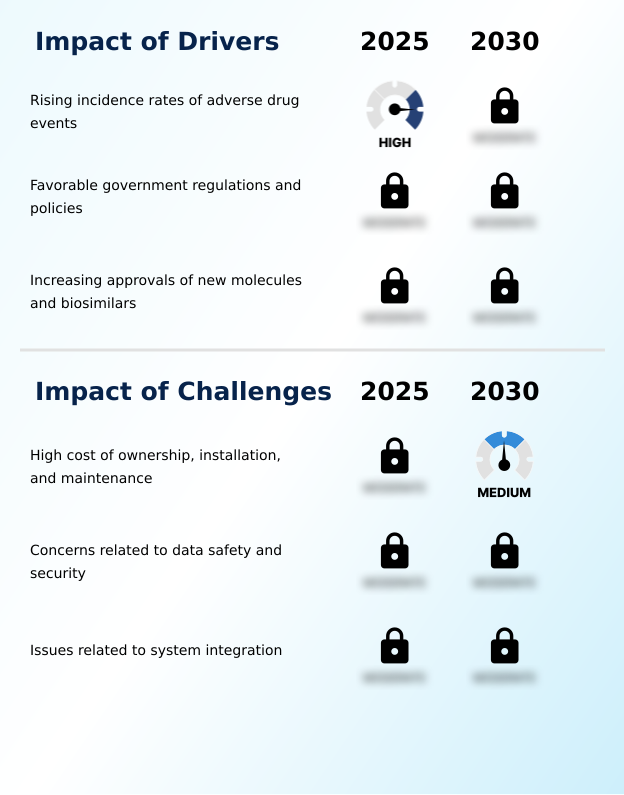
What are the key market drivers leading to the rise in the adoption of Pharmacovigilance And Drug Safety Software Industry?

  • The rising incidence of adverse drug events is a key driver fueling the demand for advanced pharmacovigilance and drug safety software.

  • Increasingly stringent global regulations and the rising incidence of adverse drug reactions are primary drivers compelling investment in advanced drug safety monitoring solutions.
  • Health authorities demand strict GVP modules compliance and flawless regulatory submission management, making a comprehensive pharmacovigilance compliance software essential.
  • Modern adverse event reporting system platforms provide an end-to-end safety platform for the entire drug development safety lifecycle, from IND safety reporting to post-marketing surveillance.
  • The adoption of specialized adverse drug reaction software facilitates efficient e-reporting for pharmacovigilance, reducing critical errors in drug safety audits.
  • This need is amplified by the continuous approval of new molecules, which requires robust patient safety monitoring software to manage a higher volume of data and ensure timely reporting, improving compliance rates to over 98% in many cases.

What are the market trends shaping the Pharmacovigilance And Drug Safety Software Industry?

  • The integration of artificial intelligence is an emerging trend in pharmacovigilance. This shift is reshaping data management and analytical capabilities across the industry.

  • The market is undergoing significant transformation, driven by the adoption of a cloud-based SaaS platform model and the pervasive influence of AI in pharmacovigilance. This trend enables the deployment of sophisticated biopharmaceutical safety solutions and integrated safety suite offerings with greater scalability.
  • Utilizing machine learning automation and natural language processing, modern systems can analyze unstructured data from sources like social media listening for PV, improving the accuracy of AI-based safety case processing by up to 30%. The focus on real-world evidence integration and real-world data analytics is also paramount, with advanced pharmacovigilance analytics providing deeper insights.
  • Cloud pharmacovigilance solutions not only enhance life sciences compliance but also reduce infrastructure maintenance costs by over 40% compared to traditional on-premises deployments.

What challenges does the Pharmacovigilance And Drug Safety Software Industry face during its growth?

  • The high total cost of ownership, including installation and maintenance, presents a significant challenge to market growth, particularly for smaller organizations.

  • Key market challenges center on operational and security concerns. The complexity of maintaining data integrity and security within a global safety database or any pharmacovigilance database remains a top priority, especially with healthcare data breaches being 35% more frequent than in other regulated industries.
  • Integrating new validated software systems with legacy pharmacovigilance IT infrastructure often presents significant hurdles, leading to data silos and hampering PV data management. Furthermore, the cost and complexity associated with drug safety services, such as maintaining safety data exchange agreements and ensuring PV audit readiness, are substantial.
  • The management of a regulatory intelligence platform, vigilance platform technology, and related drug safety call center solutions also requires significant investment, while ensuring PSMF maintenance adds to the operational burden for many organizations.

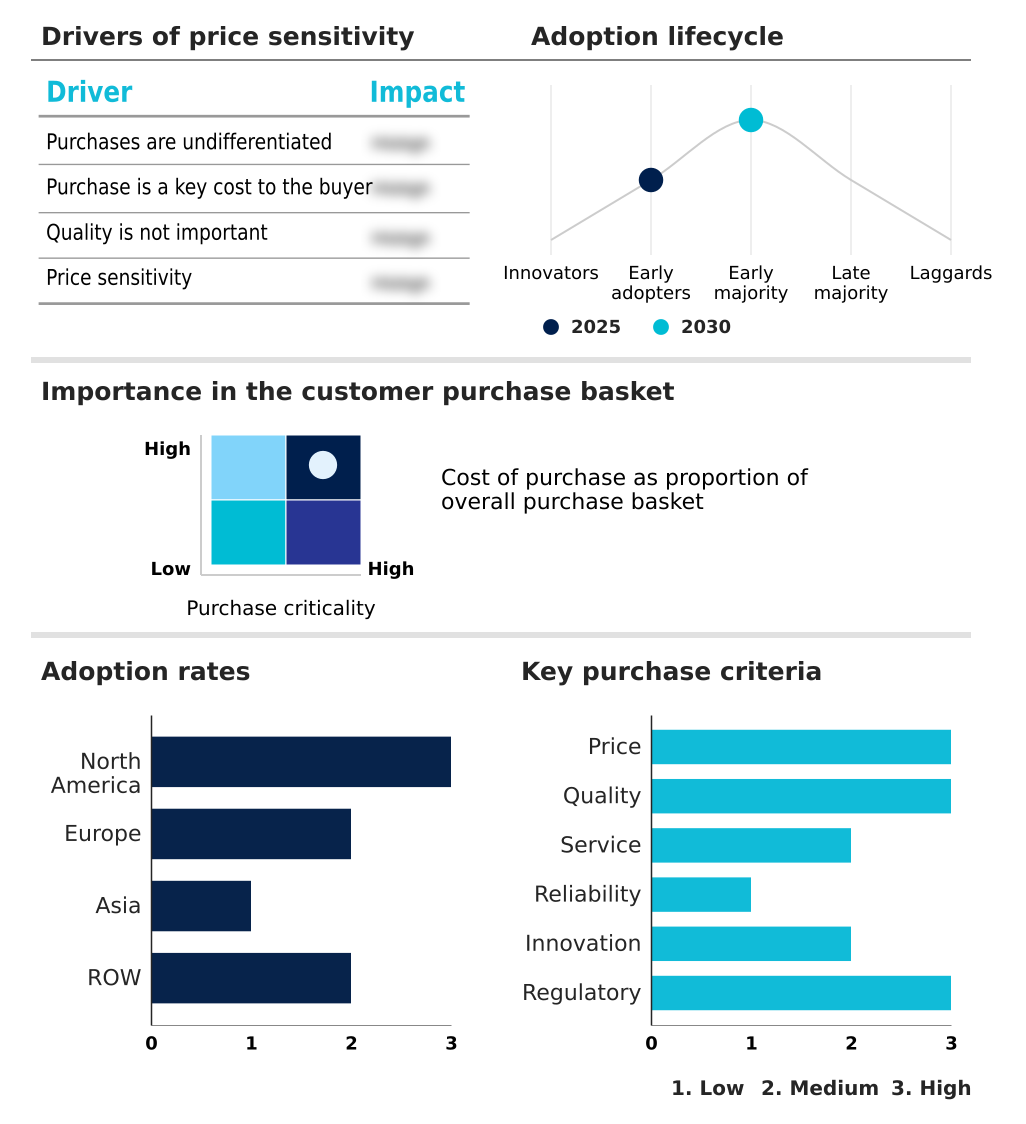
Exclusive Technavio Analysis on Customer Landscape

The pharmacovigilance and drug safety software market forecasting report includes the adoption lifecycle of the market, covering from the innovator’s stage to the laggard’s stage. It focuses on adoption rates in different regions based on penetration. Furthermore, the pharmacovigilance and drug safety software market report also includes key purchase criteria and drivers of price sensitivity to help companies evaluate and develop their market growth analysis strategies.

Customer Landscape of Pharmacovigilance And Drug Safety Software Industry

Competitive Landscape

Companies are implementing various strategies, such as strategic alliances, pharmacovigilance and drug safety software market forecast, partnerships, mergers and acquisitions, geographical expansion, and product/service launches, to enhance their presence in the industry.

AB Cube SARL - Offerings center on unified, cloud-native platforms that provide end-to-end safety case management, automated regulatory reporting, and advanced analytics to ensure global compliance for life sciences firms.

The industry research and growth report includes detailed analyses of the competitive landscape of the market and information about key companies, including:

  • AB Cube SARL
  • Accenture PLC
  • ArisGlobal LLC
  • BaseCon AS
  • Clarivate PLC
  • Cognizant Technology Solution
  • Ennov SAS
  • EXTEDO GmbH
  • Honeywell International Inc.
  • Indegene Pvt. Ltd.
  • IQVIA Holdings Inc.
  • Max Application Srl
  • Oracle Corp.
  • Pegasystems Inc.
  • Sarjen Systems Pvt. Ltd.
  • TriNetX LLC
  • United BioSource LLC
  • Veeva Systems Inc.
  • Wipro Ltd.

Qualitative and quantitative analysis of companies has been conducted to help clients understand the wider business environment as well as the strengths and weaknesses of key industry players. Data is qualitatively analyzed to categorize companies as pure play, category-focused, industry-focused, and diversified; it is quantitatively analyzed to categorize companies as dominant, leading, strong, tentative, and weak.

Recent Development and News in Pharmacovigilance and drug safety software market

  • In September 2024, ReguSure AI announced the launch of its SignalSphere platform, which uses machine learning automation to analyze real-world evidence from disparate sources, enhancing proactive safety signal management for pharmaceutical clients (Source: Company Press Release).
  • In November 2024, VigilanceTech Solutions acquired DataSafe Analytics for approximately $350 million, integrating its advanced pharmacovigilance analytics with VigilanceTech's established cloud-based SaaS platform to create a comprehensive end-to-end safety platform (Source: The Wall Street Journal).
  • In February 2025, OmniCloud Pharma and HealthSys EHR entered a strategic partnership to embed OmniCloud's automated case intake module directly within the HealthSys electronic health record system, simplifying adverse event reporting for healthcare providers by over 50% (Source: Reuters).
  • In April 2025, BioSafety Platforms Inc. secured $100 million in Series C funding to expand its multi-tenant architecture, specifically targeting contract research organizations and enhancing its clinical trial safety management capabilities for decentralized trials (Source: Bloomberg).

Dive into Technavio’s robust research methodology, blending expert interviews, extensive data synthesis, and validated models for unparalleled Pharmacovigilance And Drug Safety Software Market insights. See full methodology.

Market Scope
Page number 294
Base year 2025
Historic period 2020-2024
Forecast period 2026-2030
Growth momentum & CAGR Accelerate at a CAGR of 7.3%
Market growth 2026-2030 USD 84.8 million
Market structure Fragmented
YoY growth 2025-2026(%) 6.8%
Key countries US, Canada, Mexico, Germany, UK, France, Italy, Spain, The Netherlands, China, Japan, India, South Korea, Singapore, Indonesia, Brazil, Australia, Saudi Arabia, UAE, Argentina, South Africa, Colombia and Egypt
Competitive landscape Leading Companies, Market Positioning of Companies, Competitive Strategies, and Industry Risks

Request Free Sample

Research Analyst Overview

  • The pharmacovigilance and drug safety software market is driven by the absolute necessity for life sciences companies to maintain regulatory compliance and ensure patient safety. The adoption of a modern adverse event reporting system is no longer optional but a core operational requirement.
  • Boardroom decisions increasingly center on investing in a validated software system that incorporates a global safety database and robust pharmacovigilance database functionalities. Key technologies shaping the landscape include real-world evidence integration, natural language processing, and machine learning automation for advanced pharmacovigilance analytics.
  • The implementation of case processing automation can reduce manual data entry efforts by as much as 60%, allowing teams to focus on high-value activities like benefit-risk assessment, causality assessment tools, and safety signal management.
  • Solutions must support the entire lifecycle, from clinical trial safety management to post-marketing surveillance, including drug safety audits, MedDRA coding automation, and the generation of periodic safety update reports and other aggregate reporting tools. Ensuring data integrity and security, managing a pharmacovigilance system master file, and enabling seamless electronic health record integration are pivotal for a compliant, end-to-end safety platform.

What are the Key Data Covered in this Pharmacovigilance And Drug Safety Software Market Research and Growth Report?

  • What is the expected growth of the Pharmacovigilance And Drug Safety Software Market between 2026 and 2030?

    • USD 84.8 million, at a CAGR of 7.3%

  • What segmentation does the market report cover?

    • The report is segmented by End-user (Pharmaceutical and biotechnology companies, Contract research organization, and Business process outsourcing), Deployment (Cloud-based, and On-premises), Application (Post-marketing surveillance, Clinical trials, and Regulatory compliance) and Geography (North America, Europe, Asia, Rest of World (ROW))

  • Which regions are analyzed in the report?

    • North America, Europe, Asia and Rest of World (ROW)

  • What are the key growth drivers and market challenges?

    • Rising incidence rates of adverse drug events, High cost of ownership, installation, and maintenance

  • Who are the major players in the Pharmacovigilance And Drug Safety Software Market?

    • AB Cube SARL, Accenture PLC, ArisGlobal LLC, BaseCon AS, Clarivate PLC, Cognizant Technology Solution, Ennov SAS, EXTEDO GmbH, Honeywell International Inc., Indegene Pvt. Ltd., IQVIA Holdings Inc., Max Application Srl, Oracle Corp., Pegasystems Inc., Sarjen Systems Pvt. Ltd., TriNetX LLC, United BioSource LLC, Veeva Systems Inc. and Wipro Ltd.

Market Research Insights

  • Market dynamics are increasingly shaped by a strategic shift towards pharmacovigilance workflow optimization. Organizations are adopting end-to-end safety platforms and integrated safety suites to streamline drug safety services and enhance their PV quality management system. The adoption of AI in pharmacovigilance is pivotal, with some systems improving case processing efficiency by over 30%.
  • This move is supported by a robust pharmacovigilance IT infrastructure and a focus on drug development safety. As companies engage in pharmacovigilance outsourcing to CRO pharmacovigilance platforms, demand for scalable drug safety monitoring solutions grows.
  • Adherence to GVP modules compliance is non-negotiable, and specialized adverse drug reaction software that facilitates e-reporting for pharmacovigilance can reduce submission errors by up to 90% compared to manual methods, reinforcing the importance of modern vigilance platform technology.

We can help! Our analysts can customize this pharmacovigilance and drug safety software market research report to meet your requirements.

Get in touch

1. Executive Summary

1.1 Market overview

Executive Summary - Chart on Market Overview
Executive Summary - Data Table on Market Overview
Executive Summary - Chart on Global Market Characteristics
Executive Summary - Chart on Market by Geography
Executive Summary - Chart on Market Segmentation by End-user
Executive Summary - Chart on Market Segmentation by Deployment
Executive Summary - Chart on Market Segmentation by Application
Executive Summary - Chart on Incremental Growth
Executive Summary - Data Table on Incremental Growth
Executive Summary - Chart on Company Market Positioning

2. Technavio Analysis

2.1 Analysis of price sensitivity, lifecycle, customer purchase basket, adoption rates, and purchase criteria

2.2 Criticality of inputs and Factors of differentiation

Chart on Overview on criticality of inputs and factors of differentiation

2.3 Factors of disruption

Chart on Overview on factors of disruption

2.4 Impact of drivers and challenges

Chart on Impact of drivers and challenges in 2025 and 2030

3. Market Landscape

3.1 Market ecosystem

Chart on Parent Market
Data Table on - Parent Market

3.2 Market characteristics

Chart on Market characteristics analysis

3.3 Value chain analysis

Chart on Value chain analysis

4. Market Sizing

4.1 Market definition

Data Table on Offerings of companies included in the market definition

4.2 Market segment analysis

Market segments

4.3 Market size 2025

4.4 Market outlook: Forecast for 2025-2030

Chart on Global - Market size and forecast 2025-2030 ($ million)
Data Table on Global - Market size and forecast 2025-2030 ($ million)
Chart on Global Market: Year-over-year growth 2025-2030 (%)
Data Table on Global Market: Year-over-year growth 2025-2030 (%)

5. Historic Market Size

5.1 Global Pharmacovigilance And Drug Safety Software Market 2020 - 2024

Historic Market Size - Data Table on Global Pharmacovigilance And Drug Safety Software Market 2020 - 2024 ($ million)

5.2 End-user segment analysis 2020 - 2024

Historic Market Size - End-user Segment 2020 - 2024 ($ million)

5.3 Deployment segment analysis 2020 - 2024

Historic Market Size - Deployment Segment 2020 - 2024 ($ million)

5.4 Application segment analysis 2020 - 2024

Historic Market Size - Application Segment 2020 - 2024 ($ million)

5.5 Geography segment analysis 2020 - 2024

Historic Market Size - Geography Segment 2020 - 2024 ($ million)

5.6 Country segment analysis 2020 - 2024

Historic Market Size - Country Segment 2020 - 2024 ($ million)

6. Qualitative Analysis

6.1 The AI impact on Global Pharmacovigilance and Drug Safety Software Market

7. Five Forces Analysis

7.1 Five forces summary

Five forces analysis - Comparison between 2025 and 2030

7.2 Bargaining power of buyers

Bargaining power of buyers - Impact of key factors 2025 and 2030

7.3 Bargaining power of suppliers

Bargaining power of suppliers - Impact of key factors in 2025 and 2030

7.4 Threat of new entrants

Threat of new entrants - Impact of key factors in 2025 and 2030

7.5 Threat of substitutes

Threat of substitutes - Impact of key factors in 2025 and 2030

7.6 Threat of rivalry

Threat of rivalry - Impact of key factors in 2025 and 2030

7.7 Market condition

Chart on Market condition - Five forces 2025 and 2030

8. Market Segmentation by End-user

8.1 Market segments

Chart on End-user - Market share 2025-2030 (%)
Data Table on End-user - Market share 2025-2030 (%)

8.2 Comparison by End-user

Chart on Comparison by End-user
Data Table on Comparison by End-user

8.3 Pharmaceutical and biotechnology companies - Market size and forecast 2025-2030

Chart on Pharmaceutical and biotechnology companies - Market size and forecast 2025-2030 ($ million)
Data Table on Pharmaceutical and biotechnology companies - Market size and forecast 2025-2030 ($ million)
Chart on Pharmaceutical and biotechnology companies - Year-over-year growth 2025-2030 (%)
Data Table on Pharmaceutical and biotechnology companies - Year-over-year growth 2025-2030 (%)

8.4 Contract research organization - Market size and forecast 2025-2030

Chart on Contract research organization - Market size and forecast 2025-2030 ($ million)
Data Table on Contract research organization - Market size and forecast 2025-2030 ($ million)
Chart on Contract research organization - Year-over-year growth 2025-2030 (%)
Data Table on Contract research organization - Year-over-year growth 2025-2030 (%)

8.5 Business process outsourcing - Market size and forecast 2025-2030

Chart on Business process outsourcing - Market size and forecast 2025-2030 ($ million)
Data Table on Business process outsourcing - Market size and forecast 2025-2030 ($ million)
Chart on Business process outsourcing - Year-over-year growth 2025-2030 (%)
Data Table on Business process outsourcing - Year-over-year growth 2025-2030 (%)

8.6 Market opportunity by End-user

Market opportunity by End-user ($ million)
Data Table on Market opportunity by End-user ($ million)

9. Market Segmentation by Deployment

9.1 Market segments

Chart on Deployment - Market share 2025-2030 (%)
Data Table on Deployment - Market share 2025-2030 (%)

9.2 Comparison by Deployment

Chart on Comparison by Deployment
Data Table on Comparison by Deployment

9.3 Cloud-based - Market size and forecast 2025-2030

Chart on Cloud-based - Market size and forecast 2025-2030 ($ million)
Data Table on Cloud-based - Market size and forecast 2025-2030 ($ million)
Chart on Cloud-based - Year-over-year growth 2025-2030 (%)
Data Table on Cloud-based - Year-over-year growth 2025-2030 (%)

9.4 On-premises - Market size and forecast 2025-2030

Chart on On-premises - Market size and forecast 2025-2030 ($ million)
Data Table on On-premises - Market size and forecast 2025-2030 ($ million)
Chart on On-premises - Year-over-year growth 2025-2030 (%)
Data Table on On-premises - Year-over-year growth 2025-2030 (%)

9.5 Market opportunity by Deployment

Market opportunity by Deployment ($ million)
Data Table on Market opportunity by Deployment ($ million)

10. Market Segmentation by Application

10.1 Market segments

Chart on Application - Market share 2025-2030 (%)
Data Table on Application - Market share 2025-2030 (%)

10.2 Comparison by Application

Chart on Comparison by Application
Data Table on Comparison by Application

10.3 Post-marketing surveillance - Market size and forecast 2025-2030

Chart on Post-marketing surveillance - Market size and forecast 2025-2030 ($ million)
Data Table on Post-marketing surveillance - Market size and forecast 2025-2030 ($ million)
Chart on Post-marketing surveillance - Year-over-year growth 2025-2030 (%)
Data Table on Post-marketing surveillance - Year-over-year growth 2025-2030 (%)

10.4 Clinical trials - Market size and forecast 2025-2030

Chart on Clinical trials - Market size and forecast 2025-2030 ($ million)
Data Table on Clinical trials - Market size and forecast 2025-2030 ($ million)
Chart on Clinical trials - Year-over-year growth 2025-2030 (%)
Data Table on Clinical trials - Year-over-year growth 2025-2030 (%)

10.5 Regulatory compliance - Market size and forecast 2025-2030

Chart on Regulatory compliance - Market size and forecast 2025-2030 ($ million)
Data Table on Regulatory compliance - Market size and forecast 2025-2030 ($ million)
Chart on Regulatory compliance - Year-over-year growth 2025-2030 (%)
Data Table on Regulatory compliance - Year-over-year growth 2025-2030 (%)

10.6 Market opportunity by Application

Market opportunity by Application ($ million)
Data Table on Market opportunity by Application ($ million)

11. Customer Landscape

11.1 Customer landscape overview

Analysis of price sensitivity, lifecycle, customer purchase basket, adoption rates, and purchase criteria

12. Geographic Landscape

12.1 Geographic segmentation

Chart on Market share by geography 2025-2030 (%)
Data Table on Market share by geography 2025-2030 (%)

12.2 Geographic comparison

Chart on Geographic comparison
Data Table on Geographic comparison

12.3 North America - Market size and forecast 2025-2030

Chart on North America - Market size and forecast 2025-2030 ($ million)
Data Table on North America - Market size and forecast 2025-2030 ($ million)
Chart on North America - Year-over-year growth 2025-2030 (%)
Data Table on North America - Year-over-year growth 2025-2030 (%)
Chart on Regional Comparison - North America
Data Table on Regional Comparison - North America

12.3.1 US - Market size and forecast 2025-2030

Chart on US - Market size and forecast 2025-2030 ($ million)
Data Table on US - Market size and forecast 2025-2030 ($ million)
Chart on US - Year-over-year growth 2025-2030 (%)
Data Table on US - Year-over-year growth 2025-2030 (%)

12.3.2 Canada - Market size and forecast 2025-2030

Chart on Canada - Market size and forecast 2025-2030 ($ million)
Data Table on Canada - Market size and forecast 2025-2030 ($ million)
Chart on Canada - Year-over-year growth 2025-2030 (%)
Data Table on Canada - Year-over-year growth 2025-2030 (%)

12.3.3 Mexico - Market size and forecast 2025-2030

Chart on Mexico - Market size and forecast 2025-2030 ($ million)
Data Table on Mexico - Market size and forecast 2025-2030 ($ million)
Chart on Mexico - Year-over-year growth 2025-2030 (%)
Data Table on Mexico - Year-over-year growth 2025-2030 (%)

12.4 Europe - Market size and forecast 2025-2030

Chart on Europe - Market size and forecast 2025-2030 ($ million)
Data Table on Europe - Market size and forecast 2025-2030 ($ million)
Chart on Europe - Year-over-year growth 2025-2030 (%)
Data Table on Europe - Year-over-year growth 2025-2030 (%)
Chart on Regional Comparison - Europe
Data Table on Regional Comparison - Europe

12.4.1 Germany - Market size and forecast 2025-2030

Chart on Germany - Market size and forecast 2025-2030 ($ million)
Data Table on Germany - Market size and forecast 2025-2030 ($ million)
Chart on Germany - Year-over-year growth 2025-2030 (%)
Data Table on Germany - Year-over-year growth 2025-2030 (%)

12.4.2 UK - Market size and forecast 2025-2030

Chart on UK - Market size and forecast 2025-2030 ($ million)
Data Table on UK - Market size and forecast 2025-2030 ($ million)
Chart on UK - Year-over-year growth 2025-2030 (%)
Data Table on UK - Year-over-year growth 2025-2030 (%)

12.4.3 France - Market size and forecast 2025-2030

Chart on France - Market size and forecast 2025-2030 ($ million)
Data Table on France - Market size and forecast 2025-2030 ($ million)
Chart on France - Year-over-year growth 2025-2030 (%)
Data Table on France - Year-over-year growth 2025-2030 (%)

12.4.4 Italy - Market size and forecast 2025-2030

Chart on Italy - Market size and forecast 2025-2030 ($ million)
Data Table on Italy - Market size and forecast 2025-2030 ($ million)
Chart on Italy - Year-over-year growth 2025-2030 (%)
Data Table on Italy - Year-over-year growth 2025-2030 (%)

12.4.5 Spain - Market size and forecast 2025-2030

Chart on Spain - Market size and forecast 2025-2030 ($ million)
Data Table on Spain - Market size and forecast 2025-2030 ($ million)
Chart on Spain - Year-over-year growth 2025-2030 (%)
Data Table on Spain - Year-over-year growth 2025-2030 (%)

12.4.6 The Netherlands - Market size and forecast 2025-2030

Chart on The Netherlands - Market size and forecast 2025-2030 ($ million)
Data Table on The Netherlands - Market size and forecast 2025-2030 ($ million)
Chart on The Netherlands - Year-over-year growth 2025-2030 (%)
Data Table on The Netherlands - Year-over-year growth 2025-2030 (%)

12.5 Asia - Market size and forecast 2025-2030

Chart on Asia - Market size and forecast 2025-2030 ($ million)
Data Table on Asia - Market size and forecast 2025-2030 ($ million)
Chart on Asia - Year-over-year growth 2025-2030 (%)
Data Table on Asia - Year-over-year growth 2025-2030 (%)
Chart on Regional Comparison - Asia
Data Table on Regional Comparison - Asia

12.5.1 China - Market size and forecast 2025-2030

Chart on China - Market size and forecast 2025-2030 ($ million)
Data Table on China - Market size and forecast 2025-2030 ($ million)
Chart on China - Year-over-year growth 2025-2030 (%)
Data Table on China - Year-over-year growth 2025-2030 (%)

12.5.2 Japan - Market size and forecast 2025-2030

Chart on Japan - Market size and forecast 2025-2030 ($ million)
Data Table on Japan - Market size and forecast 2025-2030 ($ million)
Chart on Japan - Year-over-year growth 2025-2030 (%)
Data Table on Japan - Year-over-year growth 2025-2030 (%)

12.5.3 India - Market size and forecast 2025-2030

Chart on India - Market size and forecast 2025-2030 ($ million)
Data Table on India - Market size and forecast 2025-2030 ($ million)
Chart on India - Year-over-year growth 2025-2030 (%)
Data Table on India - Year-over-year growth 2025-2030 (%)

12.5.4 South Korea - Market size and forecast 2025-2030

Chart on South Korea - Market size and forecast 2025-2030 ($ million)
Data Table on South Korea - Market size and forecast 2025-2030 ($ million)
Chart on South Korea - Year-over-year growth 2025-2030 (%)
Data Table on South Korea - Year-over-year growth 2025-2030 (%)

12.5.5 Singapore - Market size and forecast 2025-2030

Chart on Singapore - Market size and forecast 2025-2030 ($ million)
Data Table on Singapore - Market size and forecast 2025-2030 ($ million)
Chart on Singapore - Year-over-year growth 2025-2030 (%)
Data Table on Singapore - Year-over-year growth 2025-2030 (%)

12.5.6 Indonesia - Market size and forecast 2025-2030

Chart on Indonesia - Market size and forecast 2025-2030 ($ million)
Data Table on Indonesia - Market size and forecast 2025-2030 ($ million)
Chart on Indonesia - Year-over-year growth 2025-2030 (%)
Data Table on Indonesia - Year-over-year growth 2025-2030 (%)

12.6 Rest of World (ROW) - Market size and forecast 2025-2030

Chart on Rest of World (ROW) - Market size and forecast 2025-2030 ($ million)
Data Table on Rest of World (ROW) - Market size and forecast 2025-2030 ($ million)
Chart on Rest of World (ROW) - Year-over-year growth 2025-2030 (%)
Data Table on Rest of World (ROW) - Year-over-year growth 2025-2030 (%)
Chart on Regional Comparison - Rest of World (ROW)
Data Table on Regional Comparison - Rest of World (ROW)

12.6.1 Brazil - Market size and forecast 2025-2030

Chart on Brazil - Market size and forecast 2025-2030 ($ million)
Data Table on Brazil - Market size and forecast 2025-2030 ($ million)
Chart on Brazil - Year-over-year growth 2025-2030 (%)
Data Table on Brazil - Year-over-year growth 2025-2030 (%)

12.6.2 Australia - Market size and forecast 2025-2030

Chart on Australia - Market size and forecast 2025-2030 ($ million)
Data Table on Australia - Market size and forecast 2025-2030 ($ million)
Chart on Australia - Year-over-year growth 2025-2030 (%)
Data Table on Australia - Year-over-year growth 2025-2030 (%)

12.6.3 Saudi Arabia - Market size and forecast 2025-2030

Chart on Saudi Arabia - Market size and forecast 2025-2030 ($ million)
Data Table on Saudi Arabia - Market size and forecast 2025-2030 ($ million)
Chart on Saudi Arabia - Year-over-year growth 2025-2030 (%)
Data Table on Saudi Arabia - Year-over-year growth 2025-2030 (%)

12.6.4 UAE - Market size and forecast 2025-2030

Chart on UAE - Market size and forecast 2025-2030 ($ million)
Data Table on UAE - Market size and forecast 2025-2030 ($ million)
Chart on UAE - Year-over-year growth 2025-2030 (%)
Data Table on UAE - Year-over-year growth 2025-2030 (%)

12.6.5 Argentina - Market size and forecast 2025-2030

Chart on Argentina - Market size and forecast 2025-2030 ($ million)
Data Table on Argentina - Market size and forecast 2025-2030 ($ million)
Chart on Argentina - Year-over-year growth 2025-2030 (%)
Data Table on Argentina - Year-over-year growth 2025-2030 (%)

12.6.6 South Africa - Market size and forecast 2025-2030

Chart on South Africa - Market size and forecast 2025-2030 ($ million)
Data Table on South Africa - Market size and forecast 2025-2030 ($ million)
Chart on South Africa - Year-over-year growth 2025-2030 (%)
Data Table on South Africa - Year-over-year growth 2025-2030 (%)

12.6.7 Colombia - Market size and forecast 2025-2030

Chart on Colombia - Market size and forecast 2025-2030 ($ million)
Data Table on Colombia - Market size and forecast 2025-2030 ($ million)
Chart on Colombia - Year-over-year growth 2025-2030 (%)
Data Table on Colombia - Year-over-year growth 2025-2030 (%)

12.6.8 Egypt - Market size and forecast 2025-2030

Chart on Egypt - Market size and forecast 2025-2030 ($ million)
Data Table on Egypt - Market size and forecast 2025-2030 ($ million)
Chart on Egypt - Year-over-year growth 2025-2030 (%)
Data Table on Egypt - Year-over-year growth 2025-2030 (%)

12.7 Market opportunity by geography

Market opportunity by geography ($ million)
Data Tables on Market opportunity by geography ($ million)

13. Drivers, Challenges, and Opportunity

13.1 Market drivers

Rising incidence rates of adverse drug events
Favorable government regulations and policies
Increasing approvals of new molecules and biosimilars

13.2 Market challenges

High cost of ownership, installation, and maintenance
Concerns related to data safety and security
Issues related to system integration

13.3 Impact of drivers and challenges

Impact of drivers and challenges in 2025 and 2030

13.4 Market opportunities

Integration of AI in pharmacovigilance
Outsourcing pharmacovigilance and drug safety research to contract research organization (CROs)
Extensive adoption of cloud technologies in pharmaceutical manufacturing and testing

14. Competitive Landscape

14.1 Overview

14.2

Overview on criticality of inputs and factors of differentiation

14.3 Landscape disruption

Overview on factors of disruption

14.4 Industry risks

Impact of key risks on business

15. Competitive Analysis

15.1 Companies profiled

Companies covered

15.2 Company ranking index

15.3 Market positioning of companies

Matrix on companies position and classification

15.4 AB Cube SARL

AB Cube SARL - Overview
AB Cube SARL - Product / Service
AB Cube SARL - Key offerings
SWOT

15.5 Accenture PLC

Accenture PLC - Overview
Accenture PLC - Business segments
Accenture PLC - Key news
Accenture PLC - Key offerings
Accenture PLC - Segment focus
SWOT

15.6 ArisGlobal LLC

ArisGlobal LLC - Overview
ArisGlobal LLC - Product / Service
ArisGlobal LLC - Key offerings
SWOT

15.7 BaseCon AS

BaseCon AS - Overview
BaseCon AS - Product / Service
BaseCon AS - Key offerings
SWOT

15.8 Cognizant Technology Solution

Cognizant Technology Solution - Overview
Cognizant Technology Solution - Business segments
Cognizant Technology Solution - Key news
Cognizant Technology Solution - Key offerings
Cognizant Technology Solution - Segment focus
SWOT

15.9 Ennov SAS

Ennov SAS - Overview
Ennov SAS - Product / Service
Ennov SAS - Key offerings
SWOT

15.10 EXTEDO GmbH

EXTEDO GmbH - Overview
EXTEDO GmbH - Product / Service
EXTEDO GmbH - Key offerings
SWOT

15.11 Honeywell International Inc.

Honeywell International Inc. - Overview
Honeywell International Inc. - Business segments
Honeywell International Inc. - Key news
Honeywell International Inc. - Key offerings
Honeywell International Inc. - Segment focus
SWOT

15.12 Indegene Pvt. Ltd.

Indegene Pvt. Ltd. - Overview
Indegene Pvt. Ltd. - Product / Service
Indegene Pvt. Ltd. - Key offerings
SWOT

15.13 IQVIA Holdings Inc.

IQVIA Holdings Inc. - Overview
IQVIA Holdings Inc. - Business segments
IQVIA Holdings Inc. - Key offerings
IQVIA Holdings Inc. - Segment focus
SWOT

15.14 Oracle Corp.

Oracle Corp. - Overview
Oracle Corp. - Business segments
Oracle Corp. - Key news
Oracle Corp. - Key offerings
Oracle Corp. - Segment focus
SWOT

15.15 Pegasystems Inc.

Pegasystems Inc. - Overview
Pegasystems Inc. - Product / Service
Pegasystems Inc. - Key offerings
SWOT

15.16 Sarjen Systems Pvt. Ltd.

Sarjen Systems Pvt. Ltd. - Overview
Sarjen Systems Pvt. Ltd. - Product / Service
Sarjen Systems Pvt. Ltd. - Key offerings
SWOT

15.17 United BioSource LLC

United BioSource LLC - Overview
United BioSource LLC - Product / Service
United BioSource LLC - Key offerings
SWOT

15.18 Wipro Ltd.

Wipro Ltd. - Overview
Wipro Ltd. - Business segments
Wipro Ltd. - Key news
Wipro Ltd. - Key offerings
Wipro Ltd. - Segment focus
SWOT

16. Appendix

16.1 Scope of the report

Market definition
Objectives
Notes and caveats

16.2 Inclusions and exclusions checklist

Inclusions checklist
Exclusions checklist

16.3 Currency conversion rates for US$

16.4 Research methodology

16.5 Data procurement

Information sources

16.6 Data validation

16.7 Validation techniques employed for market sizing

16.8 Data synthesis

16.9 360 degree market analysis

16.10 List of abbreviations

Research Methodology

Technavio presents a detailed picture of the market by way of study, synthesis, and summation of data from multiple sources. The analysts have presented the various facets of the market with a particular focus on identifying the key industry influencers. The data thus presented is comprehensive, reliable, and the result of extensive research, both primary and secondary.

INFORMATION SOURCES

Primary sources

  • Manufacturers and suppliers
  • Channel partners
  • Industry experts
  • Strategic decision makers

Secondary sources

  • Industry journals and periodicals
  • Government data
  • Financial reports of key industry players
  • Historical data
  • Press releases

DATA ANALYSIS

Data Synthesis

  • Collation of data
  • Estimation of key figures
  • Analysis of derived insights

Data Validation

  • Triangulation with data models
  • Reference against proprietary databases
  • Corroboration with industry experts

REPORT WRITING

Qualitative

  • Market drivers
  • Market challenges
  • Market trends
  • Five forces analysis

Quantitative

  • Market size and forecast
  • Market segmentation
  • Geographical insights
  • Competitive landscape

Interested in this report?

Get your sample now to see our research methodology and insights!

Download Now

Frequently Asked Questions

Pharmacovigilance And Drug Safety Software market growth will increase by USD 84.8 million during 2026-2030.

The Pharmacovigilance And Drug Safety Software market is expected to grow at a CAGR of 7.3% during 2026-2030.

Pharmacovigilance And Drug Safety Software market is segmented by End-user (Pharmaceutical and biotechnology companies, Contract research organization, Business process outsourcing) Deployment (Cloud-based, On-premises) Application (Post-marketing surveillance, Clinical trials, Regulatory compliance)

AB Cube SARL, Accenture PLC, ArisGlobal LLC, BaseCon AS, Clarivate PLC, Cognizant Technology Solution, Ennov SAS, EXTEDO GmbH, Honeywell International Inc., Indegene Pvt. Ltd., IQVIA Holdings Inc., Max Application Srl, Oracle Corp., Pegasystems Inc., Sarjen Systems Pvt. Ltd., TriNetX LLC, United BioSource LLC, Veeva Systems Inc., Wipro Ltd. are a few of the key vendors in the Pharmacovigilance And Drug Safety Software market.

North America will register the highest growth rate of 39.2% among the other regions. Therefore, the Pharmacovigilance And Drug Safety Software market in North America is expected to garner significant business opportunities for the vendors during the forecast period.

US, Canada, Mexico, Germany, UK, France, Italy, Spain, The Netherlands, China, Japan, India, South Korea, Singapore, Indonesia, Brazil, Australia, Saudi Arabia, UAE, Argentina, South Africa, Colombia, Egypt

  • Rising incidence rates of adverse drug events is the driving factor this market.

The Pharmacovigilance And Drug Safety Software market vendors should focus on grabbing business opportunities from the End-user segment as it accounted for the largest market share in the base year.