Ploughing And Cultivating Machinery Market Size 2025-2029
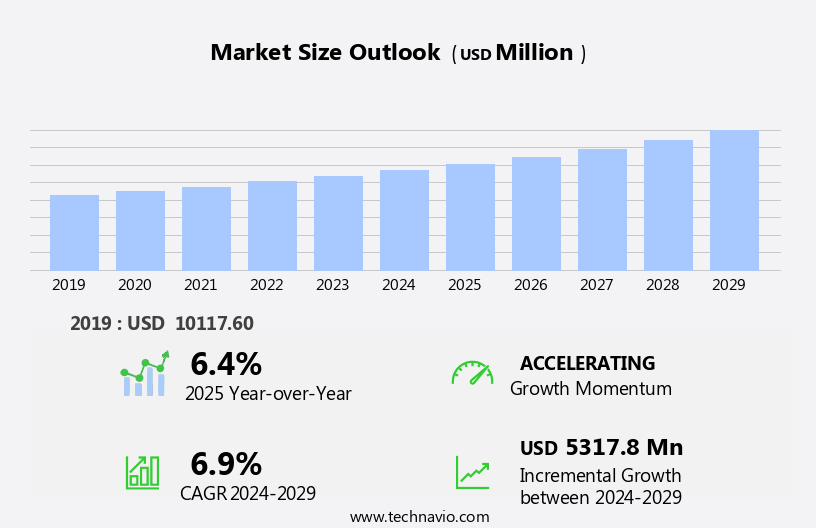
The ploughing and cultivating machinery market size is forecast to increase by USD 5.32 billion at a CAGR of 6.9% between 2024 and 2029.
- The market is experiencing significant growth, driven by increasing government support for agricultural practices worldwide. This trend is particularly prominent in developing countries, where agricultural modernization is a priority. Another key driver is the increasing number of product launches, as manufacturers introduce innovative agricultural machinery solutions to address the high cost of ploughing and cultivating equipment. These new offerings aim to increase efficiency, reduce labor costs, and improve productivity. However, the high cost of agricultural machinery remains a significant challenge for many farmers, particularly small-scale producers. To capitalize on market opportunities and navigate these challenges effectively, companies must focus on offering affordable financing options, leasing schemes, and rental services. Additionally, advancements in agricultural machinery technology, such as precision farming tools, are enhancing productivity and sustainability, further boosting market potential.
- Additionally, partnerships with governments and agricultural organizations can help expand market reach and provide access to valuable resources and expertise. Agricultural drones, precision spraying, and harvesting equipment are further enhancing farm automation and digital agriculture. Overall, the market presents significant opportunities for growth, particularly in emerging economies, as the demand for mechanized farming solutions continues to increase. Companies that can offer innovative, cost-effective solutions and strong partnerships will be best positioned to succeed in this dynamic market.
What will be the Size of the Ploughing And Cultivating Machinery Market during the forecast period?

Request Free Sample
- The market encompasses a range of tractor implements and tillage tools essential for farm equipment operations. This market is characterized by continuous innovation, driven by the need for agricultural productivity, operational efficiency, and environmental sustainability. Trends include the adoption of agricultural robotics for yield monitoring, variable rate application, precision seeding, and soil health management. Fertilizer management, pest control, and crop rotation practices are also key areas of focus. No-till farming and reduced tillage techniques are gaining popularity, necessitating the integration of sensor networks, remote sensing, automated steering, machine vision, field mapping, soil sampling, and crop modeling into farm management software.
- Sustainable farming practices, including regenerative agriculture and climate-smart agriculture, are shaping the market's direction, with a focus on food security, labor cost reduction, resource optimization, and environmental sustainability. Overall, the market is a dynamic and evolving landscape, driven by the intersection of agricultural innovation and technological advancements.
How is this Ploughing And Cultivating Machinery Industry segmented?
The ploughing and cultivating machinery industry research report provides comprehensive data (region-wise segment analysis), with forecasts and estimates in "USD million" for the period 2025-2029, as well as historical data from 2019-2023 for the following segments.
- Type
- P and C parts
- Planters transplanters and seeders
- Weeders and hoes
- Cultivation machines
- Ploughs
- Technology
- Manual
- Semi automatic
- Automatic
- End-User
- Small-Scale Farmers
- Large-Scale Farmers
- Agricultural Contractors
- Power Source
- Distribution Channel
- Online
- Offline
- Direct Sales
- Application
- Soil Loosening
- Clod Size Reduction
- Clod Sorting
- Geography
- APAC
- China
- India
- Japan
- South Korea
- Europe
- North America
- South America
- Middle East and Africa
By Type Insights
The P and C parts segment is estimated to witness significant growth during the forecast period. The market has experienced consistent growth due to various factors. Government initiatives offering financial incentives for farmers to invest in agricultural equipment have been a significant driving force. Furthermore, the rise of contract farming has expanded market opportunities. Key market growth drivers include the increasing agricultural mechanization and farmers' income growth. Favorable climate conditions for food production, coupled with accessible government loans for all income levels, are also expected to support market expansion. Technologically advanced agricultural technologies, such as autonomous tractors and drones, which facilitate cost-effective food production to meet increasing demand, offer promising growth prospects for the P and C parts segment during the forecast period.
The adoption of precision agriculture, GPS guidance systems, data analytics, and smart technologies in farming operations enhances field efficiency, crop yields, and resource utilization. Additionally, sustainable agriculture practices, including conservation tillage and soil erosion prevention, contribute to market growth. Equipment maintenance solutions and agricultural mechanization have become essential to address labor shortages and improve farming productivity. The integration of artificial intelligence, machine learning, predictive analytics, and real-time monitoring in farming solutions further enhances efficiency and sustainability.

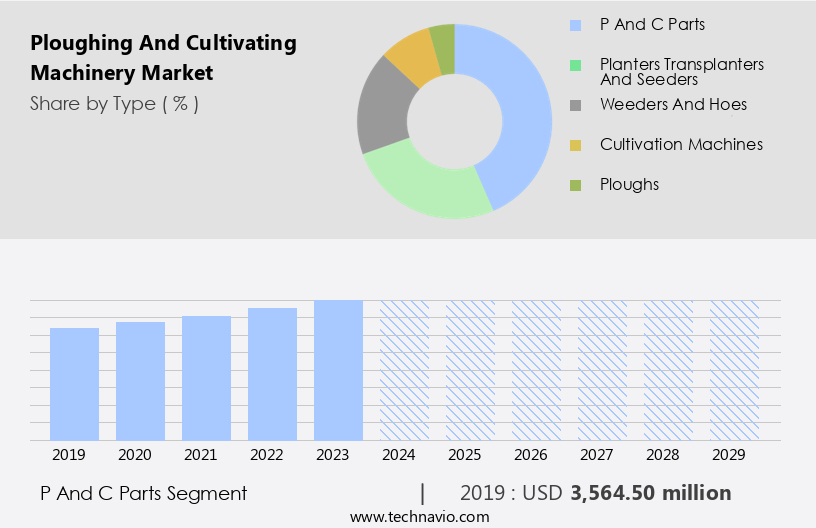
Get a glance at the market report of share of various segments Request Free Sample
The P and C parts segment was valued at USD 3.56 billion in 2019 and showed a gradual increase during the forecast period.
Regional Analysis
APAC is estimated to contribute 34% to the growth of the global market during the forecast period. Technavio's analysts have elaborately explained the regional trends and drivers that shape the market during the forecast period.

For more insights on the market size of various regions, Request Free Sample
The market in the APAC region is experiencing significant growth, primarily driven by major markets such as China, India, Japan, and Australia. Government initiatives promoting sustainable agricultural practices are a significant factor fueling this expansion. In India, the government and international organizations are working together to improve soil health, water management, irrigation, seed varieties, pest management, credit financing, and farm mechanization. Furthermore, various governments in the region offer subsidies for purchasing agricultural equipment, including ploughing and cultivating machinery. Notable initiatives include India's Sub-Mission on Agriculture Mechanization (SMAM) and Indonesia's Agriculture Work Plan Document. Precision agriculture, GPS guidance systems, data analytics, autonomous machinery, and semi-autonomous machinery are increasingly adopted to enhance farming efficiency and productivity.
Soil preparation, crop yield, and resource efficiency are key benefits of these advanced technologies. Plough design, cultivator types, seedbed creation, soil aeration, weed control, nutrient mixing, and precision farming are essential aspects of ploughing and cultivating machinery. Equipment durability, soil structure, and farm productivity are crucial factors in the selection and implementation of these solutions. Key technologies include GPS-enabled equipment, soil sampling, soil moisture sensors, and equipment maintenance systems. The labor crisis and the need for skilled labor are driving the adoption of farm mechanization. The market is expected to grow due to increasing food consumption and food storage output, government benefits, and the availability of high-powered cultivators, self-cultivators, two-wheel tractors, and four-wheel tractors.
Clod size reduction, clod sorting, plant roots, soil drainage, friable soil, air and nutrients, moisture and nutrients, and smart farming are essential components of efficient farming. Ploughing systems, cultivator blades, land cultivation, and soil turnover are fundamental farming solutions.
Market Dynamics
Our researchers analyzed the data with 2024 as the base year, along with the key drivers, trends, and challenges. A holistic analysis of drivers will help companies refine their marketing strategies to gain a competitive advantage.
What are the key market drivers leading to the rise in the adoption of Ploughing And Cultivating Machinery Industry?
- Growing government support for agricultural practices globally is the key driver of the market. Global agricultural organizations and governments are advocating for productivity enhancements through initiatives that support farming businesses. In the European Union (EU), young farmers under the age of 40, upon application, are eligible for funding to establish farming operations. This financial assistance is granted for up to five years following the commencement of farming activities. Young farmers also receive priority for direct payment entitlements from national or regional reserves.
- These incentives motivate EU farmers to invest in ploughing and cultivating machinery, thereby increasing productivity. Similarly, the Canadian Agricultural Loans Act (CALA) Program, administered by the Government of Canada, offers financial assistance to farmers, enabling them to invest in essential machinery and technology for their farming businesses.
What are the market trends shaping the Ploughing And Cultivating Machinery Industry?
- An increasing number of product launches is the upcoming market trend. The market is witnessing growth due to companies' strategic initiatives to expand their product offerings. New product launches enable market participants to boost sales and secure a larger market share. To cater to a wider customer base, companies are introducing machinery variants with advanced features and patented innovations. For instance, in 2023, Mahindra and Mahindra Ltd. Introduced the Mahindra OJA series, a lineup of lightweight 4WD tractors.
- This innovative range consists of seven models, from 20HP to 40HP, and incorporates advanced technology for heightened productivity and efficiency. These developments underscore the competitive landscape in the market.
What challenges does the Ploughing and Cultivating Machinery Industry face during its growth?
- The high cost of ploughing and cultivating machinery is a key challenge affecting the industry's growth. Ploughing and cultivating machinery play a crucial role in agricultural production, particularly during the sowing season. However, the significant investment required for this equipment, which is only useful during specific periods, poses challenges for small and medium-scale farmers with limited financial resources. Air seeders, a type of ploughing and cultivating machinery, are suitable for large, consolidated agricultural lands, further limiting their applicability. The high cost and seasonal utility of ploughing and cultivating machinery make it less prioritized compared to other agricultural equipment with year-round functionality.
- Farmers in rural areas of developing countries, in particular, face budget constraints when acquiring new agricultural equipment. Despite its importance, the limited functionality of ploughing and cultivating machinery can make it a less essential investment for farmers.
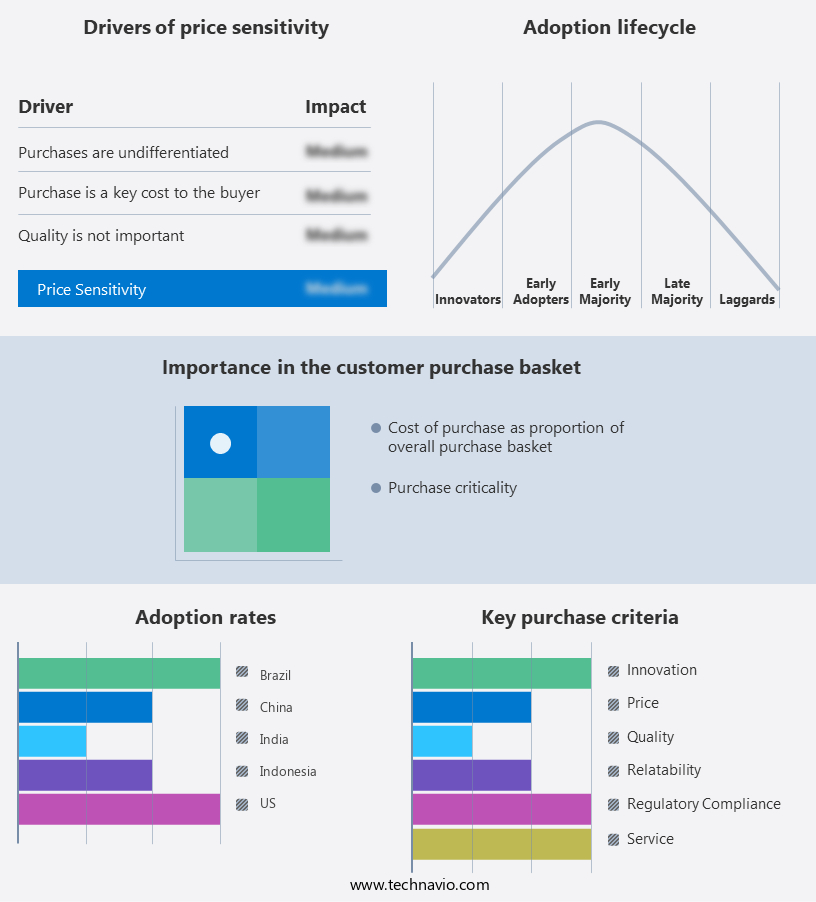
Exclusive Customer Landscape
The ploughing and cultivating machinery market forecasting report includes the adoption lifecycle of the market, covering from the innovator's stage to the laggard's stage. It focuses on adoption rates in different regions based on penetration. Furthermore, the ploughing and cultivating machinery market report also includes key purchase criteria and drivers of price sensitivity to help companies evaluate and develop their market growth analysis strategies.

Customer Landscape
Key Companies & Market Insights
Companies are implementing various strategies, such as strategic alliances, ploughing and cultivating machinery market forecast, partnerships, mergers and acquisitions, geographical expansion, and product/service launches, to enhance their presence in the industry.
AGCO Corp. - The company offers ploughing and cultivating machinery that provides farmers with the highest level of productivity in large acreage enterprises.
The industry research and growth report includes detailed analyses of the competitive landscape of the market and information about key companies, including:
- AGCO Corp.
- Alamo Group Inc.
- BEDNAR FMT sro
- Bucher Industries AG
- CLAAS KGaA mBH
- CNH Industrial NV
- Deere and Co.
- Dewulf
- Great Plains Manufacturing Inc.
- Gregoire Besson SAS
- HORSCH Maschinen GmbH
- Kubota Corp.
- Landoll Co. LLC
- LEMKEN GmbH and Co. KG
- Mahindra and Mahindra Ltd.
- Mfg. Co. Inc.
- Opico
- Sonalika International Tractors Ltd.
- Titan Machinery Inc.
- Yanmar Holdings Co. Ltd.
Qualitative and quantitative analysis of companies has been conducted to help clients understand the wider business environment as well as the strengths and weaknesses of key industry players. Data is qualitatively analyzed to categorize companies as pure play, category-focused, industry-focused, and diversified; it is quantitatively analyzed to categorize companies as dominant, leading, strong, tentative, and weak.
Research Analyst Overview
The market encompasses a range of advanced technologies designed to optimize field operations and enhance agricultural productivity. This sector is characterized by continuous innovation, driven by the need for resource efficiency, conservation tillage, and sustainable agriculture. Precision agriculture, fueled by GPS guidance systems and data analytics, plays a significant role in this market. Smart technologies, including autonomous and semi-autonomous machinery, enable farmers to make informed decisions based on real-time monitoring and predictive analytics. These advancements contribute to improved crop yields, soil health, and overall farming efficiency. Soil preparation is a critical aspect of the market. Primary tillage methods, such as moldboard plows, disk plows, and chisel plows, are used for soil loosening, clod size reduction, and clod sorting.
These processes are essential for creating a suitable seedbed and ensuring optimal conditions for plant growth. Cultivating weeds and uprooting unwanted vegetation is another essential function of ploughing and cultivating machinery. This process contributes to better nutrient availability, improved soil permeability, and reduced soil erosion. Advanced plough designs and cultivator types cater to various soil types and farming conditions, ensuring effective weed control and soil aeration. Equipment maintenance is a crucial factor in the market. High-powered cultivators, self-cultivators, two-wheel tractors, and four-wheel tractors all require support systems for efficient and reliable operation. This includes regular servicing, timely replacement of worn parts, and the implementation of preventative maintenance strategies.
The market is driven by the need for agricultural mechanization and the labor crisis in the agricultural sector. With increasing food consumption and food storage output, there is a growing demand for machinery that can help farmers meet these demands while adhering to sustainable practices. Government benefits and incentives for the adoption of advanced farming solutions further boost market growth. The market is a dynamic and innovative sector that plays a vital role in modern agriculture. With a focus on precision farming, sustainable practices, and equipment durability, this market is poised for continued growth and development. Farmers and agricultural professionals rely on advanced ploughing and cultivating machinery to optimize field operations, enhance crop yields, and promote sustainable agriculture.
|
Market Scope
|
|
Report Coverage
|
Details
|
|
Page number
|
197
|
|
Base year
|
2024
|
|
Historic period
|
2019-2023 |
|
Forecast period
|
2025-2029
|
|
Growth momentum & CAGR
|
Accelerate at a CAGR of 6.9%
|
|
Market growth 2025-2029
|
USD 5.32 billion
|
|
Market structure
|
Fragmented
|
|
YoY growth 2024-2025(%)
|
6.4
|
|
Key countries
|
US, China, Germany, Japan, India, UK, South Korea, Italy, France, and Canada
|
|
Competitive landscape
|
Leading Companies, Market Positioning of Companies, Competitive Strategies, and Industry Risks
|
Request Free Sample
What are the Key Data Covered in this Ploughing And Cultivating Machinery Market Research and Growth Report?
- CAGR of the Ploughing And Cultivating Machinery industry during the forecast period
- Detailed information on factors that will drive the growth and forecasting between 2025 and 2029
- Precise estimation of the size of the market and its contribution of the industry in focus to the parent market
- Accurate predictions about upcoming growth and trends and changes in consumer behaviour
- Growth of the market across APAC, Europe, North America, South America, and Middle East and Africa
- Thorough analysis of the market's competitive landscape and detailed information about companies
- Comprehensive analysis of factors that will challenge the ploughing and cultivating machinery market growth and forecasting
We can help! Our analysts can customize this ploughing and cultivating machinery market research report to meet your requirements.
Get in touch
1 Executive Summary
- 1.1 Market overview
- Executive Summary - Chart on Market Overview
- Executive Summary - Data Table on Market Overview
- Executive Summary - Chart on Global Market Characteristics
- Executive Summary - Chart on Market by Geography
- Executive Summary - Chart on Market Segmentation by Type
- Executive Summary - Chart on Market Segmentation by Technology
- Executive Summary - Chart on Incremental Growth
- Executive Summary - Data Table on Incremental Growth
- Executive Summary - Chart on Company Market Positioning
2 Technavio Analysis
- 2.1 Analysis of price sensitivity, lifecycle, customer purchase basket, adoption rates, and purchase criteria
- Analysis of price sensitivity, lifecycle, customer purchase basket, adoption rates, and purchase criteria
- 2.2 Criticality of inputs and Factors of differentiation
- Overview on criticality of inputs and factors of differentiation
- 2.3 Factors of disruption
- Overview on factors of disruption
- 2.4 Impact of drivers and challenges
- Impact of drivers and challenges in 2024 and 2029
3 Market Landscape
- 3.1 Market ecosystem
- Parent Market
- Data Table on - Parent Market
- 3.2 Market characteristics
- Market characteristics analysis
4 Market Sizing
- 4.1 Market definition
- Offerings of companies included in the market definition
- 4.2 Market segment analysis
- 4.4 Market outlook: Forecast for 2024-2029
- Chart on Global - Market size and forecast 2024-2029 ($ million)
- Data Table on Global - Market size and forecast 2024-2029 ($ million)
- Chart on Global Market: Year-over-year growth 2024-2029 (%)
- Data Table on Global Market: Year-over-year growth 2024-2029 (%)
5 Historic Market Size
- 5.1 Global Ploughing And Cultivating Machinery Market 2019 - 2023
- Historic Market Size - Data Table on Global Ploughing And Cultivating Machinery Market 2019 - 2023 ($ million)
- 5.2 Type segment analysis 2019 - 2023
- Historic Market Size - Type Segment 2019 - 2023 ($ million)
- 5.3 Technology segment analysis 2019 - 2023
- Historic Market Size - Technology Segment 2019 - 2023 ($ million)
- 5.4 Geography segment analysis 2019 - 2023
- Historic Market Size - Geography Segment 2019 - 2023 ($ million)
- 5.5 Country segment analysis 2019 - 2023
- Historic Market Size - Country Segment 2019 - 2023 ($ million)
6 Qualitative Analysis
- 6.1 Impact of AI in global ploughing and cultivating machinery market
7 Five Forces Analysis
- 7.1 Five forces summary
- Five forces analysis - Comparison between 2024 and 2029
- 7.2 Bargaining power of buyers
- Bargaining power of buyers - Impact of key factors 2024 and 2029
- 7.3 Bargaining power of suppliers
- Bargaining power of suppliers - Impact of key factors in 2024 and 2029
- 7.4 Threat of new entrants
- Threat of new entrants - Impact of key factors in 2024 and 2029
- 7.5 Threat of substitutes
- Threat of substitutes - Impact of key factors in 2024 and 2029
- 7.6 Threat of rivalry
- Threat of rivalry - Impact of key factors in 2024 and 2029
- 7.7 Market condition
- Chart on Market condition - Five forces 2024 and 2029
8 Market Segmentation by Type
- 8.1 Market segments
- Chart on Type - Market share (2024-2029) (%)
- Data Table on Type - Market share (2024-2029) (%)
- 8.2 Comparison by Type
- Chart on Comparison by Type
- Data Table on Comparison by Type
- 8.3 P and C parts - Market size and forecast (2024-2029)
- Chart on P and C parts - Market size and forecast (2024-2029) ($ million)
- Data Table on P and C parts - Market size and forecast (2024-2029) ($ million)
- Chart on P and C parts - Year-over-year growth (2024-2029) (%)
- Data Table on P and C parts - Year-over-year growth (2024-2029) (%)
- 8.4 Planters transplanters and seeders - Market size and forecast (2024-2029)
- Chart on Planters transplanters and seeders - Market size and forecast (2024-2029) ($ million)
- Data Table on Planters transplanters and seeders - Market size and forecast (2024-2029) ($ million)
- Chart on Planters transplanters and seeders - Year-over-year growth (2024-2029) (%)
- Data Table on Planters transplanters and seeders - Year-over-year growth (2024-2029) (%)
- 8.5 Weeders and hoes - Market size and forecast (2024-2029)
- Chart on Weeders and hoes - Market size and forecast (2024-2029) ($ million)
- Data Table on Weeders and hoes - Market size and forecast (2024-2029) ($ million)
- Chart on Weeders and hoes - Year-over-year growth (2024-2029) (%)
- Data Table on Weeders and hoes - Year-over-year growth (2024-2029) (%)
- 8.6 Cultivation machines - Market size and forecast (2024-2029)
- Chart on Cultivation machines - Market size and forecast (2024-2029) ($ million)
- Data Table on Cultivation machines - Market size and forecast (2024-2029) ($ million)
- Chart on Cultivation machines - Year-over-year growth (2024-2029) (%)
- Data Table on Cultivation machines - Year-over-year growth (2024-2029) (%)
- 8.7 Ploughs - Market size and forecast (2024-2029)
- Chart on Ploughs - Market size and forecast (2024-2029) ($ million)
- Data Table on Ploughs - Market size and forecast (2024-2029) ($ million)
- Chart on Ploughs - Year-over-year growth (2024-2029) (%)
- Data Table on Ploughs - Year-over-year growth (2024-2029) (%)
- 8.8 Market opportunity by Type
- Market opportunity by Type ($ million)
- Data Table on Market opportunity by Type ($ million)
9 Market Segmentation by Technology
- 9.1 Market segments
- Chart on Technology - Market share (2024-2029) (%)
- Data Table on Technology - Market share (2024-2029) (%)
- 9.2 Comparison by Technology
- Chart on Comparison by Technology
- Data Table on Comparison by Technology
- 9.3 Manual - Market size and forecast (2024-2029)
- Chart on Manual - Market size and forecast (2024-2029) ($ million)
- Data Table on Manual - Market size and forecast (2024-2029) ($ million)
- Chart on Manual - Year-over-year growth (2024-2029) (%)
- Data Table on Manual - Year-over-year growth (2024-2029) (%)
- 9.4 Semi automatic - Market size and forecast (2024-2029)
- Chart on Semi automatic - Market size and forecast (2024-2029) ($ million)
- Data Table on Semi automatic - Market size and forecast (2024-2029) ($ million)
- Chart on Semi automatic - Year-over-year growth (2024-2029) (%)
- Data Table on Semi automatic - Year-over-year growth (2024-2029) (%)
- 9.5 Automatic - Market size and forecast (2024-2029)
- Chart on Automatic - Market size and forecast (2024-2029) ($ million)
- Data Table on Automatic - Market size and forecast (2024-2029) ($ million)
- Chart on Automatic - Year-over-year growth (2024-2029) (%)
- Data Table on Automatic - Year-over-year growth (2024-2029) (%)
- 9.6 Market opportunity by Technology
- Market opportunity by Technology ($ million)
- Data Table on Market opportunity by Technology ($ million)
10 Market Segmentation by End-User
- 10.1 Market segments
- Chart on End-User - Market share (2024-2029) (%)
- Data Table on End-User - Market share (2024-2029) (%)
- 10.2 Comparison by End-User
- Chart on Comparison by End-User
- Data Table on Comparison by End-User
- 10.3 Small-Scale Farmers - Market size and forecast (2024-2029)
- Chart on Small-Scale Farmers - Market size and forecast (2024-2029) ($ million)
- Data Table on Small-Scale Farmers - Market size and forecast (2024-2029) ($ million)
- Chart on Small-Scale Farmers - Year-over-year growth (2024-2029) (%)
- Data Table on Small-Scale Farmers - Year-over-year growth (2024-2029) (%)
- 10.4 Large-Scale Farmers - Market size and forecast (2024-2029)
- Chart on Large-Scale Farmers - Market size and forecast (2024-2029) ($ million)
- Data Table on Large-Scale Farmers - Market size and forecast (2024-2029) ($ million)
- Chart on Large-Scale Farmers - Year-over-year growth (2024-2029) (%)
- Data Table on Large-Scale Farmers - Year-over-year growth (2024-2029) (%)
- 10.5 Agricultural Contractors - Market size and forecast (2024-2029)
- Chart on Agricultural Contractors - Market size and forecast (2024-2029) ($ million)
- Data Table on Agricultural Contractors - Market size and forecast (2024-2029) ($ million)
- Chart on Agricultural Contractors - Year-over-year growth (2024-2029) (%)
- Data Table on Agricultural Contractors - Year-over-year growth (2024-2029) (%)
- 10.6 Market opportunity by End-User
- Market opportunity by End-User ($ million)
- Data Table on Market opportunity by End-User ($ million)
11 Market Segmentation by Power Source
- 11.1 Market segments
- Chart on Power Source - Market share (2024-2029) (%)
- Data Table on Power Source - Market share (2024-2029) (%)
- 11.2 Comparison by Power Source
- Chart on Comparison by Power Source
- Data Table on Comparison by Power Source
- 11.3 Manual - Market size and forecast (2024-2029)
- Chart on Manual - Market size and forecast (2024-2029) ($ million)
- Data Table on Manual - Market size and forecast (2024-2029) ($ million)
- Chart on Manual - Year-over-year growth (2024-2029) (%)
- Data Table on Manual - Year-over-year growth (2024-2029) (%)
- 11.4 Electric - Market size and forecast (2024-2029)
- Chart on Electric - Market size and forecast (2024-2029) ($ million)
- Data Table on Electric - Market size and forecast (2024-2029) ($ million)
- Chart on Electric - Year-over-year growth (2024-2029) (%)
- Data Table on Electric - Year-over-year growth (2024-2029) (%)
- 11.5 Diesel - Market size and forecast (2024-2029)
- Chart on Diesel - Market size and forecast (2024-2029) ($ million)
- Data Table on Diesel - Market size and forecast (2024-2029) ($ million)
- Chart on Diesel - Year-over-year growth (2024-2029) (%)
- Data Table on Diesel - Year-over-year growth (2024-2029) (%)
- 11.6 Market opportunity by Power Source
- Market opportunity by Power Source ($ million)
- Data Table on Market opportunity by Power Source ($ million)
12 Market Segmentation by Distribution Channel
- 12.1 Market segments
- Chart on Distribution Channel - Market share (2024-2029) (%)
- Data Table on Distribution Channel - Market share (2024-2029) (%)
- 12.2 Comparison by Distribution Channel
- Chart on Comparison by Distribution Channel
- Data Table on Comparison by Distribution Channel
- 12.3 Online - Market size and forecast (2024-2029)
- Chart on Online - Market size and forecast (2024-2029) ($ million)
- Data Table on Online - Market size and forecast (2024-2029) ($ million)
- Chart on Online - Year-over-year growth (2024-2029) (%)
- Data Table on Online - Year-over-year growth (2024-2029) (%)
- 12.4 Offline - Market size and forecast (2024-2029)
- Chart on Offline - Market size and forecast (2024-2029) ($ million)
- Data Table on Offline - Market size and forecast (2024-2029) ($ million)
- Chart on Offline - Year-over-year growth (2024-2029) (%)
- Data Table on Offline - Year-over-year growth (2024-2029) (%)
- 12.5 Direct Sales - Market size and forecast (2024-2029)
- Chart on Direct Sales - Market size and forecast (2024-2029) ($ million)
- Data Table on Direct Sales - Market size and forecast (2024-2029) ($ million)
- Chart on Direct Sales - Year-over-year growth (2024-2029) (%)
- Data Table on Direct Sales - Year-over-year growth (2024-2029) (%)
- 12.6 Market opportunity by Distribution Channel
- Market opportunity by Distribution Channel ($ million)
- Data Table on Market opportunity by Distribution Channel ($ million)
13 Market Segmentation by Application
- 13.1 Market segments
- Chart on Application - Market share (2024-2029) (%)
- Data Table on Application - Market share (2024-2029) (%)
- 13.2 Comparison by Application
- Chart on Comparison by Application
- Data Table on Comparison by Application
- 13.3 Soil Loosening - Market size and forecast (2024-2029)
- Chart on Soil Loosening - Market size and forecast (2024-2029) ($ million)
- Data Table on Soil Loosening - Market size and forecast (2024-2029) ($ million)
- Chart on Soil Loosening - Year-over-year growth (2024-2029) (%)
- Data Table on Soil Loosening - Year-over-year growth (2024-2029) (%)
- 13.4 Clod Size Reduction - Market size and forecast (2024-2029)
- Chart on Clod Size Reduction - Market size and forecast (2024-2029) ($ million)
- Data Table on Clod Size Reduction - Market size and forecast (2024-2029) ($ million)
- Chart on Clod Size Reduction - Year-over-year growth (2024-2029) (%)
- Data Table on Clod Size Reduction - Year-over-year growth (2024-2029) (%)
- 13.5 Clod Sorting - Market size and forecast (2024-2029)
- Chart on Clod Sorting - Market size and forecast (2024-2029) ($ million)
- Data Table on Clod Sorting - Market size and forecast (2024-2029) ($ million)
- Chart on Clod Sorting - Year-over-year growth (2024-2029) (%)
- Data Table on Clod Sorting - Year-over-year growth (2024-2029) (%)
- 13.6 Market opportunity by Application
- Market opportunity by Application ($ million)
- Data Table on Market opportunity by Application ($ million)
14 Customer Landscape
- 14.1 Customer landscape overview
- Analysis of price sensitivity, lifecycle, customer purchase basket, adoption rates, and purchase criteria
15 Geographic Landscape
- 15.1 Geographic segmentation
- Chart on Market share by geography 2024-2029 (%)
- Data Table on Market share by geography 2024-2029 (%)
- 15.2 Geographic comparison
- Chart on Geographic comparison
- Data Table on Geographic comparison
- 15.3 APAC - Market size and forecast 2024-2029
- Chart on APAC - Market size and forecast 2024-2029 ($ million)
- Data Table on APAC - Market size and forecast 2024-2029 ($ million)
- Chart on APAC - Year-over-year growth 2024-2029 (%)
- Data Table on APAC - Year-over-year growth 2024-2029 (%)
- 15.4 Europe - Market size and forecast 2024-2029
- Chart on Europe - Market size and forecast 2024-2029 ($ million)
- Data Table on Europe - Market size and forecast 2024-2029 ($ million)
- Chart on Europe - Year-over-year growth 2024-2029 (%)
- Data Table on Europe - Year-over-year growth 2024-2029 (%)
- 15.5 North America - Market size and forecast 2024-2029
- Chart on North America - Market size and forecast 2024-2029 ($ million)
- Data Table on North America - Market size and forecast 2024-2029 ($ million)
- Chart on North America - Year-over-year growth 2024-2029 (%)
- Data Table on North America - Year-over-year growth 2024-2029 (%)
- 15.6 South America - Market size and forecast 2024-2029
- Chart on South America - Market size and forecast 2024-2029 ($ million)
- Data Table on South America - Market size and forecast 2024-2029 ($ million)
- Chart on South America - Year-over-year growth 2024-2029 (%)
- Data Table on South America - Year-over-year growth 2024-2029 (%)
- 15.7 Middle East and Africa - Market size and forecast 2024-2029
- Chart on Middle East and Africa - Market size and forecast 2024-2029 ($ million)
- Data Table on Middle East and Africa - Market size and forecast 2024-2029 ($ million)
- Chart on Middle East and Africa - Year-over-year growth 2024-2029 (%)
- Data Table on Middle East and Africa - Year-over-year growth 2024-2029 (%)
- 15.8 US - Market size and forecast 2024-2029
- Chart on US - Market size and forecast 2024-2029 ($ million)
- Data Table on US - Market size and forecast 2024-2029 ($ million)
- Chart on US - Year-over-year growth 2024-2029 (%)
- Data Table on US - Year-over-year growth 2024-2029 (%)
- 15.9 China - Market size and forecast 2024-2029
- Chart on China - Market size and forecast 2024-2029 ($ million)
- Data Table on China - Market size and forecast 2024-2029 ($ million)
- Chart on China - Year-over-year growth 2024-2029 (%)
- Data Table on China - Year-over-year growth 2024-2029 (%)
- 15.10 Japan - Market size and forecast 2024-2029
- Chart on Japan - Market size and forecast 2024-2029 ($ million)
- Data Table on Japan - Market size and forecast 2024-2029 ($ million)
- Chart on Japan - Year-over-year growth 2024-2029 (%)
- Data Table on Japan - Year-over-year growth 2024-2029 (%)
- 15.11 Germany - Market size and forecast 2024-2029
- Chart on Germany - Market size and forecast 2024-2029 ($ million)
- Data Table on Germany - Market size and forecast 2024-2029 ($ million)
- Chart on Germany - Year-over-year growth 2024-2029 (%)
- Data Table on Germany - Year-over-year growth 2024-2029 (%)
- 15.12 India - Market size and forecast 2024-2029
- Chart on India - Market size and forecast 2024-2029 ($ million)
- Data Table on India - Market size and forecast 2024-2029 ($ million)
- Chart on India - Year-over-year growth 2024-2029 (%)
- Data Table on India - Year-over-year growth 2024-2029 (%)
- 15.13 UK - Market size and forecast 2024-2029
- Chart on UK - Market size and forecast 2024-2029 ($ million)
- Data Table on UK - Market size and forecast 2024-2029 ($ million)
- Chart on UK - Year-over-year growth 2024-2029 (%)
- Data Table on UK - Year-over-year growth 2024-2029 (%)
- 15.14 South Korea - Market size and forecast 2024-2029
- Chart on South Korea - Market size and forecast 2024-2029 ($ million)
- Data Table on South Korea - Market size and forecast 2024-2029 ($ million)
- Chart on South Korea - Year-over-year growth 2024-2029 (%)
- Data Table on South Korea - Year-over-year growth 2024-2029 (%)
- 15.15 France - Market size and forecast 2024-2029
- Chart on France - Market size and forecast 2024-2029 ($ million)
- Data Table on France - Market size and forecast 2024-2029 ($ million)
- Chart on France - Year-over-year growth 2024-2029 (%)
- Data Table on France - Year-over-year growth 2024-2029 (%)
- 15.16 Italy - Market size and forecast 2024-2029
- Chart on Italy - Market size and forecast 2024-2029 ($ million)
- Data Table on Italy - Market size and forecast 2024-2029 ($ million)
- Chart on Italy - Year-over-year growth 2024-2029 (%)
- Data Table on Italy - Year-over-year growth 2024-2029 (%)
- 15.17 Canada - Market size and forecast 2024-2029
- Chart on Canada - Market size and forecast 2024-2029 ($ million)
- Data Table on Canada - Market size and forecast 2024-2029 ($ million)
- Chart on Canada - Year-over-year growth 2024-2029 (%)
- Data Table on Canada - Year-over-year growth 2024-2029 (%)
- 15.18 Market opportunity by geography
- Market opportunity by geography ($ million)
- Data Tables on Market opportunity by geography ($ million)
- 15.19 Rest of World (ROW) - Market size and forecast (2024-2029)
- Chart on Rest of World (ROW) - Market size and forecast (2024-2029) ($ million)
- Data Table on Rest of World (ROW) - Market size and forecast (2024-2029) ($ million)
- Chart on Rest of World (ROW) - Year-over-year growth (2024-2029) (%)
- Data Table on Rest of World (ROW) - Year-over-year growth (2024-2029) (%)
16 Drivers, Challenges, and Opportunity/Restraints
- 16.3 Impact of drivers and challenges
- Impact of drivers and challenges in 2024 and 2029
- 16.4 Market opportunities/restraints
17 Competitive Landscape
- 17.2 Competitive Landscape
- Overview on criticality of inputs and factors of differentiation
- 17.3 Landscape disruption
- Overview on factors of disruption
- 17.4 Industry risks
- Impact of key risks on business
18 Competitive Analysis
- 18.2 Company ranking index
- 18.3 Market positioning of companies
- Matrix on companies position and classification
- 18.4 AGCO Corp.
- AGCO Corp. - Overview
- AGCO Corp. - Business segments
- AGCO Corp. - Key news
- AGCO Corp. - Key offerings
- AGCO Corp. - Segment focus
- SWOT
- 18.5 Alamo Group Inc.
- Alamo Group Inc. - Overview
- Alamo Group Inc. - Business segments
- Alamo Group Inc. - Key news
- Alamo Group Inc. - Key offerings
- Alamo Group Inc. - Segment focus
- SWOT
- 18.6 BEDNAR FMT sro
- BEDNAR FMT sro - Overview
- BEDNAR FMT sro - Product / Service
- BEDNAR FMT sro - Key offerings
- SWOT
- 18.7 Bucher Industries AG
- Bucher Industries AG - Overview
- Bucher Industries AG - Business segments
- Bucher Industries AG - Key offerings
- Bucher Industries AG - Segment focus
- SWOT
- 18.8 CNH Industrial NV
- CNH Industrial NV - Overview
- CNH Industrial NV - Business segments
- CNH Industrial NV - Key offerings
- CNH Industrial NV - Segment focus
- SWOT
- 18.9 Deere and Co.
- Deere and Co. - Overview
- Deere and Co. - Business segments
- Deere and Co. - Key news
- Deere and Co. - Key offerings
- Deere and Co. - Segment focus
- SWOT
- 18.10 Dewulf
- Dewulf - Overview
- Dewulf - Product / Service
- Dewulf - Key offerings
- SWOT
- 18.11 Great Plains Manufacturing Inc.
- Great Plains Manufacturing Inc. - Overview
- Great Plains Manufacturing Inc. - Product / Service
- Great Plains Manufacturing Inc. - Key offerings
- SWOT
- 18.12 Gregoire Besson SAS
- Gregoire Besson SAS - Overview
- Gregoire Besson SAS - Product / Service
- Gregoire Besson SAS - Key offerings
- SWOT
- 18.13 HORSCH Maschinen GmbH
- HORSCH Maschinen GmbH - Overview
- HORSCH Maschinen GmbH - Product / Service
- HORSCH Maschinen GmbH - Key offerings
- SWOT
- 18.14 Kubota Corp.
- Kubota Corp. - Overview
- Kubota Corp. - Business segments
- Kubota Corp. - Key offerings
- Kubota Corp. - Segment focus
- SWOT
- 18.15 Landoll Co. LLC
- Landoll Co. LLC - Overview
- Landoll Co. LLC - Product / Service
- Landoll Co. LLC - Key offerings
- SWOT
- 18.16 LEMKEN GmbH and Co. KG
- LEMKEN GmbH and Co. KG - Overview
- LEMKEN GmbH and Co. KG - Product / Service
- LEMKEN GmbH and Co. KG - Key offerings
- SWOT
- 18.17 Mahindra and Mahindra Ltd.
- Mahindra and Mahindra Ltd. - Overview
- Mahindra and Mahindra Ltd. - Business segments
- Mahindra and Mahindra Ltd. - Key news
- Mahindra and Mahindra Ltd. - Key offerings
- Mahindra and Mahindra Ltd. - Segment focus
- SWOT
- 18.18 Titan Machinery Inc.
- Titan Machinery Inc. - Overview
- Titan Machinery Inc. - Business segments
- Titan Machinery Inc. - Key news
- Titan Machinery Inc. - Key offerings
- Titan Machinery Inc. - Segment focus
- SWOT
19 Appendix
- 19.2 Inclusions and exclusions checklist
- Inclusions checklist
- Exclusions checklist
- 19.3 Currency conversion rates for US$
- Currency conversion rates for US$
- 19.4 Research methodology
- 19.7 Validation techniques employed for market sizing
- Validation techniques employed for market sizing
- 19.9 360 degree market analysis
- 360 degree market analysis
- 19.10 List of abbreviations