Point Of Care (Poc) Ct Imaging Market Analysis North America, Europe, Asia, Rest of World (ROW) - US, Germany, UK, Canada, China - Size and Forecast 2024-2028

Point Of Care (Poc) Ct Imaging Market Analysis North America, Europe, Asia, Rest of World (ROW) - US, Germany, UK, Canada, China - Size and Forecast 2024-2028

Published: Aug 2024 156 Pages SKU: IRTNTR76415

Market Overview at a Glance

$136.8 Mn
Market Opportunity
4.36%
CAGR
4.11
YoY growth 2023-2024(%)

Point of Care CT Imaging Market Size 2024-2028

The Point of Care CT Imaging Market size is estimated to grow by USD 136.8 million, at a CAGR of 4.36% between 2023 and 2028. The market is experiencing significant growth, driven by the increasing prevalence of chronic health conditions and the need for timely and accurate diagnostic solutions. PoC CT imaging enables quick and efficient diagnosis, reducing the need for hospital visits and minimizing wait times. A key trend in the market is the integration of Artificial Intelligence (AI) with CT imaging, enhancing image analysis and diagnosis accuracy. However, the high costs associated with PoC CT imaging, including equipment and maintenance expenses, remain a significant challenge for market growth. Despite this, the market is expected to expand at a robust pace due to its numerous benefits, including improved patient outcomes, increased efficiency, and reduced healthcare costs in the long run.

What will be the size of the Market During the Forecast Period?

Point Of Care (Poc) Ct Imaging Market Size

To learn more about this report, Request Free Sample

Market Segmentation

Product Analysis

The full-sized CT scanners segment is estimated to witness significant growth during the forecast period. A majority of the population who require computed tomography scans prefer to go to hospitals rather than other outpatient settings, where full-sized POC CT scanners are utilized. Several prominent market players in the POC computed tomography (CT) imaging market are increasingly striving toward launching full-sized CT scanners that can be used in POC settings due to the high demand for computed tomography scans across hospitals. 

Point Of Care (Poc) Ct Imaging Market Size

Get a glance at the market contribution of various segments View a PDF Sample

The full-sized CT scanners segment was the largest segment and was valued at USD 299.30 million in 2018. There is an increasing adoption of full-sized CT scanners across intensive care units (ICUs) and coronary care units (CCUs) to offer quick scans during emergency procedures.  Furthermore, there is a significant rise in investments in the healthcare industry in both developed and developing nations due to factors such as the growing ageing population across the world and the rising prevalence of health issues that are associated with ageing. Therefore, the increase in the number of healthcare facilities globally will result in a rise in the number of hospitals which will significantly contribute to the growth of this segment. Hence, such factors are expected to fuel the growth of the segment which in turn will drive the market growth during the forecast period.

Regional Analysis

Point Of Care (Poc) Ct Imaging Market Share by Geography

For more insights about the market share of various regions View PDF Sample now!

North America is estimated to contribute 40% to the growth of the global market during the forecast period. Technavio’s analysts have elaborately explained the regional trends and drivers that will shape the market during the forecast period. Some of the main factors that are significantly contributing to the growth of the market in North America include the rising prevalence of chronic diseases, technological advances, the increasing number of awareness programs regarding the early diagnosis of diseases, and the high healthcare spending by people. In addition, there is an increase in the use of diagnostic imaging technologies such as computed tomography scanners, as well as the number of imaging scanning procedures performed due to the advancement of technologies in the region. For example, in the US, 73 million CT procedures were performed in 2020, the highest among all the OECD countries. Furthermore, factors such as the high adoption of advanced medical devices in healthcare facilities in the US, as well as the increasing shift towards precision medicine and the growing utilization of POC CT imaging equipment across several applications, are expected to drive the market growth in the region.

Buy Now Full Report and Discover More

Key Market Players 

Companies are implementing various strategies, such as strategic alliances, partnerships, mergers and acquisitions, geographical expansion, and product/service launches, to enhance their presence in the market. The report also includes detailed analyses of the competitive landscape of the market and information about 15 market companies, including:

Xoran Technologies LLC: The company offers point of care CT imaging, such as CT computed tomography that delivers best-in-class reliability and image quality which provides volumetric scanners, able to scan the entire heart in one beat.

  • Carestream Health Inc.
  • Planmeca Oy
  • Samsung Electronics Co. Ltd.
  • Siemens AG
  • SCANCO Medical AG
  • GENORAY Co. Ltd.
  • CurveBeam AI Ltd.
  • Analogic Corp.
  • Canon Inc.
  • Koninklijke Philips N.V.
  • MinFound Medical Systems Co. Ltd.
  • Neusoft Corp.
  • Shimadzu Corp.
  • Stryker Corp.

Qualitative and quantitative analysis of companies has been conducted to help clients understand the wider business environment as well as the strengths and weaknesses of key market players. Data is qualitatively analyzed to categorize companies as pure play, category-focused, industry-focused, and diversified; it is quantitatively analyzed to categorize companies as dominant, leading, strong, tentative, and weak.

Market Dynamics and Customer Landscape

The market is transforming the landscape of diagnosis, particularly in emergency diagnosis and ambulatory surgery centers. Compact CT imaging devices enhance disease detection by delivering 3D images of internal structures, crucial for diagnosing lung cancer, brain tumors, and traumatic brain injury. Healthcare providers are increasingly relying on computed tomography equipment for rapid assessment, improving patient happiness through more efficient scanning protocols and real-time data. With AI-powered medical devices and cloud-based AI analysis, the accuracy and speed of disease detection are significantly enhanced, though total cost of diagnosis and high expense remain considerations. Radiographers and healthcare staff benefit from advanced photon-counting technology, which reduces radiation dose and improves energy efficiency. This technology is vital for managing chronic diseases, including chronic respiratory conditions and musculoskeletal issues, especially within the geriatric population. Enhanced medical technology supports specialists in providing accurate and timely care.

Key Market Driver

The global market for Point of Care (PoC) CT imaging equipment is experiencing significant growth due to the increasing prevalence of chronic disorders, particularly in the aging population. Chronic diseases such as cardiovascular disease, cancer, diabetes, and neurological disorders are on the rise, necessitating the use of advanced diagnostic tools like PoC CT imaging equipment for timely and accurate diagnosis. In critical care settings like emergency rooms and intensive care units, PoC CT imaging plays a crucial role in the diagnosis and therapy of various conditions, including stroke, trauma, and infectious diseases. Manufacturers of PoC CT imaging equipment, such as Neurologica, Varian, and others, are focusing on obtaining CE marking to expand their reach in Europe and other regions.

Further, the ongoing coronavirus pandemic has further accelerated the adoption of PoC CT imaging equipment in remote areas and resource-limited settings for the diagnosis of COVID-19 and other conditions. Artificial intelligence (AI)-powered features in PoC CT imaging solutions are enabling healthcare professionals to improve workflow efficiency and provide quality care at an affordable cost. Outpatient services, radiology centers, clinics, and ambulatory surgical centers are increasingly investing in PoC CT imaging equipment for patient treatment and diagnostic fees.

Significant Market Trends

A key factor shaping the point-of-care CT imaging market growth is the integration of AI with CT imaging.  The main advantage of the integration of AI with POC computed tomography imaging equipment is that it facilitates end-users to automate and standardize complex diagnostic procedures, enhance patient experience and outcomes, and reduce the cost of healthcare. In addition, AI helps to analyze and interpret a large amount of data from the results of CT scans thereby increasing productivity, improving accuracy, and reducing errors in diagnosis for radiologists and technicians.

Moreover, AI plays a major role in the image acquisition, processing, and interpretation of computed tomography scans. Some of the key AI techniques including object detection and image segmentation, facilitate radiologists and technicians to identify and compare relevant patterns and other imaging data faster and more accurately. Hence, such factors are positively impacting the market. Therefore, it is expected to drive the market growth during the forecast period.

Major Market Challenges

High costs associated with POC CT imaging are a major challenge hindering market growth. The high cost of medical imaging equipment and procedures is a significant burden on the patients and end-users. For example,  the average cost of an MRI machine is USDUSD300,000-USD2,000,000. Some of the additional costs include remodeling, maintenance, and installation. 

Moreover, there is a regular need for annual service maintenance for POC computed tomography imaging equipment.  Some of the other costs include preventive maintenance costs, including those related to parts, labor costs, and technicians' pay which adds to the overall costs. Hence, such factors are negatively impacting the point of care (POC) CT imaging systems. Therefore, it is expected to hinder growth during the market forecast period.

Buy Now Full Report and Discover More

Customer Landscape

The market forecasting report includes the adoption lifecycle of the market research and growth, covering from the innovator’s stage to the laggard’s stage. It focuses on adoption rates in different regions based on penetration. Furthermore, the market growth analysis report also includes key purchase criteria and drivers of price sensitivity to help companies evaluate and develop their market growth and forecasting strategies.
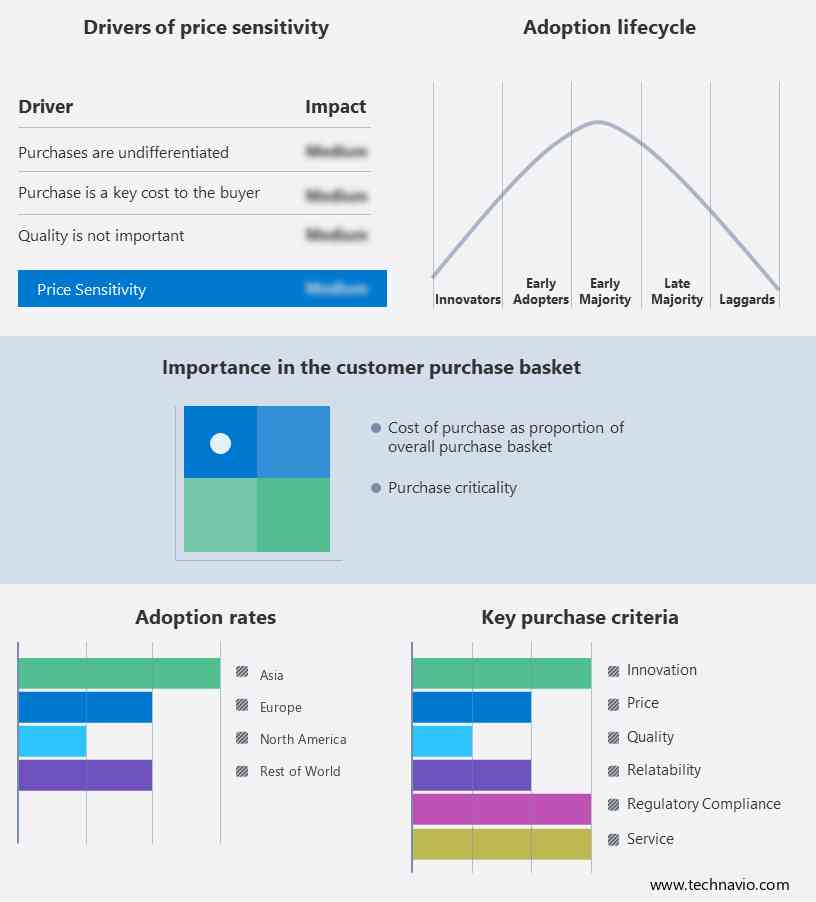
Point of Care CT Imaging Market Share by Geography

 Customer Landscape

Segment Overview

The market research report provides comprehensive data (region-wise segment analysis), with forecasts and estimates in "USD million " for the period 2024-2028, as well as historical data from 2018-2022 for the following segments.

  • Product Outlook 
    • Full-sized CT scanners
    • Compact CT scanners
  • End-user Outlook
    • Hospitals
    • Diagnostic centers
    • Others
  • Geography Outlook 
    • North America
      • The U.S.
      • Canada
    • Europe
      • The U.K.
      • Germany
      • France
      • Rest of Europe
    • Asia
      • China
      • India
    • ROW
      • Australia
      • Argentina
      • Brazil

You may also interested in below market reports:

Market Analyst Overview

The market is witnessing significant growth due to the rising prevalence of chronic disorders such as cardiovascular disease, cancer, diabetes, respiratory disorders, and neurological disorders in the aging population. PoC CT imaging systems are increasingly being used in emergency rooms and intensive care units for quick diagnosis and treatment of critical conditions. Neurological disorders like stroke and brain injuries also require immediate imaging, making PoC CT a crucial tool in healthcare settings. Manufacturers like Neurologica, Varian, and others are focusing on CE marking and regulatory approvals to expand their market reach. The coronavirus pandemic has accelerated the adoption of PoC CT imaging in critical care settings and remote areas, where access to advanced medical facilities is limited. The integration of artificial intelligence and workflow efficiency solutions is improving the efficiency of PoC CT imaging, making it an essential tool for healthcare professionals in hospitals, ambulatory surgical centers, radiology centers, clinics, and outpatient services. Prevention and early detection of diseases are key focus areas for PoC CT imaging in resource-limited areas.

Industry  Scope

Report Coverage

Details

Page number

156

Base year

2023

Historic period

2018 - 2022

Forecast period

2024-2028

Growth momentum & CAGR

Accelerate at a CAGR of 4.36%

Market growth 2024-2028

USD 136.8 million

Market structure

Fragmented

YoY growth 2023-2024(%)

4.11

Regional analysis

North America, Europe, Asia, and Rest of World (ROW)

Performing market contribution

North America at 40%

Key countries

US, Germany, UK, Canada, and China

Competitive landscape

Leading Companies, Market Positioning of Companies, Competitive Strategies, and Industry Risks

Key companies profiled

Analogic Corp., Canon Inc., Carestream Health Inc., CurveBeam AI Ltd., GENORAY Co. Ltd., Koninklijke Philips N.V., MinFound Medical Systems Co. Ltd., Neusoft Corp., Planmeca Oy, Samsung Electronics Co. Ltd., SCANCO Medical AG, Shimadzu Corp., Siemens AG, Stryker Corp., and Xoran Technologies LLC

Market dynamics

Parent market analysis, Market growth inducers and obstacles, Fast-growing and slow-growing segment analysis, Market growth and Forecasting, COVID 19 impact and recovery analysis and future consumer dynamics, Market condition analysis for forecast period

Customization purview

If our report has not included the data that you are looking for, you can reach out to our analysts and get segments customized.


View Sample PDF at your Fingertips

What are the Key Data Covered in this Market Report?

  • CAGR of the market during the forecast period
  • Detailed information on factors that will drive the growth of the market  between 2023 and 2027
  • Precise estimation of the market size and its contribution to the market in focus on the parent market
  • Detailed analysis of customer landscape covering Diver of price sensitivity, Adoption of the lifecycle, and key purchase criteria 
  • Companies landscape comparing criticality of inputs and factors of differentiation
  • Exclusive Matrix on companies' position and classification
  • Accurate predictions about upcoming trends and changes in consumer behavior
  • Growth of the market across North America, Europe, Asia, and Rest of the World (ROW)
  • A thorough analysis of the market’s competitive landscape and detailed information about companies
  • Comprehensive analysis of factors that will challenge the growth of market companies

We can help! Our analysts can customize this market research report to meet your requirements. Get in touch

1 Executive Summary

  • 1.1 Market overview
    • Executive Summary - Chart on Market Overview
    • Executive Summary - Data Table on Market Overview
    • Executive Summary - Chart on Global Market Characteristics
    • Executive Summary - Chart on Market by Geography
    • Executive Summary - Chart on Market Segmentation by Product
    • Executive Summary - Chart on Market Segmentation by End-user
    • Executive Summary - Chart on Incremental Growth
    • Executive Summary - Data Table on Incremental Growth
    • Executive Summary - Chart on Company Market Positioning

2 Market Landscape

  • 2.1 Market ecosystem
    • Parent Market
    • Data Table on - Parent Market
  • 2.2 Market characteristics
    • Market characteristics analysis
  • 2.3 Value chain analysis
    • Value Chain Analysis

3 Market Sizing

  • 3.1 Market definition
    • Offerings of companies included in the market definition
  • 3.2 Market segment analysis
    • Market segments
  • 3.3 Market size 2023
    • 3.4 Market outlook: Forecast for 2023-2028
      • Chart on Global - Market size and forecast 2023-2028 ($ million)
      • Data Table on Global - Market size and forecast 2023-2028 ($ million)
      • Chart on Global Market: Year-over-year growth 2023-2028 (%)
      • Data Table on Global Market: Year-over-year growth 2023-2028 (%)

    4 Historic Market Size

    • 4.1 Global Point Of Care (POC) CT Imaging Market 2018 - 2022
      • Historic Market Size - Data Table on Global Point Of Care (POC) CT Imaging Market 2018 - 2022 ($ million)
    • 4.2 Product segment analysis 2018 - 2022
      • Historic Market Size - Product Segment 2018 - 2022 ($ million)
    • 4.3 End-user segment analysis 2018 - 2022
      • Historic Market Size - End-user Segment 2018 - 2022 ($ million)
    • 4.4 Geography segment analysis 2018 - 2022
      • Historic Market Size - Geography Segment 2018 - 2022 ($ million)
    • 4.5 Country segment analysis 2018 - 2022
      • Historic Market Size - Country Segment 2018 - 2022 ($ million)

    5 Five Forces Analysis

    • 5.1 Five forces summary
      • Five forces analysis - Comparison between 2023 and 2028
    • 5.2 Bargaining power of buyers
      • Bargaining power of buyers - Impact of key factors 2023 and 2028
    • 5.3 Bargaining power of suppliers
      • Bargaining power of suppliers - Impact of key factors in 2023 and 2028
    • 5.4 Threat of new entrants
      • Threat of new entrants - Impact of key factors in 2023 and 2028
    • 5.5 Threat of substitutes
      • Threat of substitutes - Impact of key factors in 2023 and 2028
    • 5.6 Threat of rivalry
      • Threat of rivalry - Impact of key factors in 2023 and 2028
    • 5.7 Market condition
      • Chart on Market condition - Five forces 2023 and 2028

    6 Market Segmentation by Product

    • 6.1 Market segments
      • Chart on Product - Market share 2023-2028 (%)
      • Data Table on Product - Market share 2023-2028 (%)
    • 6.2 Comparison by Product
      • Chart on Comparison by Product
      • Data Table on Comparison by Product
    • 6.3 Full-sized CT scanners - Market size and forecast 2023-2028
      • Chart on Full-sized CT scanners - Market size and forecast 2023-2028 ($ million)
      • Data Table on Full-sized CT scanners - Market size and forecast 2023-2028 ($ million)
      • Chart on Full-sized CT scanners - Year-over-year growth 2023-2028 (%)
      • Data Table on Full-sized CT scanners - Year-over-year growth 2023-2028 (%)
    • 6.4 Compact CT scanners - Market size and forecast 2023-2028
      • Chart on Compact CT scanners - Market size and forecast 2023-2028 ($ million)
      • Data Table on Compact CT scanners - Market size and forecast 2023-2028 ($ million)
      • Chart on Compact CT scanners - Year-over-year growth 2023-2028 (%)
      • Data Table on Compact CT scanners - Year-over-year growth 2023-2028 (%)
    • 6.5 Market opportunity by Product
      • Market opportunity by Product ($ million)
      • Data Table on Market opportunity by Product ($ million)

    7 Market Segmentation by End-user

    • 7.1 Market segments
      • Chart on End-user - Market share 2023-2028 (%)
      • Data Table on End-user - Market share 2023-2028 (%)
    • 7.2 Comparison by End-user
      • Chart on Comparison by End-user
      • Data Table on Comparison by End-user
    • 7.3 Hospitals - Market size and forecast 2023-2028
      • Chart on Hospitals - Market size and forecast 2023-2028 ($ million)
      • Data Table on Hospitals - Market size and forecast 2023-2028 ($ million)
      • Chart on Hospitals - Year-over-year growth 2023-2028 (%)
      • Data Table on Hospitals - Year-over-year growth 2023-2028 (%)
    • 7.4 Diagnostic centers - Market size and forecast 2023-2028
      • Chart on Diagnostic centers - Market size and forecast 2023-2028 ($ million)
      • Data Table on Diagnostic centers - Market size and forecast 2023-2028 ($ million)
      • Chart on Diagnostic centers - Year-over-year growth 2023-2028 (%)
      • Data Table on Diagnostic centers - Year-over-year growth 2023-2028 (%)
    • 7.5 Others - Market size and forecast 2023-2028
      • Chart on Others - Market size and forecast 2023-2028 ($ million)
      • Data Table on Others - Market size and forecast 2023-2028 ($ million)
      • Chart on Others - Year-over-year growth 2023-2028 (%)
      • Data Table on Others - Year-over-year growth 2023-2028 (%)
    • 7.6 Market opportunity by End-user
      • Market opportunity by End-user ($ million)
      • Data Table on Market opportunity by End-user ($ million)

    8 Customer Landscape

    • 8.1 Customer landscape overview
      • Analysis of price sensitivity, lifecycle, customer purchase basket, adoption rates, and purchase criteria

    9 Geographic Landscape

    • 9.1 Geographic segmentation
      • Chart on Market share by geography 2023-2028 (%)
      • Data Table on Market share by geography 2023-2028 (%)
    • 9.2 Geographic comparison
      • Chart on Geographic comparison
      • Data Table on Geographic comparison
    • 9.3 North America - Market size and forecast 2023-2028
      • Chart on North America - Market size and forecast 2023-2028 ($ million)
      • Data Table on North America - Market size and forecast 2023-2028 ($ million)
      • Chart on North America - Year-over-year growth 2023-2028 (%)
      • Data Table on North America - Year-over-year growth 2023-2028 (%)
    • 9.4 Europe - Market size and forecast 2023-2028
      • Chart on Europe - Market size and forecast 2023-2028 ($ million)
      • Data Table on Europe - Market size and forecast 2023-2028 ($ million)
      • Chart on Europe - Year-over-year growth 2023-2028 (%)
      • Data Table on Europe - Year-over-year growth 2023-2028 (%)
    • 9.5 Asia - Market size and forecast 2023-2028
      • Chart on Asia - Market size and forecast 2023-2028 ($ million)
      • Data Table on Asia - Market size and forecast 2023-2028 ($ million)
      • Chart on Asia - Year-over-year growth 2023-2028 (%)
      • Data Table on Asia - Year-over-year growth 2023-2028 (%)
    • 9.6 Rest of World (ROW) - Market size and forecast 2023-2028
      • Chart on Rest of World (ROW) - Market size and forecast 2023-2028 ($ million)
      • Data Table on Rest of World (ROW) - Market size and forecast 2023-2028 ($ million)
      • Chart on Rest of World (ROW) - Year-over-year growth 2023-2028 (%)
      • Data Table on Rest of World (ROW) - Year-over-year growth 2023-2028 (%)
    • 9.7 US - Market size and forecast 2023-2028
      • Chart on US - Market size and forecast 2023-2028 ($ million)
      • Data Table on US - Market size and forecast 2023-2028 ($ million)
      • Chart on US - Year-over-year growth 2023-2028 (%)
      • Data Table on US - Year-over-year growth 2023-2028 (%)
    • 9.8 Germany - Market size and forecast 2023-2028
      • Chart on Germany - Market size and forecast 2023-2028 ($ million)
      • Data Table on Germany - Market size and forecast 2023-2028 ($ million)
      • Chart on Germany - Year-over-year growth 2023-2028 (%)
      • Data Table on Germany - Year-over-year growth 2023-2028 (%)
    • 9.9 UK - Market size and forecast 2023-2028
      • Chart on UK - Market size and forecast 2023-2028 ($ million)
      • Data Table on UK - Market size and forecast 2023-2028 ($ million)
      • Chart on UK - Year-over-year growth 2023-2028 (%)
      • Data Table on UK - Year-over-year growth 2023-2028 (%)
    • 9.10 Canada - Market size and forecast 2023-2028
      • Chart on Canada - Market size and forecast 2023-2028 ($ million)
      • Data Table on Canada - Market size and forecast 2023-2028 ($ million)
      • Chart on Canada - Year-over-year growth 2023-2028 (%)
      • Data Table on Canada - Year-over-year growth 2023-2028 (%)
    • 9.11 China - Market size and forecast 2023-2028
      • Chart on China - Market size and forecast 2023-2028 ($ million)
      • Data Table on China - Market size and forecast 2023-2028 ($ million)
      • Chart on China - Year-over-year growth 2023-2028 (%)
      • Data Table on China - Year-over-year growth 2023-2028 (%)
    • 9.12 Market opportunity by geography
      • Market opportunity by geography ($ million)
      • Data Tables on Market opportunity by geography ($ million)

    10 Drivers, Challenges, and Opportunity/Restraints

    • 10.1 Market drivers
      • 10.2 Market challenges
        • 10.3 Impact of drivers and challenges
          • Impact of drivers and challenges in 2023 and 2028
        • 10.4 Market opportunities/restraints

          11 Competitive Landscape

          • 11.1 Overview
            • 11.2 Competitive Landscape
              • Overview on criticality of inputs and factors of differentiation
            • 11.3 Landscape disruption
              • Overview on factors of disruption
            • 11.4 Industry risks
              • Impact of key risks on business

            12 Competitive Analysis

            • 12.1 Companies profiled
              • Companies covered
            • 12.2 Market positioning of companies
              • Matrix on companies position and classification
            • 12.3 Analogic Corp.
              • Analogic Corp. - Overview
              • Analogic Corp. - Product / Service
              • Analogic Corp. - Key offerings
            • 12.4 Canon Inc.
              • Canon Inc. - Overview
              • Canon Inc. - Business segments
              • Canon Inc. - Key news
              • Canon Inc. - Key offerings
              • Canon Inc. - Segment focus
            • 12.5 Carestream Health Inc.
              • Carestream Health Inc. - Overview
              • Carestream Health Inc. - Product / Service
              • Carestream Health Inc. - Key offerings
            • 12.6 CurveBeam AI Ltd.
              • CurveBeam AI Ltd. - Overview
              • CurveBeam AI Ltd. - Product / Service
              • CurveBeam AI Ltd. - Key offerings
            • 12.7 GENORAY Co. Ltd.
              • GENORAY Co. Ltd. - Overview
              • GENORAY Co. Ltd. - Product / Service
              • GENORAY Co. Ltd. - Key offerings
            • 12.8 Koninklijke Philips N.V.
              • Koninklijke Philips N.V. - Overview
              • Koninklijke Philips N.V. - Business segments
              • Koninklijke Philips N.V. - Key news
              • Koninklijke Philips N.V. - Key offerings
              • Koninklijke Philips N.V. - Segment focus
            • 12.9 MinFound Medical Systems Co. Ltd.
              • MinFound Medical Systems Co. Ltd. - Overview
              • MinFound Medical Systems Co. Ltd. - Product / Service
              • MinFound Medical Systems Co. Ltd. - Key offerings
            • 12.10 Neusoft Corp.
              • Neusoft Corp. - Overview
              • Neusoft Corp. - Product / Service
              • Neusoft Corp. - Key offerings
            • 12.11 Planmeca Oy
              • Planmeca Oy - Overview
              • Planmeca Oy - Product / Service
              • Planmeca Oy - Key offerings
            • 12.12 Samsung Electronics Co. Ltd.
              • Samsung Electronics Co. Ltd. - Overview
              • Samsung Electronics Co. Ltd. - Business segments
              • Samsung Electronics Co. Ltd. - Key news
              • Samsung Electronics Co. Ltd. - Key offerings
              • Samsung Electronics Co. Ltd. - Segment focus
            • 12.13 SCANCO Medical AG
              • SCANCO Medical AG - Overview
              • SCANCO Medical AG - Product / Service
              • SCANCO Medical AG - Key offerings
            • 12.14 Shimadzu Corp.
              • Shimadzu Corp. - Overview
              • Shimadzu Corp. - Business segments
              • Shimadzu Corp. - Key news
              • Shimadzu Corp. - Key offerings
              • Shimadzu Corp. - Segment focus
            • 12.15 Siemens AG
              • Siemens AG - Overview
              • Siemens AG - Business segments
              • Siemens AG - Key news
              • Siemens AG - Key offerings
              • Siemens AG - Segment focus
            • 12.16 Stryker Corp.
              • Stryker Corp. - Overview
              • Stryker Corp. - Business segments
              • Stryker Corp. - Key news
              • Stryker Corp. - Key offerings
              • Stryker Corp. - Segment focus
            • 12.17 Xoran Technologies LLC
              • Xoran Technologies LLC - Overview
              • Xoran Technologies LLC - Product / Service
              • Xoran Technologies LLC - Key offerings

            13 Appendix

            • 13.1 Scope of the report
              • 13.2 Inclusions and exclusions checklist
                • Inclusions checklist
                • Exclusions checklist
              • 13.3 Currency conversion rates for US$
                • Currency conversion rates for US$
              • 13.4 Research methodology
                • Research methodology
              • 13.5 Data procurement
                • Information sources
              • 13.6 Data validation
                • Data validation
              • 13.7 Validation techniques employed for market sizing
                • Validation techniques employed for market sizing
              • 13.8 Data synthesis
                • Data synthesis
              • 13.9 360 degree market analysis
                • 360 degree market analysis
              • 13.10 List of abbreviations
                • List of abbreviations

              Research Methodology

              Technavio presents a detailed picture of the market by way of study, synthesis, and summation of data from multiple sources. The analysts have presented the various facets of the market with a particular focus on identifying the key industry influencers. The data thus presented is comprehensive, reliable, and the result of extensive research, both primary and secondary.

              INFORMATION SOURCES

              Primary sources

              • Manufacturers and suppliers
              • Channel partners
              • Industry experts
              • Strategic decision makers

              Secondary sources

              • Industry journals and periodicals
              • Government data
              • Financial reports of key industry players
              • Historical data
              • Press releases

              DATA ANALYSIS

              Data Synthesis

              • Collation of data
              • Estimation of key figures
              • Analysis of derived insights

              Data Validation

              • Triangulation with data models
              • Reference against proprietary databases
              • Corroboration with industry experts

              REPORT WRITING

              Qualitative

              • Market drivers
              • Market challenges
              • Market trends
              • Five forces analysis

              Quantitative

              • Market size and forecast
              • Market segmentation
              • Geographical insights
              • Competitive landscape

              Interested in this report?

              Get your sample now to see our research methodology and insights!

              Download Now

              Frequently Asked Questions

              Point Of Care (Poc) Ct Imaging market growth will increase by $ 136.8 mn during 2024-2028 .

              The Point Of Care (Poc) Ct Imaging market is expected to grow at a CAGR of 4.36% during 2024-2028 .

              Point Of Care (Poc) Ct Imaging market is segmented by Product( Full-sized CT scanners, Compact CT scanners) End-user( Hospitals, Diagnostic centers, Others)

              Analogic Corp., Canon Inc., Carestream Health Inc., CurveBeam AI Ltd., GENORAY Co. Ltd., Koninklijke Philips N.V., MinFound Medical Systems Co. Ltd., Neusoft Corp., Planmeca Oy, Samsung Electronics Co. Ltd., SCANCO Medical AG, Shimadzu Corp., Siemens AG, Stryker Corp., Xoran Technologies LLC are a few of the key vendors in the Point Of Care (Poc) Ct Imaging market.

              North America will register the highest growth rate of 40% among the other regions. Therefore, the Point Of Care (Poc) Ct Imaging market in North America is expected to garner significant business opportunities for the vendors during the forecast period.

              US, Germany, UK, Canada, China

              • Increasing prevalence of chronic health conditionsPOC CT imaging equipment is used for the diagnosis of severe and chronic health conditions. In line with this is the driving factor this market.
              • the increasing prevalence of chronic diseases is the driving factor this market.
              • such as cancer is the driving factor this market.
              • cardiovascular diseases is the driving factor this market.
              • and neurological diseases is the driving factor this market.
              • is expected to trigger the demand for diagnostic products is the driving factor this market.
              • including POC CT imaging equipment is the driving factor this market.
              • and subsequently drive the growth of the global point of care CT imaging market during the forecast period. The prevalence of cancer and cardiovascular diseases is growing across the world. For instance is the driving factor this market.
              • according to the International Agency for Research on Cancer is the driving factor this market.
              • in 2020 is the driving factor this market.
              • the age-adjusted rate of new cancer cases was 19.3 million. In addition is the driving factor this market.
              • globally is the driving factor this market.
              • the incidence of several respiratory diseases is the driving factor this market.
              • such as chronic obstructive pulmonary disease (COPD) is the driving factor this market.
              • asthma is the driving factor this market.
              • and lung cancer is the driving factor this market.
              • is increasing. In 2020 is the driving factor this market.
              • the five most commonly diagnosed types of cancer globally were lung cancer is the driving factor this market.
              • breast cancer is the driving factor this market.
              • prostate cancer is the driving factor this market.
              • colorectal cancer is the driving factor this market.
              • and stomach cancer. Such cancers accounted for approximately 49% of all diagnosed cases of cancer. Among all these cancers is the driving factor this market.
              • lung cancer and breast cancer accounted for the largest number of diagnosed cases. The prevalence of various types of cancers is increasing worldwide. Thus is the driving factor this market.
              • the growing incidence of various injuries and diseases across the world is increasing the demand for screening and diagnoses is the driving factor this market.
              • which is expected to drive the growth of the global point of care CT imaging market during the forecast period. is the driving factor this market.

              The Point Of Care (Poc) Ct Imaging market vendors should focus on grabbing business opportunities from the Full-sized CT scanners segment as it accounted for the largest market share in the base year.