Industrial Computed Tomography Equipment Market Size 2025-2029
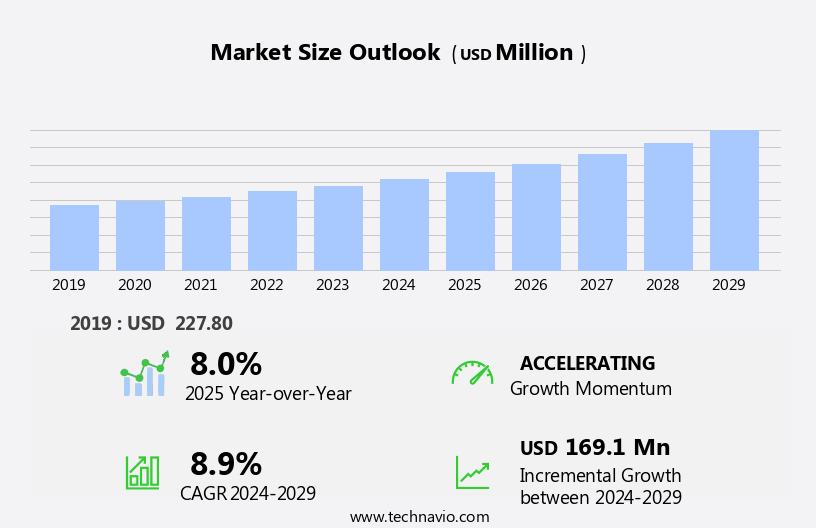
The industrial computed tomography equipment market size is forecast to increase by USD 169.1 million, at a CAGR of 8.9% between 2024 and 2029.
- The market is experiencing renewed demand, particularly from the oil and gas industry, as companies seek to enhance their production processes and improve product quality through advanced imaging technologies. Simultaneously, the market is witnessing a rising trend towards portable radiography equipment, which offers increased flexibility and mobility for on-site inspections and maintenance activities. However, the high cost of industrial computed tomography equipment remains a significant challenge for market growth. Companies must navigate this obstacle by exploring cost-effective solutions, such as leasing or renting equipment, or investing in more affordable alternatives that still offer high-performance capabilities.
- To capitalize on market opportunities, businesses should focus on developing innovative and cost-efficient solutions, while also addressing the need for portability and ease of use to cater to the evolving demands of various industries.
What will be the Size of the Industrial Computed Tomography Equipment Market during the forecast period?
Explore in-depth regional segment analysis with market size data - historical 2019-2023 and forecasts 2025-2029 - in the full report.
Request Free Sample
The industrial computed tomography (CT) equipment market is characterized by continuous evolution and dynamic market activities. CT technology, with its ability to generate three-dimensional images of internal structures, finds applications in various sectors, including material science, electronics inspection, and non-destructive testing. Phase contrast imaging and multi-modal imaging are advancing the capabilities of CT technology, providing enhanced image quality and improved material analysis. Additive manufacturing is integrating CT systems into its production process, enabling real-time inspection and ensuring product quality. Deep learning and artificial intelligence are revolutionizing CT image analysis, allowing for automated defect detection, fatigue analysis, and porosity analysis.
System integration and report generation streamline data processing, ensuring efficient and accurate results. Data acquisition and voxel data analysis are crucial components of CT systems, enabling high-resolution imaging and geometric analysis. Tomographic microscopy and synchrotron radiation offer new possibilities for material science research and dimensional measurement. CT technology is also transforming industries such as medical devices, where it is used for quality assurance and process optimization. In the field of casting inspection, CT systems ensure the detection of defects and improve corrosion analysis. Cost reduction and digital transformation are driving the adoption of CT technology in industries, as companies seek to enhance their manufacturing processes and improve product quality.
The ongoing unfolding of market activities and evolving patterns in the CT equipment market reflect the technology's versatility and relevance to various sectors.
How is this Industrial Computed Tomography Equipment Industry segmented?
The industrial computed tomography equipment industry research report provides comprehensive data (region-wise segment analysis), with forecasts and estimates in "USD million" for the period 2025-2029, as well as historical data from 2019-2023 for the following segments.
- Application
- FD and I
- Assembly analysis
- Failure analysis
- Others
- End-user
- Automotive
- Aerospace
- Electronics
- Oil and gas
- Others
- Type
- Stationary computed
- Portable computed
- Technique
- High-energy industrial CT
- Low-energy industrial CT
- Mini-focus industrial CT
- Geography
- North America
- US
- Canada
- Europe
- France
- Germany
- UK
- APAC
- China
- India
- Japan
- South Korea
- South America
- Brazil
- Rest of World (ROW)
- North America
By Application Insights
The fd and i segment is estimated to witness significant growth during the forecast period.
Industrial Computed Tomography (CT) equipment plays a crucial role in various industries for ensuring product quality and safety. The market for CT equipment is driven by the increasing demand for defect-free products and the need for high-performance components. This technology is used extensively for material analysis, including material science, corrosion analysis, and porosity analysis. CT equipment is also employed in industries such as additive manufacturing, electronics inspection, and reverse engineering for geometric analysis, component analysis, and dimensional measurement. Advancements in CT technology have led to the development of high-resolution imaging, phase contrast imaging, and multi-modal imaging. These technologies enable the detection of minute defects and the analysis of complex structures.
Furthermore, the integration of artificial intelligence, machine learning, and deep learning algorithms has improved image processing and analysis, leading to faster and more accurate results. CT equipment is also used in scientific research and industrial inspection, including non-destructive testing, welding inspection, and fatigue analysis. Synchrotron radiation and tomographic microscopy are advanced CT techniques used in scientific research for material analysis and imaging at the atomic level. In addition, CT technology is used in medical devices for imaging and analysis, contributing to cost reduction and improved quality control. The use of CT equipment in industries such as powder metallurgy, casting inspection, and process optimization has led to significant cost savings and improved product development.
Volume rendering and data visualization have made it easier to analyze complex data, leading to better understanding and improved decision-making. Overall, the market for CT equipment is expected to grow due to the increasing demand for advanced imaging and analysis technologies.
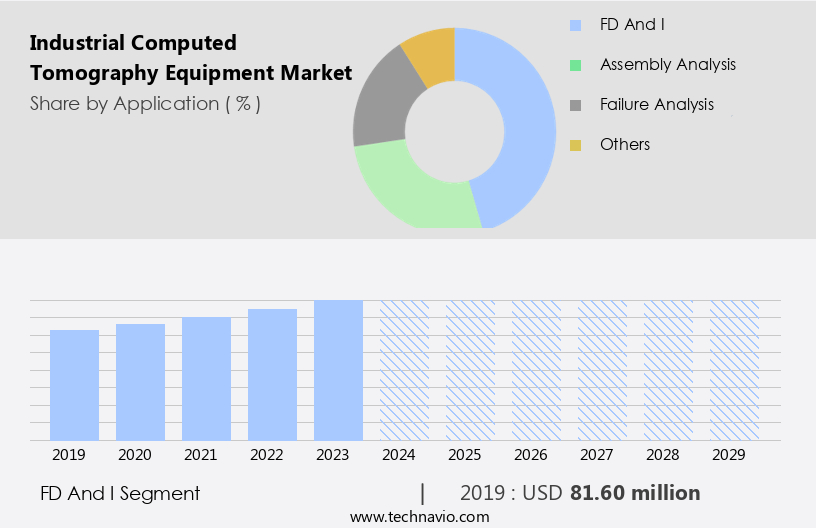
The FD and I segment was valued at USD 81.60 million in 2019 and showed a gradual increase during the forecast period.
Regional Analysis
APAC is estimated to contribute 32% to the growth of the global market during the forecast period.Technavio’s analysts have elaborately explained the regional trends and drivers that shape the market during the forecast period.

Industrial computed tomography equipment plays a crucial role in various industries, including automotive, electronics, aerospace, and medical devices, among others. The technology offers advanced capabilities such as data processing, phase contrast imaging, multi-modal imaging, additive manufacturing inspection, electronics inspection, image segmentation, material analysis, data acquisition, fatigue analysis, and voxel data analysis. These features enable industries to ensure quality assurance, process optimization, and cost reduction through non-destructive testing and scientific research. The automotive sector is a significant end-user of industrial computed tomography equipment due to its extensive applications in dimensional measurement, corrosion analysis, casting inspection, and reverse engineering. The Asia Pacific (APAC) region, with its numerous automotive manufacturing centers, is a major market for these systems.
Countries like China, India, Vietnam, South Korea, and Malaysia offer cost advantages, attracting substantial investments in the automotive value chain, including manufacturing and research and development facilities. Moreover, the industrial computed tomography market is witnessing technological advancements, such as high-resolution imaging, tomographic microscopy, synchrotron radiation, and 3D imaging. These innovations contribute to geometric analysis, component analysis, material science, and defect detection, enhancing the overall efficiency and productivity of industries. Additionally, the integration of artificial intelligence, machine learning, and deep learning algorithms into image processing and analysis software further improves the market's potential. Furthermore, industries are increasingly adopting digital transformation, which is driving the demand for industrial computed tomography equipment.
This trend is particularly noticeable in sectors like aerospace and medical devices, where high-precision and non-destructive testing are essential. The technology's ability to provide accurate data and analysis for process optimization, quality control, and product development makes it indispensable in these industries. In conclusion, the market is experiencing significant growth due to its wide range of applications and technological advancements. The automotive sector's dominance in the market is driven by its extensive use in various applications and the cost advantages offered by manufacturing centers in the APAC region. The integration of advanced technologies like artificial intelligence, machine learning, and deep learning is further enhancing the market's potential, making it a crucial technology for various industries.
Market Dynamics
Our researchers analyzed the data with 2024 as the base year, along with the key drivers, trends, and challenges. A holistic analysis of drivers will help companies refine their marketing strategies to gain a competitive advantage.
What are the key market drivers leading to the rise in the adoption of Industrial Computed Tomography Equipment Industry?
- The oil and gas industry's renewed demand serves as the primary catalyst for market growth.
- Industrial computed tomography (CT) equipment plays a crucial role in the oil and gas industry, providing geometric analysis and component analysis for ensuring quality assurance and process optimization. With the increasing energy demand, investments in oil and gas infrastructure have surged, leading companies to explore deeper offshore locations such as deepwater and ultra-deepwater fields. These environments demand rigorous scrutiny and safety measures, making high-resolution imaging through CT equipment essential. Countries like India, Brazil, and Israel have implemented favorable policies to attract oil and gas companies, leading to an increase in exploration activities. CT equipment is instrumental in corrosion analysis and dimensional measurement, enabling companies to detect and prevent potential issues in castings and other critical components.
- Tomographic microscopy and synchrotron radiation offer advanced capabilities for reverse engineering and non-destructive testing. Medical devices and other industries also benefit from CT technology, which offers cost reduction through improved efficiency and accuracy. CT equipment's ability to provide detailed, three-dimensional images has made it an indispensable tool for various industries, ensuring product quality and process optimization.
What are the market trends shaping the Industrial Computed Tomography Equipment Industry?
- The increasing need for portable radiography equipment represents a significant market trend. This demand stems from the convenience and mobility advantages offered by portable equipment, making it an essential tool in various healthcare settings.
- Industrial Computed Tomography (CT) equipment is experiencing significant adoption across various industries due to its ability to provide intricate data visualization for quality control and product development. In sectors like powder metallurgy, deep learning, and image analysis are increasingly utilized for enhancing the efficiency of the manufacturing process. CT systems enable image processing and system integration for density measurement and fracture analysis. The integration of artificial intelligence and machine learning algorithms in CT equipment is revolutionizing the industry. These technologies facilitate automated report generation and streamline the inspection process. Portable CT equipment is gaining traction, particularly in industries with geographically dispersed assets, such as oil and gas, automotive, and aerospace.
- Its mobility allows for inspections at multiple locations and positions, increasing operational flexibility. In the oil and gas industry, a single CT system can be utilized across various rigs and pipeline points, reducing the need for multiple installations. Similarly, the automotive and aerospace industries can benefit from the portability and advanced capabilities of CT equipment for non-destructive testing and quality assurance. Overall, the adoption of CT technology is essential for ensuring product integrity, optimizing production processes, and enhancing safety standards.
What challenges does the Industrial Computed Tomography Equipment Industry face during its growth?
- The exorbitant cost of industrial computed tomography (CT) equipment poses a significant challenge to the industry's growth trajectory. This expense, a key consideration for businesses in the sector, may hinder the adoption of advanced CT technologies and limit the expansion of applications within various industries.
- Industrial Computed Tomography (CT) equipment is utilized extensively by manufacturers for non-destructive testing and porosity analysis in various industries. High-performance CT systems are essential for inspecting products for quality and safety, particularly in sectors such as automotive and aerospace. These industries prioritize the best price-performance ratio for their customers, making CT equipment a valuable investment. Industrial CT systems enable advanced capabilities like image reconstruction, volume rendering, and defect detection through x-ray imaging. Machine learning algorithms are increasingly being integrated into these systems to enhance defect detection capabilities.
- However, the high capital and maintenance costs of CT equipment limit its widespread adoption in cost-sensitive industries, despite the potential benefits of reduced maintenance and ownership costs and improved inspection quality and productivity. CT equipment plays a crucial role in scientific research and industrial inspection, driving digital transformation in manufacturing processes.
Exclusive Customer Landscape
The industrial computed tomography equipment market forecasting report includes the adoption lifecycle of the market, covering from the innovator’s stage to the laggard’s stage. It focuses on adoption rates in different regions based on penetration. Furthermore, the industrial computed tomography equipment market report also includes key purchase criteria and drivers of price sensitivity to help companies evaluate and develop their market growth analysis strategies.

Customer Landscape
Key Companies & Market Insights
Companies are implementing various strategies, such as strategic alliances, industrial computed tomography equipment market forecast, partnerships, mergers and acquisitions, geographical expansion, and product/service launches, to enhance their presence in the industry.
Avonix Imaging - This company specializes in advanced industrial computed tomography (CT) equipment. Our CT systems feature liquid-cooled rotating targets, enhancing heat dissipation and enabling larger flux without expanding the focal spot size. This innovative cooling technology boosts productivity and improves image quality, making it a game-changer in the industry. CT equipment from this company sets new standards for efficiency and precision.
The industry research and growth report includes detailed analyses of the competitive landscape of the market and information about key companies, including:
- Avonix Imaging
- Baker Hughes Co.
- Blue Star Ltd.
- Bruker Corp.
- Carl Zeiss AG
- Comet Yxlon GmbH
- CyXplus SAS
- Dandong Aolong Radiative Instrument Group Co. Ltd.
- General Electric Co.
- Nikon Corp.
- North Star Imaging Inc.
- OMRON Corp.
- Pinnacle X ray Solutions Inc.
- ProCon X Ray GmbH
- Rigaku Corp.
- RX Solutions
- Shanghai Eastimage Equipment Co. Ltd.
- Shimadzu Corp.
- VJ Group Inc.
- Werth Messtechnik GmbH
Qualitative and quantitative analysis of companies has been conducted to help clients understand the wider business environment as well as the strengths and weaknesses of key industry players. Data is qualitatively analyzed to categorize companies as pure play, category-focused, industry-focused, and diversified; it is quantitatively analyzed to categorize companies as dominant, leading, strong, tentative, and weak.
Recent Development and News in Industrial Computed Tomography Equipment Market
- In March 2024, leading industrial CT equipment manufacturer, GE Healthcare, unveiled its new Revolution CT 16 Slice system, featuring advanced image resolution and reconstruction capabilities. This innovation is expected to enhance the diagnostic accuracy and efficiency in various industries such as aerospace, automotive, and pharmaceuticals (GE Healthcare Press Release, 2024).
- In July 2025, Siemens Healthineers and Hitachi Healthcare collaborated to expand their partnership, integrating Hitachi's industrial CT systems with Siemens' syngo.Via post-processing software. This collaboration aims to streamline workflows and improve diagnostic capabilities for industrial customers (Siemens Healthineers Press Release, 2025).
- In October 2024, Nikon Metrology, a global leader in 3D metrology solutions, announced a strategic acquisition of Amplify3D, a software company specializing in CT data processing and visualization. This acquisition is expected to strengthen Nikon Metrology's CT product offerings and enhance its competitive position in the industrial CT market (Nikon Metrology Press Release, 2024).
- In February 2025, the European Union granted approval to a new research project, INSPECCT, aimed at developing advanced CT systems for non-destructive testing of critical industrial components. This â¬11 million project is expected to significantly advance the capabilities of industrial CT equipment and contribute to the European industrial sector's growth (European Commission Press Release, 2025).
Research Analyst Overview
- The industrial computed tomography (CT) equipment market encompasses a range of measurement tools, including industrial CT scanners, that employ advanced technologies such as detector arrays, rendering software, and reconstruction algorithms for structural analysis. Magnetic particle testing, ultrasonic testing, penetrant testing, and eddy current testing continue to coexist with CT scanning in non-destructive testing (NDT) applications. Data management, segmentation software, and reporting tools facilitate efficient workflow automation. Virtual reality and augmented reality technologies enhance the user experience in CT scanning, enabling real-time monitoring and remote access. Microfocus X-ray sources and material characterization techniques contribute to the market's growth.
- Biomedical engineering and 3D printing applications expand the scope of CT scanning. Trends include the integration of cloud-based platforms for data acquisition and storage, enabling seamless collaboration and real-time analysis. Reconstruction algorithms, thermal imaging, and failure analysis software further expand the capabilities of industrial CT scanners. Overall, the market for industrial CT equipment is dynamic, driven by technological advancements and the increasing demand for non-destructive testing solutions.
Dive into Technavio’s robust research methodology, blending expert interviews, extensive data synthesis, and validated models for unparalleled Industrial Computed Tomography Equipment Market insights. See full methodology.
|
Market Scope |
|
|
Report Coverage |
Details |
|
Page number |
246 |
|
Base year |
2024 |
|
Historic period |
2019-2023 |
|
Forecast period |
2025-2029 |
|
Growth momentum & CAGR |
Accelerate at a CAGR of 8.9% |
|
Market growth 2025-2029 |
USD 169.1 million |
|
Market structure |
Fragmented |
|
YoY growth 2024-2025(%) |
8.0 |
|
Key countries |
US, China, Germany, India, Brazil, Japan, UK, South Korea, France, and Canada |
|
Competitive landscape |
Leading Companies, Market Positioning of Companies, Competitive Strategies, and Industry Risks |
What are the Key Data Covered in this Industrial Computed Tomography Equipment Market Research and Growth Report?
- CAGR of the Industrial Computed Tomography Equipment industry during the forecast period
- Detailed information on factors that will drive the growth and forecasting between 2025 and 2029
- Precise estimation of the size of the market and its contribution of the industry in focus to the parent market
- Accurate predictions about upcoming growth and trends and changes in consumer behaviour
- Growth of the market across APAC, Europe, North America, South America, and Middle East and Africa
- Thorough analysis of the market’s competitive landscape and detailed information about companies
- Comprehensive analysis of factors that will challenge the industrial computed tomography equipment market growth of industry companies
We can help! Our analysts can customize this industrial computed tomography equipment market research report to meet your requirements.
 RIA -
RIA - 
