Dental Cone Beam Computed Tomography (CBCT) Market Size 2024-2028
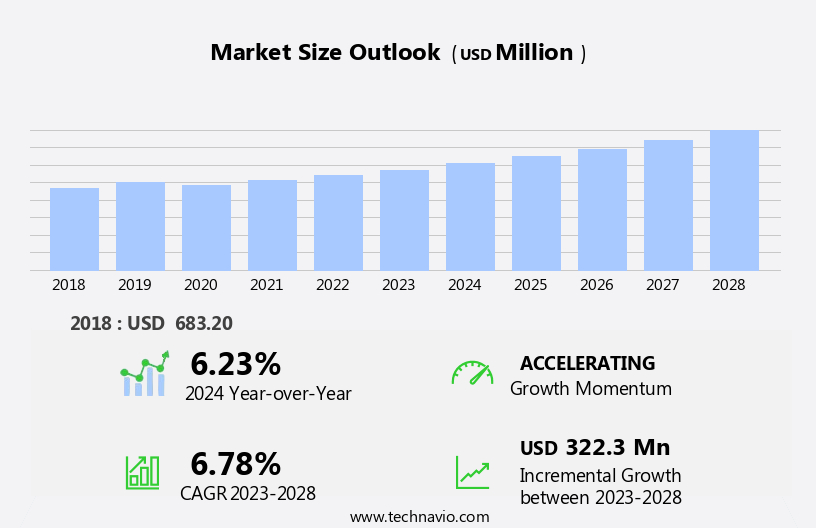
The dental cone beam computed tomography (CBCT) market size is forecast to increase by USD 322.3 million, at a CAGR of 6.78% between 2023 and 2028.
- The market is characterized by continuous advancements in imaging technology, which offer enhanced dental diagnostic capabilities and improved patient outcomes. These technological advancements include higher resolution images, faster scan times, and improved software capabilities. Additionally, the integration of software tools with CBCT systems enables more efficient workflows and improved diagnostic accuracy. However, substantial investment costs pose a significant challenge for market growth. Dental practices and clinics must invest in expensive CBCT systems and ongoing software updates to remain competitive. This financial burden may limit the adoption of CBCT technology in smaller practices or developing regions, hindering market expansion.
- To navigate this challenge, market participants could explore financing options, such as leasing or rental agreements, or partnering with third-party providers to offer CBCT services on a subscription basis. By addressing this challenge, market players can capitalize on the growing demand for advanced dental imaging technologies and expand their customer base.
What will be the Size of the Dental Cone Beam Computed Tomography (CBCT) Market during the forecast period?
Explore in-depth regional segment analysis with market size data - historical 2018-2022 and forecasts 2024-2028 - in the full report.
Request Free Sample
The market continues to evolve, driven by advancements in imaging technology and expanding applications across various sectors. CBCT's unique ability to provide multiplanar reconstruction (MPR) images with superior image quality enables it to play a pivotal role in various dental and maxillofacial procedures.
Volume rendering techniques and image quality assessment are critical components of CBCT technology. They enable dental caries detection, periodontitis diagnosis, and bone density measurements, providing valuable insights into the oral cavity's structural and functional health. Furthermore, ongoing research focuses on radiation dose reduction, contrast enhancement techniques, image noise reduction, patient positioning protocols, and dose optimization algorithms. These advancements aim to enhance CBCT's clinical utility while minimizing potential risks. In addition, CBCT's ability to perform image fusion techniques and analyze jawbone density allows for comprehensive maxillofacial trauma assessment and metal artifact reduction, expanding its clinical applications. The evolving nature of CBCT technology ensures that it remains a dynamic and integral part of modern dental and maxillofacial practices.
Its continuous development and integration of advanced imaging techniques enable it to deliver precise, accurate, and personalized treatment plans, ultimately improving patient care and outcomes.
How is this Dental Cone Beam Computed Tomography (CBCT) Industry segmented?
The dental cone beam computed tomography (CBCT) industry research report provides comprehensive data (region-wise segment analysis), with forecasts and estimates in "USD million" for the period 2024-2028, as well as historical data from 2018-2022 for the following segments.
- Application
- Dental implants
- Endodontic and periodontics
- Orthodontic
- Dental surgeries
- End-user
- Hospitals
- Dental clinics and laboratories
- Geography
- North America
- US
- Europe
- Germany
- UK
- APAC
- China
- Japan
- Rest of World (ROW)
- North America
By Application Insights
The dental implants segment is estimated to witness significant growth during the forecast period.
The market is experiencing significant growth due to its increasing application in the field of dental implantology. CBCT provides multiplanar reconstruction (MPR) images with optimized scan parameters, enabling accurate assessment of bone structures and anatomical landmarks for dental implant placement. The DICOM image format facilitates seamless integration with dental imaging software for further analysis. Advancements in CBCT technology include optimization of image acquisition protocols, which enhance nerve canal visualization and reduce radiation dose. Three-dimensional (3D) model generation and volume rendering techniques enable better understanding of complex anatomical structures, while metal artifact reduction and image noise reduction improve image quality.
CBCT is also essential for the diagnosis and assessment of various dental conditions such as temporomandibular joint disorders, sinus issues, periodontitis, and dental caries. Orthognathic surgery planning, implant placement simulation, airway analysis, and dose optimization algorithms further expand the application scope. The growing trend towards aesthetic dental restoration, particularly among young and adult populations, is fueling the demand for CBCT. The technology plays a crucial role in the evaluation of bone grafting and implant placement, ensuring successful outcomes in dental implant surgeries. Additionally, CBCT is instrumental in the diagnosis and analysis of jaw fractures, jawbone density, and maxillofacial trauma.
With advancements in technology, CBCT is becoming an indispensable tool for dental professionals, offering improved diagnostic capabilities and enhanced patient care.
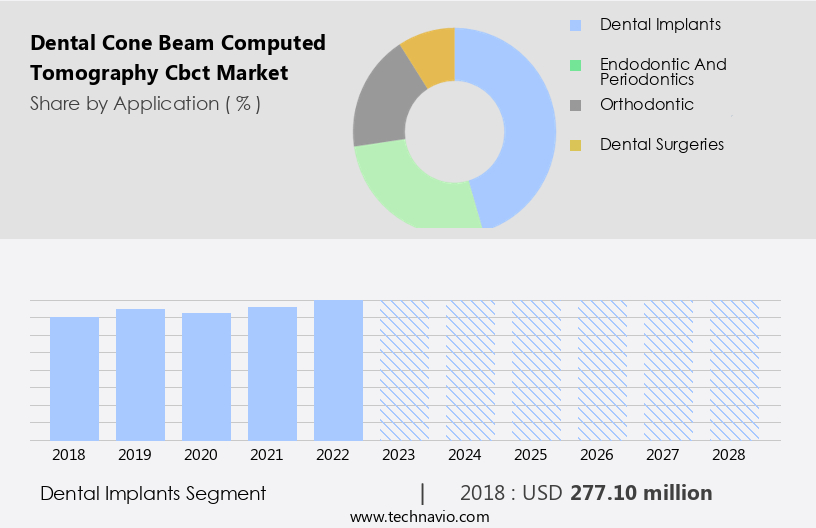
The Dental implants segment was valued at USD 277.10 million in 2018 and showed a gradual increase during the forecast period.
Regional Analysis
North America is estimated to contribute 36% to the growth of the global market during the forecast period. Technavio's analysts have elaborately explained the regional trends and drivers that shape the market during the forecast period.
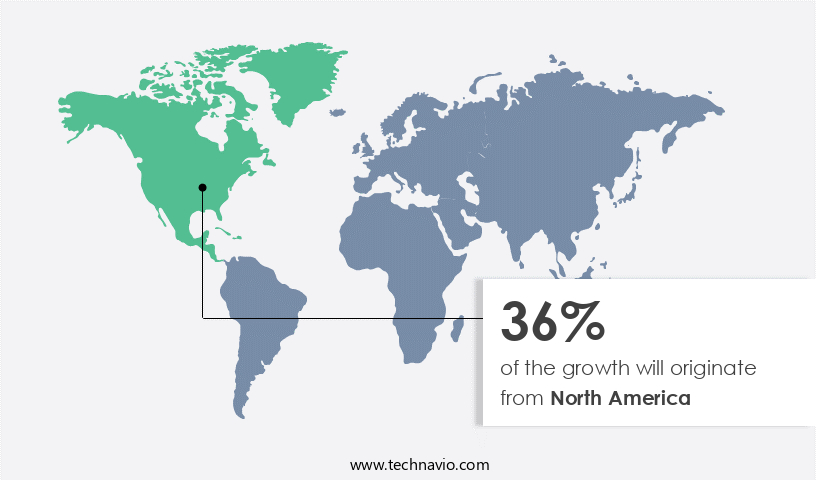
The market in North America is experiencing moderate growth in 2023 due to the increasing prevalence of dental conditions, technological advancements, and a favorable regulatory framework. The rising number of orthodontic conditions and the growing geriatric population with dental issues have boosted the demand for effective dental scanners in hospitals and dental clinics. In response, companies are introducing new CBCT systems to cater to this demand. Technological innovations, such as multiplanar reconstruction (MPR), scan parameters optimization, and DICOM image format, are enhancing the clinical utility of CBCT. These advancements enable better image quality assessment, dental implant planning, and periodontitis diagnosis. Furthermore, the integration of contrast enhancement techniques, image noise reduction, and patient positioning protocols ensures improved image quality and accuracy.
CBCT systems are increasingly being used for various applications, including temporomandibular joint imaging, sinus assessment, nerve canal visualization, 3D model generation, orthognathic surgery planning, implant placement simulation, airway analysis, volume rendering techniques, and dose optimization algorithms. These applications offer significant benefits, such as improved diagnosis, treatment planning, and patient outcomes. Radiation dose reduction techniques and metal artifact reduction are crucial considerations in the CBCT market. companies are focusing on developing advanced algorithms to minimize radiation exposure and metal artifacts, ensuring better patient safety and diagnostic accuracy. In summary, the North American CBCT market is witnessing growth due to the increasing prevalence of dental conditions, technological advancements, and favorable regulatory framework.
companies are introducing new systems with advanced features, such as MPR, scan parameters optimization, and DICOM image format, to cater to the evolving needs of the market. The integration of various applications, such as dental implant planning, periodontitis diagnosis, and jaw fracture analysis, is further enhancing the clinical utility of CBCT systems.
Market Dynamics
Our researchers analyzed the data with 2023 as the base year, along with the key drivers, trends, and challenges. A holistic analysis of drivers will help companies refine their marketing strategies to gain a competitive advantage.
The market is witnessing significant growth due to the advanced features of CBCT image analysis software. These features include minimizing radiation exposure during CBCT scans through optimized imaging protocols, improving diagnostic accuracy with high-resolution, 3D images, and streamlining the dental implant planning workflow with CBCT.
The CBCT applications in orthodontics and orthognathic surgery are also expanding, providing dentists with valuable information for treatment planning and execution. The market research reports indicate that these advantages are driving the adoption of CBCT systems in dental practices worldwide. The use of CBCT imaging enables dentists to make more informed decisions, leading to better patient outcomes and increased patient satisfaction. With continuous advancements in technology, the CBCT market is expected to continue its growth trajectory in the coming years.The Dental Cone Beam Computed Tomography (CBCT) Market is advancing with innovations in CBCT image analysis software features, enhancing imaging capabilities for clinical applications. A key focus is on minimizing radiation exposure CBCT scans while maintaining high image quality. These improvements are critical for improving diagnostic accuracy CBCT imaging, especially in complex dental assessments. In surgical planning, the dental implant planning workflow CBCT integration streamlines treatment, providing precise anatomical visualization. Furthermore, expanding CBCT applications orthodontics and orthognathic surgery is driving market growth, offering clinicians detailed insights for better patient outcomes. As technology continues to evolve, demand for efficient, safe, and accurate CBCT solutions is expected to rise, positioning the market for sustained development in dental and maxillofacial practices.
What are the key market drivers leading to the rise in the adoption of Dental Cone Beam Computed Tomography (CBCT) Industry?
- The ongoing innovations in imaging technology serve as the primary catalyst for market growth.
- The market experiences growth due to advancements in imaging technology. These developments enable dentists to capture more precise images of dental structures, leading to improved diagnosis and treatment planning. Faster scanning periods reduce patient discomfort and enhance practice efficiency. Superior image quality facilitates early detection and intervention of dental diseases. The technological enhancements of CBCT devices make them an attractive investment for dental practitioners and institutions.
- Multiplanar reconstruction (MPR), scan parameters optimization, DICOM image format, and image acquisition protocols contribute to the enhanced capabilities of CBCT systems. Cone beam imaging plays a crucial role in temporomandibular joint imaging, sinus assessment, and nerve canal visualization. The integration of these features into CBCT devices further strengthens their value proposition.
What are the market trends shaping the Dental Cone Beam Computed Tomography (CBCT) Industry?
- Cone beam computed tomography (CBCT) systems are increasingly being integrated with software tools, representing a significant market trend in the healthcare industry. This fusion of technologies enhances diagnostic capabilities and improves overall efficiency in medical imaging.
- Cone beam computed tomography (CBCT) market involves the integration of advanced software tools with CBCT systems to streamline diagnostic procedures, enhance patient experience, and reduce costs. These tools facilitate automation and standardization of complex procedures, enabling dentists to increase productivity, improve diagnostic accuracy, and reduce errors. One of the significant advantages of software tools integrated with CBCT systems is the ability to generate 3D models of dental structures. This feature aids in precise implant placement simulation and orthognathic surgery planning. Furthermore, radiation dose reduction techniques, contrast enhancement methods, and image noise reduction algorithms are incorporated into these tools, ensuring high-quality images with minimal radiation exposure and improved patient comfort.
- Patient positioning protocols are also crucial in ensuring accurate diagnoses and treatment planning. Software tools integrated with CBCT systems offer customized positioning guides, ensuring optimal patient alignment and reducing the likelihood of misalignment or errors. Additionally, airway analysis is a valuable feature that aids in identifying potential airway issues, contributing to better patient care and outcomes. In summary, software tools integrated with CBCT systems offer numerous benefits, including 3D model generation, radiation dose reduction, contrast enhancement techniques, image noise reduction, patient positioning protocols, and airway analysis, making them an essential component of modern dental practices.
What challenges does the Dental Cone Beam Computed Tomography (CBCT) Industry face during its growth?
- The substantial investment costs posing a significant hindrance to growth prospects represents a major challenge for the industry's expansion.
- Cone beam computed tomography (CBCT) systems, a type of advanced 3D imaging technology, offer significant benefits to dental professionals, including volume rendering techniques for improved image analysis, and enhanced dental implant planning. However, the high investment costs associated with these systems pose a challenge for market growth. The average price of a CBCT system ranges from USD 80,000 to USD 120,000, depending on the technology and brand. This substantial investment can hinder adoption, especially for smaller dental practices. Despite this challenge, the deployment of CBCT systems is essential for accurate image quality assessment, CBCT image segmentation, soft tissue visualization, dental caries detection, periodontitis diagnosis, and image fusion techniques.
- These advanced capabilities make CBCT an indispensable tool for dental professionals, justifying the investment despite the initial costs.
Exclusive Customer Landscape
The dental cone beam computed tomography (CBCT) market forecasting report includes the adoption lifecycle of the market, covering from the innovator's stage to the laggard's stage. It focuses on adoption rates in different regions based on penetration. Furthermore, the dental cone beam computed tomography (CBCT) market report also includes key purchase criteria and drivers of price sensitivity to help companies evaluate and develop their market growth analysis strategies.

Customer Landscape
Key Companies & Market Insights
Companies are implementing various strategies, such as strategic alliances, dental cone beam computed tomography (CBCT) market forecast, partnerships, mergers and acquisitions, geographical expansion, and product/service launches, to enhance their presence in the industry.
3Shape AS - This company specializes in dental cone beam computed tomography technology, featuring the Provecta 3D Prime product. Its advanced imaging capabilities enhance diagnostic accuracy and treatment planning in various dental applications.
The industry research and growth report includes detailed analyses of the competitive landscape of the market and information about key companies, including:
- 3Shape AS
- Air Techniques Inc.
- Asahi Roentgen Ind. Co. Ltd
- Carestream Health Inc.
- Cefla SC
- Dentium Co. Ltd.
- Dentsply Sirona Inc.
- Durr Dental SE
- Envista Holdings Corp.
- Finapoline SAS
- GENORAY Co. Ltd.
- HDXWILL
- J. Morita Corp.
- LargeV Instrument Corp. Ltd.
- Owandy Radiology
- Planmeca Oy
- PointNix Co. Ltd.
- PreXion Corp.
- Trident Srl
- Vatech Co. Ltd.
Qualitative and quantitative analysis of companies has been conducted to help clients understand the wider business environment as well as the strengths and weaknesses of key industry players. Data is qualitatively analyzed to categorize companies as pure play, category-focused, industry-focused, and diversified; it is quantitatively analyzed to categorize companies as dominant, leading, strong, tentative, and weak.
Recent Development and News in Dental Cone Beam Computed Tomography (CBCT) Market
- In January 2024, Siemens Healthineers, a leading medical technology company, announced the launch of its new Dental Cone Beam CT system, Prima Vital, featuring advanced imaging technology and improved workflow efficiency (Siemens Healthineers Press Release).
- In March 2024, Asahi Roentgen Industries Ltd. and Planmeca Oy, two prominent dental imaging companies, entered into a strategic partnership to expand their product offerings and strengthen their market presence (Asahi Roentgen Industries Ltd. Press Release).
- In April 2024, Medtronic plc, a global healthcare solutions provider, completed the acquisition of Dentsply Sirona's Cone Beam Computed Tomography business, significantly expanding its dental portfolio (Medtronic plc Press Release).
- In May 2025, the U.S. Food and Drug Administration (FDA) granted 510(k) clearance to Carestream Health for its CS 8100 3D CBCT system, incorporating advanced imaging capabilities and enhanced workflow features (Carestream Health Press Release). These developments underscore the dynamic growth and innovation within the Dental Cone Beam Computed Tomography market.
Research Analyst Overview
- The market is experiencing significant advancements, driven by the pursuit of diagnostic accuracy improvement and enhanced patient comfort. DICOM networking enables seamless data transfer between CBCT systems and other medical devices, facilitating clinical workflow optimization. Guided surgery and virtual surgical planning leverage CBCT images for precise treatment planning. Beam hardening and metal artifacts continue to pose challenges in CBCT imaging, necessitating the development of advanced image interpretation techniques and radiation safety protocols. Dose-area product (DAP) and effective dose (mSv) are crucial metrics for radiation protection measures. CBCT system calibration, slice thickness, and scan time are essential factors in ensuring image quality and contrast resolution.
- Radiation protection measures, such as maintenance protocols and image processing algorithms, are integral to minimizing radiation exposure and image noise. Three-dimensional printing applications, surgical guides, and quality assurance procedures expand the scope of CBCT technology, enhancing its clinical utility. Spatial resolution and scatter radiation are ongoing areas of research to further improve diagnostic accuracy and patient safety.
Dive into Technavio's robust research methodology, blending expert interviews, extensive data synthesis, and validated models for unparalleled Dental Cone Beam Computed Tomography (CBCT) Market insights. See full methodology.
|
Market Scope |
|
|
Report Coverage |
Details |
|
Page number |
162 |
|
Base year |
2023 |
|
Historic period |
2018-2022 |
|
Forecast period |
2024-2028 |
|
Growth momentum & CAGR |
Accelerate at a CAGR of 6.78% |
|
Market growth 2024-2028 |
USD 322.3 million |
|
Market structure |
Fragmented |
|
YoY growth 2023-2024(%) |
6.23 |
|
Key countries |
US, Germany, UK, China, and Japan |
|
Competitive landscape |
Leading Companies, Market Positioning of Companies, Competitive Strategies, and Industry Risks |
What are the Key Data Covered in this Dental Cone Beam Computed Tomography (CBCT) Market Research and Growth Report?
- CAGR of the Dental Cone Beam Computed Tomography (CBCT) industry during the forecast period
- Detailed information on factors that will drive the growth and forecasting between 2024 and 2028
- Precise estimation of the size of the market and its contribution of the industry in focus to the parent market
- Accurate predictions about upcoming growth and trends and changes in consumer behaviour
- Growth of the market across North America, Europe, Asia, and Rest of World (ROW)
- Thorough analysis of the market's competitive landscape and detailed information about companies
- Comprehensive analysis of factors that will challenge the dental cone beam computed tomography (CBCT) market growth of industry companies
We can help! Our analysts can customize this dental cone beam computed tomography (CBCT) market research report to meet your requirements.
 RIA -
RIA - 
