Polar Polymers Market Analysis, Size, and Forecast 2026-2030: APAC (China, Japan, and India), North America (US, Canada, and Mexico), Europe (Germany, UK, and France), South America (Brazil, Argentina, and Colombia), Middle East and Africa (Saudi Arabia, UAE, and South Africa), and Rest of World (ROW)

Polar Polymers Market Analysis, Size, and Forecast 2026-2030:
APAC (China, Japan, and India), North America (US, Canada, and Mexico), Europe (Germany, UK, and France), South America (Brazil, Argentina, and Colombia), Middle East and Africa (Saudi Arabia, UAE, and South Africa), and Rest of World (ROW)

Published: Dec 2025 322 Pages SKU: IRTNTR81186

Market Overview at a Glance

$22.10 B
Market Opportunity
7.2%
CAGR 2025 - 2030
49.9%
APAC Growth
$21.49 B
Polyamide segment 2024

Polar Polymers Market Size 2026-2030

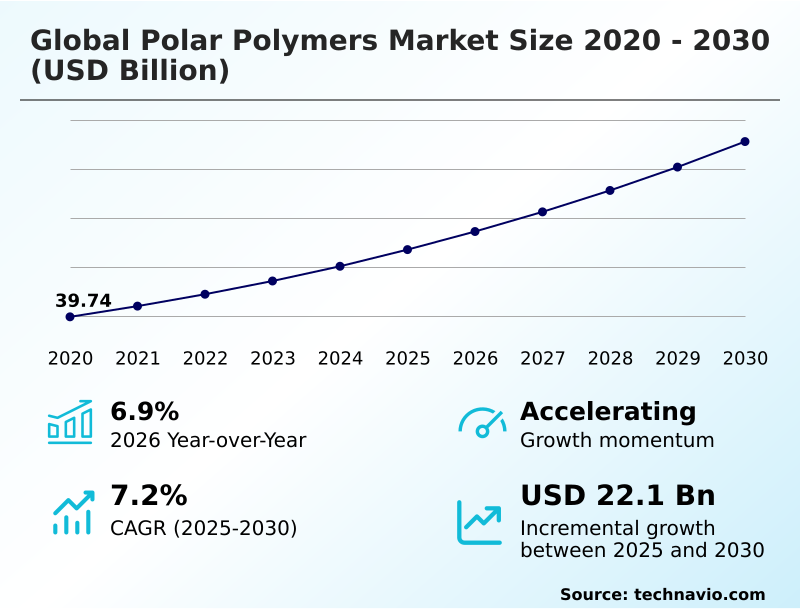
The polar polymers market size is valued to increase by USD 22.10 billion, at a CAGR of 7.2% from 2025 to 2030. Surging adoption of electric vehicles and advanced electronics propelling demand will drive the polar polymers market.

Major Market Trends & Insights

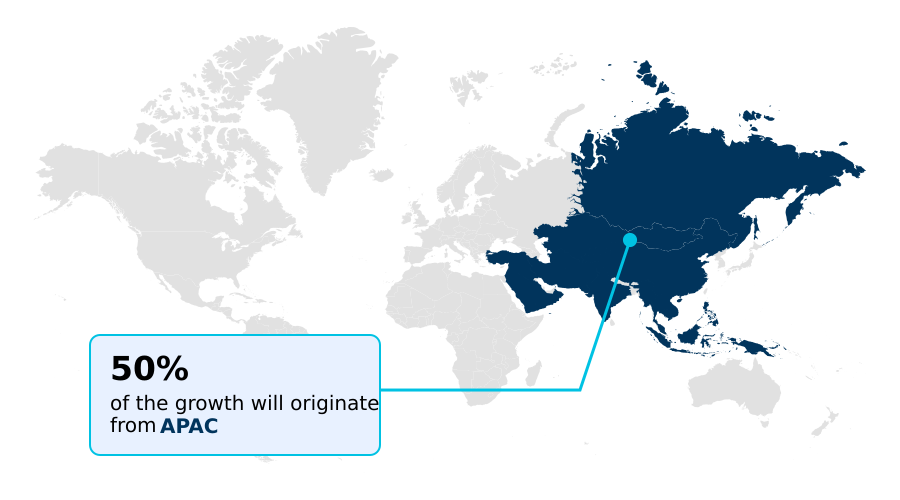
  • APAC dominated the market and accounted for a 49.9% growth during the forecast period.
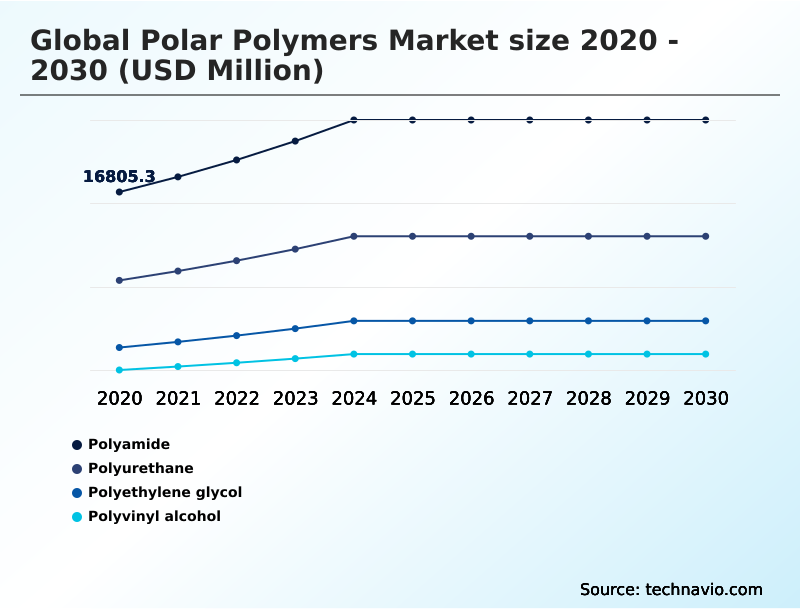
  • By Type - Polyamide segment was valued at USD 21.49 billion in 2024
  • By Application - Films segment accounted for the largest market revenue share in 2024

Market Size & Forecast

  • Market Opportunities: USD 35.85 billion
  • Market Future Opportunities: USD 22.10 billion
  • CAGR from 2025 to 2030 : 7.2%

Market Summary

  • The polar polymers market is defined by materials exhibiting distinct properties like adhesion and chemical resistance, stemming from their molecular structure. This makes them indispensable in high-performance applications. Key drivers include the global transition to electric mobility and the expansion of the healthcare sector, which demand materials with superior thermal and mechanical characteristics.
  • A major trend is the industry's pivot toward sustainability, with a focus on bio-based feedstocks and establishing circular economies to address regulatory pressures and consumer preferences. For instance, an automotive original equipment manufacturer must now evaluate material substitutions, balancing the performance of an advanced polyamide against the cost benefits of a modified non-polar alternative to meet new recycled-content mandates.
  • This scenario directly impacts its supply chain and compliance strategy. However, the market faces challenges from volatile feedstock prices and intense competition from alternative materials, which can narrow profit margins and influence material selection in cost-sensitive applications. The interplay of these dynamics shapes a market characterized by continuous innovation in material science.

What will be the Size of the Polar Polymers Market during the forecast period?

Get Key Insights on Market Forecast (PDF) Request Free Sample

How is the Polar Polymers Market Segmented?

The polar polymers industry research report provides comprehensive data (region-wise segment analysis), with forecasts and estimates in "USD million" for the period 2026-2030, as well as historical data from 2020-2024 for the following segments.

  • Type
    • Polyamide
    • Polyurethane
    • Polyethylene glycol
    • Polyvinyl alcohol
  • Application
    • Films
    • Coatings
    • Adhesives
    • Others
  • End-user
    • Electronics
    • Consumer goods
    • Automotive
    • Medical
  • Geography
    • APAC
      • China
      • Japan
      • India
    • North America
      • US
      • Canada
      • Mexico
    • Europe
      • Germany
      • UK
      • France
    • South America
      • Brazil
      • Argentina
      • Colombia
    • Middle East and Africa
      • Saudi Arabia
      • UAE
      • South Africa
    • Rest of World (ROW)

By Type Insights

The polyamide segment is estimated to witness significant growth during the forecast period.

The polyamide segment is foundational to the market for engineering plastics, driven by the unique properties derived from its molecular structure.

This class of polymers is indispensable in demanding sectors such as automotive components and e-mobility applications, where its high mechanical strength and thermal stability are critical for under-the-hood parts and battery systems.

The market is also heavily influenced by the adoption of circular economy models, pushing for innovations in advanced polymer science to improve the recyclability of materials used in consumer goods packaging and medical device manufacturing.

With a demonstrated year-over-year expansion of 6.9%, the segment's trajectory is tied to its role in producing lightweighting materials and its electrical insulation properties, which are essential for textile fibers and modern construction materials.

Request Free Sample

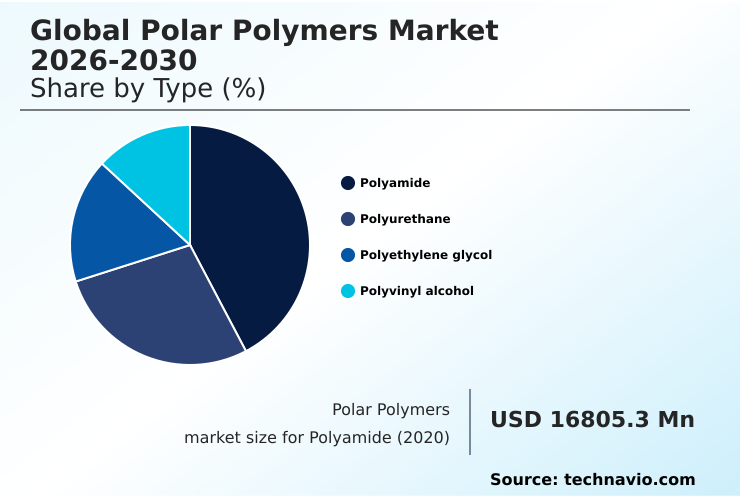
The Polyamide segment was valued at USD 21.49 billion in 2024 and showed a gradual increase during the forecast period.

Request Free Sample

Regional Analysis

APAC is estimated to contribute 49.9% to the growth of the global market during the forecast period.Technavio’s analysts have elaborately explained the regional trends and drivers that shape the market during the forecast period.

See How Polar Polymers Market Demand is Rising in APAC Request Free Sample

The geographic landscape of the market is increasingly dominated by the APAC region, which is projected to contribute nearly 50% of incremental growth.

This is driven by its role as a global manufacturing hub for electronics and automotive sectors, creating massive demand for polar polymer chemistry.

In contrast, the markets in North America and Europe are characterized by technological maturity and a strong focus on sustainability.

Europe's stringent regulations, which mandate a significant reduction in packaging waste, are accelerating the adoption of materials with high surface energy and recyclability. The use of waterborne polyurethane dispersions and structural adhesives is expanding due to environmental compliance needs.

These regional differences require producers to tailor their polymer formulations, leveraging properties like dipole-dipole interactions to meet diverse performance and regulatory standards across the globe.

Market Dynamics

Our researchers analyzed the data with 2025 as the base year, along with the key drivers, trends, and challenges. A holistic analysis of drivers will help companies refine their marketing strategies to gain a competitive advantage.

  • Strategic decisions within the global polar polymers market 2026-2030 are increasingly shaped by nuanced material trade-offs. The impact of polar polymers in EVs is profound, with PVDF binders for lithium-ion batteries becoming a critical component for enhancing energy density and lifespan. In parallel, polyurethane foam for building insulation addresses energy efficiency mandates.
  • The choice between polyamide versus polypropylene in automotive interiors often hinges on balancing scratch resistance with cost. For high-frequency electronics, selecting advanced materials for 5G infrastructure can reduce signal loss by a factor of two compared to standard options. The trend towards polar polymers for medical device manufacturing is driven by biocompatibility and sterilization needs, particularly for single-use devices.
  • In packaging, the debate around bio-based polar polymers in packaging and recycled PET in food-grade packaging is guided by circular economy goals. At the same time, advancements in polar polymer films for flexible displays are enabling new product form factors.
  • Innovations in waterborne coatings for VOC reduction and polar polymers in structural adhesives for lightweighting reflect responses to regulatory pressures and performance demands, while PFAS restrictions on fluoropolymer usage present significant challenges for certain high-performance applications.

What are the key market drivers leading to the rise in the adoption of Polar Polymers Industry?

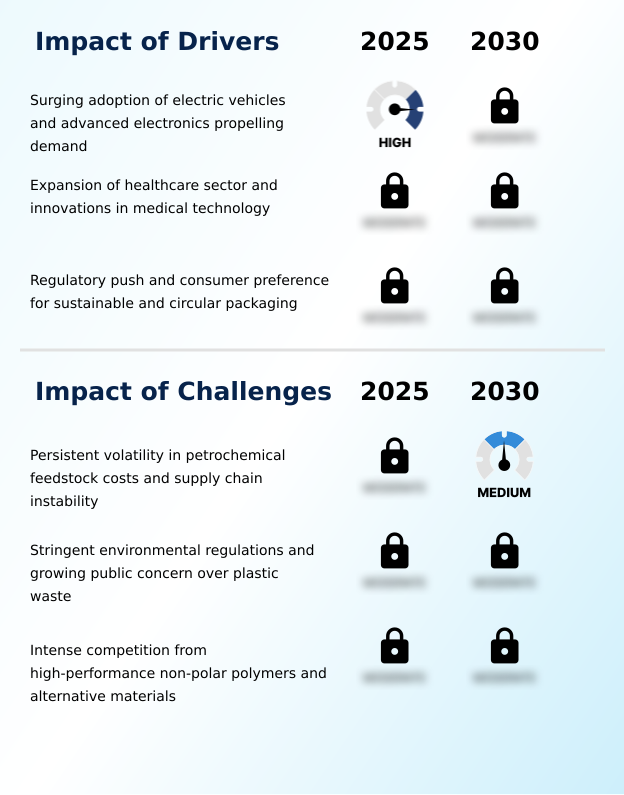
  • The surging adoption of electric vehicles and the continuous advancement of electronic devices are key drivers propelling demand in the market.

  • Demand is being significantly propelled by the growth of electric vehicles and advanced electronics. These sectors require high-performance polyamides and flame-retardant polymers for critical applications like thermal management systems and electronic device housings, where safety and reliability are paramount.
  • In EV batteries, polyvinylidene fluoride (PVDF) is a key material, while low-dielectric-loss materials are essential for 5G telecommunications infrastructure and advanced driver-assistance systems. Lightweighting with polar polymers in EVs can improve battery range by up to 8%.
  • The healthcare industry also contributes, with a rising need for single-use medical devices and in-vitro diagnostic platforms. This, coupled with extended producer responsibility regulations, fuels demand for materials suitable for food-grade containers and advanced composite material bonding.

What are the market trends shaping the Polar Polymers Industry?

  • The proliferation of bio-based and circular polar polymers represents a significant market trend. This shift is primarily driven by mounting regulatory requirements and increasing consumer demand for sustainable materials.

  • A dominant trend is the accelerated shift toward sustainability, driven by corporate ESG mandates and stringent environmental compliance. This is materializing through the development of bio-based polar polymers and robust circular supply chains, with chemical recycling technologies enabling the reuse of materials like recycled polyethylene terephthalate.
  • The industry is moving toward mono-material solutions to enhance recyclability, supported by innovative polymer formulations. New thermoplastic polymers derived from renewable feedstocks offer a carbon footprint reduction of up to 40% compared to fossil-based counterparts.
  • This pivot is critical in advanced electronics and for lightweighting in transportation, where sustainable packaging solutions are no longer a niche but a core requirement, compelling rapid innovation across the sector.

What challenges does the Polar Polymers Industry face during its growth?

  • Persistent volatility in petrochemical feedstock costs, compounded by ongoing supply chain instability, presents a key challenge to industry growth.

  • The market faces considerable headwinds from volatile petrochemical feedstocks, where price swings have caused manufacturing costs to fluctuate by as much as 25% quarter-over-quarter, creating significant supply chain instability.
  • Compounding this is the intense regulatory scrutiny on substances like per- and polyfluoroalkyl substances (PFAS) and volatile organic compounds (VOCs), which threatens the use of some high-performance fluoropolymers and traditional solvent-based systems. There is also persistent alternative material competition from non-polar polymers and advanced composites, particularly in multi-material assemblies where cost is a primary factor.
  • Innovators must focus on properties unique to polar polymers, such as hydrogen bonding, and promote sustainable options like bio-based sourcing and waterborne systems to defend their value proposition against these challenges.

Exclusive Technavio Analysis on Customer Landscape

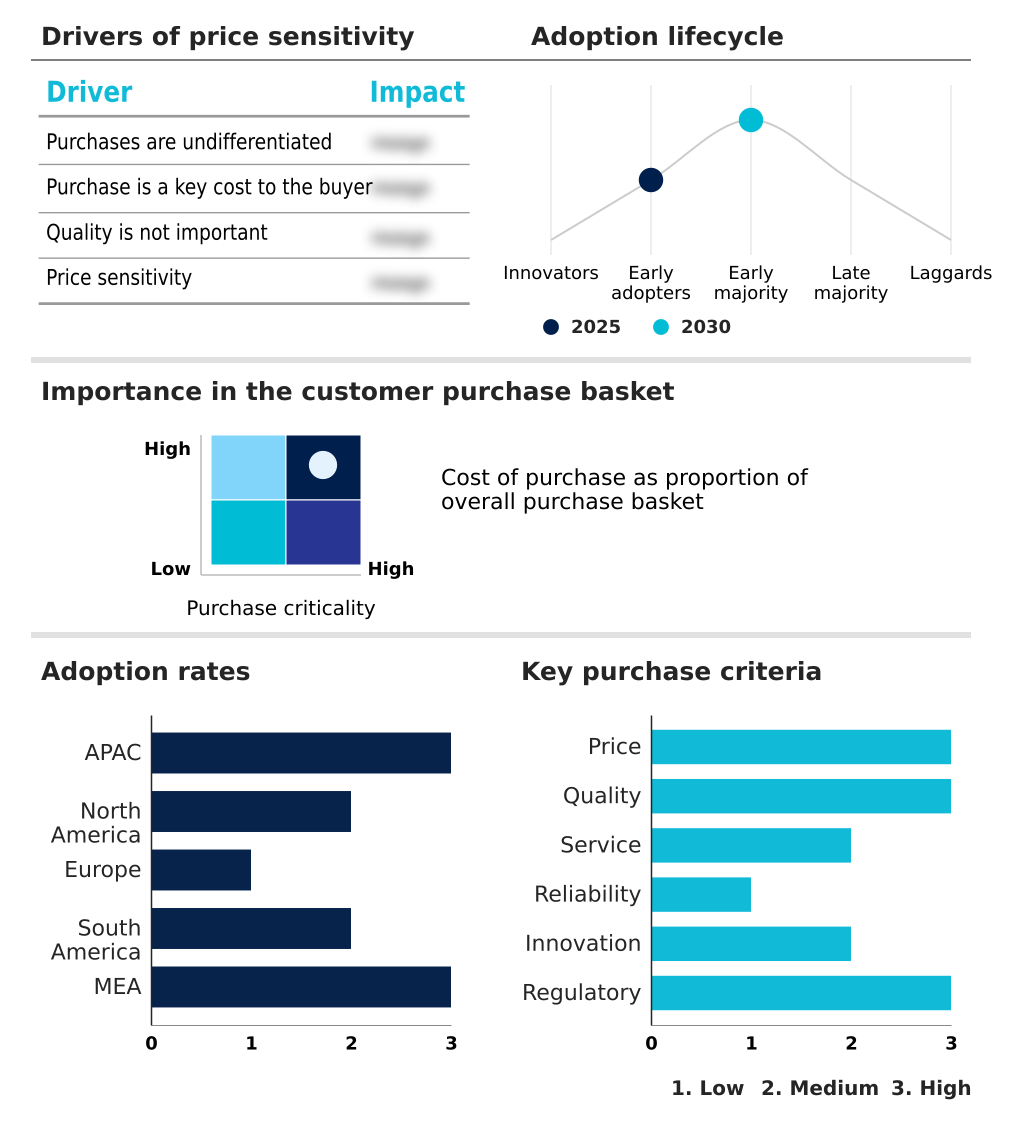
The polar polymers market forecasting report includes the adoption lifecycle of the market, covering from the innovator’s stage to the laggard’s stage. It focuses on adoption rates in different regions based on penetration. Furthermore, the polar polymers market report also includes key purchase criteria and drivers of price sensitivity to help companies evaluate and develop their market growth analysis strategies.

Customer Landscape of Polar Polymers Industry

Competitive Landscape

Companies are implementing various strategies, such as strategic alliances, polar polymers market forecast, partnerships, mergers and acquisitions, geographical expansion, and product/service launches, to enhance their presence in the industry.

Arkema Group - The firm's offerings center on high-performance specialty polymers, including advanced materials, adhesives, and coating solutions for demanding industrial applications.

The industry research and growth report includes detailed analyses of the competitive landscape of the market and information about key companies, including:

  • Arkema Group
  • Asahi Kasei Corp.
  • BASF SE
  • Celanese Corp.
  • Covestro AG
  • Dow Chemical Co.
  • DuPont de Nemours Inc.
  • Eastman Chemical Co.
  • Evonik Industries AG
  • Formosa Plastics Corp.
  • Huntsman International LLC
  • Lanxess AG
  • LG Chem Ltd.
  • LyondellBasell Industries NV
  • Mitsubishi Chemical Grp.
  • Saudi Basic Industries
  • Shin Etsu Chemical Co. Ltd.
  • Solvay SA
  • Sumitomo Chemical Co. Ltd.
  • Toray Industries Inc.

Qualitative and quantitative analysis of companies has been conducted to help clients understand the wider business environment as well as the strengths and weaknesses of key industry players. Data is qualitatively analyzed to categorize companies as pure play, category-focused, industry-focused, and diversified; it is quantitatively analyzed to categorize companies as dominant, leading, strong, tentative, and weak.

Recent Development and News in Polar polymers market

  • In September, 2024, a leading European chemical firm announced the successful commercial-scale production of a new bio-based polyamide derived from non-food agricultural waste, targeting automotive and textile applications.
  • In November, 2024, a major Asia-based materials supplier launched a next-generation PVDF binder for EV battery cathodes, promising a 10% increase in charging speeds and cycle life.
  • In February, 2025, a North American consortium of polymer manufacturers and automotive OEMs initiated a large-scale pilot program for the chemical recycling of end-of-life vehicle components back into virgin-quality engineering plastics.
  • In April, 2025, an American adhesives specialist received aerospace certification for a new structural adhesive designed for bonding dissimilar composite materials, enabling further lightweighting in next-generation aircraft.

Dive into Technavio’s robust research methodology, blending expert interviews, extensive data synthesis, and validated models for unparalleled Polar Polymers Market insights. See full methodology.

Market Scope
Page number 322
Base year 2025
Historic period 2020-2024
Forecast period 2026-2030
Growth momentum & CAGR Accelerate at a CAGR of 7.2%
Market growth 2026-2030 USD 22104.8 million
Market structure Fragmented
YoY growth 2025-2026(%) 6.9%
Key countries China, Japan, India, South Korea, Australia, Indonesia, US, Canada, Mexico, Germany, UK, France, Italy, Spain, The Netherlands, Brazil, Argentina, Colombia, Saudi Arabia, UAE, South Africa, Israel and Turkey
Competitive landscape Leading Companies, Market Positioning of Companies, Competitive Strategies, and Industry Risks

Request Free Sample

Research Analyst Overview

  • The polar polymers market is advancing through continuous material innovation tailored for high-stakes industries. Its trajectory is defined by the development of engineered plastics and specialty polyesters with superior thermal management systems and electrical insulation properties. The adoption of these materials is not merely a technical upgrade but a strategic imperative.
  • For instance, boardroom decisions are now heavily influenced by the regulatory landscape surrounding per- and polyfluoroalkyl substances; choosing to invest in PFAS-free alternatives versus risking future market access has profound budgetary and product strategy implications.
  • With the market demonstrating a year-over-year expansion of 6.9%, the emphasis is on creating advanced polymer science solutions, including polymer matrix composites and lightweighting materials, that deliver performance while navigating complex compliance frameworks. This involves a deep understanding of polar polymer chemistry to create formulations that meet the demands of applications from single-use medical devices to durable food-grade containers.

What are the Key Data Covered in this Polar Polymers Market Research and Growth Report?

  • What is the expected growth of the Polar Polymers Market between 2026 and 2030?

    • USD 22.10 billion, at a CAGR of 7.2%

  • What segmentation does the market report cover?

    • The report is segmented by Type (Polyamide, Polyurethane, Polyethylene glycol, and Polyvinyl alcohol), Application (Films, Coatings, Adhesives, and Others), End-user (Electronics, Consumer goods, Automotive, and Medical) and Geography (APAC, North America, Europe, South America, Middle East and Africa)

  • Which regions are analyzed in the report?

    • APAC, North America, Europe, South America and Middle East and Africa

  • What are the key growth drivers and market challenges?

    • Surging adoption of electric vehicles and advanced electronics propelling demand, Persistent volatility in petrochemical feedstock costs and supply chain instability

  • Who are the major players in the Polar Polymers Market?

    • Arkema Group, Asahi Kasei Corp., BASF SE, Celanese Corp., Covestro AG, Dow Chemical Co., DuPont de Nemours Inc., Eastman Chemical Co., Evonik Industries AG, Formosa Plastics Corp., Huntsman International LLC, Lanxess AG, LG Chem Ltd., LyondellBasell Industries NV, Mitsubishi Chemical Grp., Saudi Basic Industries, Shin Etsu Chemical Co. Ltd., Solvay SA, Sumitomo Chemical Co. Ltd. and Toray Industries Inc.

Market Research Insights

  • The market is shaped by a dynamic interplay between technological advancement and regulatory pressures. The push for e-mobility applications and environmental compliance is accelerating innovation, with structural adhesives enabling a component weight reduction of 25% compared to mechanical fasteners in some automotive components. This focus on performance is mirrored in advanced electronics, where new materials are essential.
  • Concurrently, corporate ESG mandates and the need for circular supply chains are compelling manufacturers to adopt renewable feedstocks. In the coatings sector, the transition to waterborne systems has reduced VOC emissions by over 70% in certain facilities, aligning with stricter green building codes. This evolution creates opportunities for firms that can deliver high-performance materials through sustainable and compliant processes.

We can help! Our analysts can customize this polar polymers market research report to meet your requirements.

Get in touch

1. Executive Summary

1.1 Market overview

Executive Summary - Chart on Market Overview
Executive Summary - Data Table on Market Overview
Executive Summary - Chart on Global Market Characteristics
Executive Summary - Chart on Market by Geography
Executive Summary - Chart on Market Segmentation by Type
Executive Summary - Chart on Market Segmentation by Application
Executive Summary - Chart on Market Segmentation by End-user
Executive Summary - Chart on Incremental Growth
Executive Summary - Data Table on Incremental Growth
Executive Summary - Chart on Company Market Positioning

2. Technavio Analysis

2.1 Analysis of price sensitivity, lifecycle, customer purchase basket, adoption rates, and purchase criteria

2.2 Criticality of inputs and Factors of differentiation

Chart on Overview on criticality of inputs and factors of differentiation

2.3 Factors of disruption

Chart on Overview on factors of disruption

2.4 Impact of drivers and challenges

Chart on Impact of drivers and challenges in 2025 and 2030

3. Market Landscape

3.1 Market ecosystem

Chart on Parent Market
Data Table on - Parent Market

3.2 Market characteristics

Chart on Market characteristics analysis

3.3 Value chain analysis

Chart on Value chain analysis

4. Market Sizing

4.1 Market definition

Data Table on Offerings of companies included in the market definition

4.2 Market segment analysis

Market segments

4.3 Market size 2025

4.4 Market outlook: Forecast for 2025-2030

Chart on Global - Market size and forecast 2025-2030 ($ million)
Data Table on Global - Market size and forecast 2025-2030 ($ million)
Chart on Global Market: Year-over-year growth 2025-2030 (%)
Data Table on Global Market: Year-over-year growth 2025-2030 (%)

5. Historic Market Size

5.1 Global Polar Polymers Market 2020 - 2024

Historic Market Size - Data Table on Global Polar Polymers Market 2020 - 2024 ($ million)

5.2 Type segment analysis 2020 - 2024

Historic Market Size - Type Segment 2020 - 2024 ($ million)

5.3 Application segment analysis 2020 - 2024

Historic Market Size - Application Segment 2020 - 2024 ($ million)

5.4 End-user segment analysis 2020 - 2024

Historic Market Size - End-user Segment 2020 - 2024 ($ million)

5.5 Geography segment analysis 2020 - 2024

Historic Market Size - Geography Segment 2020 - 2024 ($ million)

5.6 Country segment analysis 2020 - 2024

Historic Market Size - Country Segment 2020 - 2024 ($ million)

6. Qualitative Analysis

6.1 Impact of AI in global polar polymers market

7. Five Forces Analysis

7.1 Five forces summary

Five forces analysis - Comparison between 2025 and 2030

7.2 Bargaining power of buyers

Bargaining power of buyers - Impact of key factors 2025 and 2030

7.3 Bargaining power of suppliers

Bargaining power of suppliers - Impact of key factors in 2025 and 2030

7.4 Threat of new entrants

Threat of new entrants - Impact of key factors in 2025 and 2030

7.5 Threat of substitutes

Threat of substitutes - Impact of key factors in 2025 and 2030

7.6 Threat of rivalry

Threat of rivalry - Impact of key factors in 2025 and 2030

7.7 Market condition

Chart on Market condition - Five forces 2025 and 2030

8. Market Segmentation by Type

8.1 Market segments

Chart on Type - Market share 2025-2030 (%)
Data Table on Type - Market share 2025-2030 (%)

8.2 Comparison by Type

Chart on Comparison by Type
Data Table on Comparison by Type

8.3 Polyamide - Market size and forecast 2025-2030

Chart on Polyamide - Market size and forecast 2025-2030 ($ million)
Data Table on Polyamide - Market size and forecast 2025-2030 ($ million)
Chart on Polyamide - Year-over-year growth 2025-2030 (%)
Data Table on Polyamide - Year-over-year growth 2025-2030 (%)

8.4 Polyurethane - Market size and forecast 2025-2030

Chart on Polyurethane - Market size and forecast 2025-2030 ($ million)
Data Table on Polyurethane - Market size and forecast 2025-2030 ($ million)
Chart on Polyurethane - Year-over-year growth 2025-2030 (%)
Data Table on Polyurethane - Year-over-year growth 2025-2030 (%)

8.5 Polyethylene glycol - Market size and forecast 2025-2030

Chart on Polyethylene glycol - Market size and forecast 2025-2030 ($ million)
Data Table on Polyethylene glycol - Market size and forecast 2025-2030 ($ million)
Chart on Polyethylene glycol - Year-over-year growth 2025-2030 (%)
Data Table on Polyethylene glycol - Year-over-year growth 2025-2030 (%)

8.6 Polyvinyl alcohol - Market size and forecast 2025-2030

Chart on Polyvinyl alcohol - Market size and forecast 2025-2030 ($ million)
Data Table on Polyvinyl alcohol - Market size and forecast 2025-2030 ($ million)
Chart on Polyvinyl alcohol - Year-over-year growth 2025-2030 (%)
Data Table on Polyvinyl alcohol - Year-over-year growth 2025-2030 (%)

8.7 Market opportunity by Type

Market opportunity by Type ($ million)
Data Table on Market opportunity by Type ($ million)

9. Market Segmentation by Application

9.1 Market segments

Chart on Application - Market share 2025-2030 (%)
Data Table on Application - Market share 2025-2030 (%)

9.2 Comparison by Application

Chart on Comparison by Application
Data Table on Comparison by Application

9.3 Films - Market size and forecast 2025-2030

Chart on Films - Market size and forecast 2025-2030 ($ million)
Data Table on Films - Market size and forecast 2025-2030 ($ million)
Chart on Films - Year-over-year growth 2025-2030 (%)
Data Table on Films - Year-over-year growth 2025-2030 (%)

9.4 Coatings - Market size and forecast 2025-2030

Chart on Coatings - Market size and forecast 2025-2030 ($ million)
Data Table on Coatings - Market size and forecast 2025-2030 ($ million)
Chart on Coatings - Year-over-year growth 2025-2030 (%)
Data Table on Coatings - Year-over-year growth 2025-2030 (%)

9.5 Adhesives - Market size and forecast 2025-2030

Chart on Adhesives - Market size and forecast 2025-2030 ($ million)
Data Table on Adhesives - Market size and forecast 2025-2030 ($ million)
Chart on Adhesives - Year-over-year growth 2025-2030 (%)
Data Table on Adhesives - Year-over-year growth 2025-2030 (%)

9.6 Others - Market size and forecast 2025-2030

Chart on Others - Market size and forecast 2025-2030 ($ million)
Data Table on Others - Market size and forecast 2025-2030 ($ million)
Chart on Others - Year-over-year growth 2025-2030 (%)
Data Table on Others - Year-over-year growth 2025-2030 (%)

9.7 Market opportunity by Application

Market opportunity by Application ($ million)
Data Table on Market opportunity by Application ($ million)

10. Market Segmentation by End-user

10.1 Market segments

Chart on End-user - Market share 2025-2030 (%)
Data Table on End-user - Market share 2025-2030 (%)

10.2 Comparison by End-user

Chart on Comparison by End-user
Data Table on Comparison by End-user

10.3 Electronics - Market size and forecast 2025-2030

Chart on Electronics - Market size and forecast 2025-2030 ($ million)
Data Table on Electronics - Market size and forecast 2025-2030 ($ million)
Chart on Electronics - Year-over-year growth 2025-2030 (%)
Data Table on Electronics - Year-over-year growth 2025-2030 (%)

10.4 Consumer goods - Market size and forecast 2025-2030

Chart on Consumer goods - Market size and forecast 2025-2030 ($ million)
Data Table on Consumer goods - Market size and forecast 2025-2030 ($ million)
Chart on Consumer goods - Year-over-year growth 2025-2030 (%)
Data Table on Consumer goods - Year-over-year growth 2025-2030 (%)

10.5 Automotive - Market size and forecast 2025-2030

Chart on Automotive - Market size and forecast 2025-2030 ($ million)
Data Table on Automotive - Market size and forecast 2025-2030 ($ million)
Chart on Automotive - Year-over-year growth 2025-2030 (%)
Data Table on Automotive - Year-over-year growth 2025-2030 (%)

10.6 Medical - Market size and forecast 2025-2030

Chart on Medical - Market size and forecast 2025-2030 ($ million)
Data Table on Medical - Market size and forecast 2025-2030 ($ million)
Chart on Medical - Year-over-year growth 2025-2030 (%)
Data Table on Medical - Year-over-year growth 2025-2030 (%)

10.7 Market opportunity by End-user

Market opportunity by End-user ($ million)
Data Table on Market opportunity by End-user ($ million)

11. Customer Landscape

11.1 Customer landscape overview

Analysis of price sensitivity, lifecycle, customer purchase basket, adoption rates, and purchase criteria

12. Geographic Landscape

12.1 Geographic segmentation

Chart on Market share by geography 2025-2030 (%)
Data Table on Market share by geography 2025-2030 (%)

12.2 Geographic comparison

Chart on Geographic comparison
Data Table on Geographic comparison

12.3 APAC - Market size and forecast 2025-2030

Chart on APAC - Market size and forecast 2025-2030 ($ million)
Data Table on APAC - Market size and forecast 2025-2030 ($ million)
Chart on APAC - Year-over-year growth 2025-2030 (%)
Data Table on APAC - Year-over-year growth 2025-2030 (%)
Chart on Regional Comparison - APAC
Data Table on Regional Comparison - APAC

12.3.1 China - Market size and forecast 2025-2030

Chart on China - Market size and forecast 2025-2030 ($ million)
Data Table on China - Market size and forecast 2025-2030 ($ million)
Chart on China - Year-over-year growth 2025-2030 (%)
Data Table on China - Year-over-year growth 2025-2030 (%)

12.3.2 Japan - Market size and forecast 2025-2030

Chart on Japan - Market size and forecast 2025-2030 ($ million)
Data Table on Japan - Market size and forecast 2025-2030 ($ million)
Chart on Japan - Year-over-year growth 2025-2030 (%)
Data Table on Japan - Year-over-year growth 2025-2030 (%)

12.3.3 India - Market size and forecast 2025-2030

Chart on India - Market size and forecast 2025-2030 ($ million)
Data Table on India - Market size and forecast 2025-2030 ($ million)
Chart on India - Year-over-year growth 2025-2030 (%)
Data Table on India - Year-over-year growth 2025-2030 (%)

12.3.4 South Korea - Market size and forecast 2025-2030

Chart on South Korea - Market size and forecast 2025-2030 ($ million)
Data Table on South Korea - Market size and forecast 2025-2030 ($ million)
Chart on South Korea - Year-over-year growth 2025-2030 (%)
Data Table on South Korea - Year-over-year growth 2025-2030 (%)

12.3.5 Australia - Market size and forecast 2025-2030

Chart on Australia - Market size and forecast 2025-2030 ($ million)
Data Table on Australia - Market size and forecast 2025-2030 ($ million)
Chart on Australia - Year-over-year growth 2025-2030 (%)
Data Table on Australia - Year-over-year growth 2025-2030 (%)

12.3.6 Indonesia - Market size and forecast 2025-2030

Chart on Indonesia - Market size and forecast 2025-2030 ($ million)
Data Table on Indonesia - Market size and forecast 2025-2030 ($ million)
Chart on Indonesia - Year-over-year growth 2025-2030 (%)
Data Table on Indonesia - Year-over-year growth 2025-2030 (%)

12.4 North America - Market size and forecast 2025-2030

Chart on North America - Market size and forecast 2025-2030 ($ million)
Data Table on North America - Market size and forecast 2025-2030 ($ million)
Chart on North America - Year-over-year growth 2025-2030 (%)
Data Table on North America - Year-over-year growth 2025-2030 (%)
Chart on Regional Comparison - North America
Data Table on Regional Comparison - North America

12.4.1 US - Market size and forecast 2025-2030

Chart on US - Market size and forecast 2025-2030 ($ million)
Data Table on US - Market size and forecast 2025-2030 ($ million)
Chart on US - Year-over-year growth 2025-2030 (%)
Data Table on US - Year-over-year growth 2025-2030 (%)

12.4.2 Canada - Market size and forecast 2025-2030

Chart on Canada - Market size and forecast 2025-2030 ($ million)
Data Table on Canada - Market size and forecast 2025-2030 ($ million)
Chart on Canada - Year-over-year growth 2025-2030 (%)
Data Table on Canada - Year-over-year growth 2025-2030 (%)

12.4.3 Mexico - Market size and forecast 2025-2030

Chart on Mexico - Market size and forecast 2025-2030 ($ million)
Data Table on Mexico - Market size and forecast 2025-2030 ($ million)
Chart on Mexico - Year-over-year growth 2025-2030 (%)
Data Table on Mexico - Year-over-year growth 2025-2030 (%)

12.5 Europe - Market size and forecast 2025-2030

Chart on Europe - Market size and forecast 2025-2030 ($ million)
Data Table on Europe - Market size and forecast 2025-2030 ($ million)
Chart on Europe - Year-over-year growth 2025-2030 (%)
Data Table on Europe - Year-over-year growth 2025-2030 (%)
Chart on Regional Comparison - Europe
Data Table on Regional Comparison - Europe

12.5.1 Germany - Market size and forecast 2025-2030

Chart on Germany - Market size and forecast 2025-2030 ($ million)
Data Table on Germany - Market size and forecast 2025-2030 ($ million)
Chart on Germany - Year-over-year growth 2025-2030 (%)
Data Table on Germany - Year-over-year growth 2025-2030 (%)

12.5.2 UK - Market size and forecast 2025-2030

Chart on UK - Market size and forecast 2025-2030 ($ million)
Data Table on UK - Market size and forecast 2025-2030 ($ million)
Chart on UK - Year-over-year growth 2025-2030 (%)
Data Table on UK - Year-over-year growth 2025-2030 (%)

12.5.3 France - Market size and forecast 2025-2030

Chart on France - Market size and forecast 2025-2030 ($ million)
Data Table on France - Market size and forecast 2025-2030 ($ million)
Chart on France - Year-over-year growth 2025-2030 (%)
Data Table on France - Year-over-year growth 2025-2030 (%)

12.5.4 Italy - Market size and forecast 2025-2030

Chart on Italy - Market size and forecast 2025-2030 ($ million)
Data Table on Italy - Market size and forecast 2025-2030 ($ million)
Chart on Italy - Year-over-year growth 2025-2030 (%)
Data Table on Italy - Year-over-year growth 2025-2030 (%)

12.5.5 Spain - Market size and forecast 2025-2030

Chart on Spain - Market size and forecast 2025-2030 ($ million)
Data Table on Spain - Market size and forecast 2025-2030 ($ million)
Chart on Spain - Year-over-year growth 2025-2030 (%)
Data Table on Spain - Year-over-year growth 2025-2030 (%)

12.5.6 The Netherlands - Market size and forecast 2025-2030

Chart on The Netherlands - Market size and forecast 2025-2030 ($ million)
Data Table on The Netherlands - Market size and forecast 2025-2030 ($ million)
Chart on The Netherlands - Year-over-year growth 2025-2030 (%)
Data Table on The Netherlands - Year-over-year growth 2025-2030 (%)

12.6 South America - Market size and forecast 2025-2030

Chart on South America - Market size and forecast 2025-2030 ($ million)
Data Table on South America - Market size and forecast 2025-2030 ($ million)
Chart on South America - Year-over-year growth 2025-2030 (%)
Data Table on South America - Year-over-year growth 2025-2030 (%)
Chart on Regional Comparison - South America
Data Table on Regional Comparison - South America

12.6.1 Brazil - Market size and forecast 2025-2030

Chart on Brazil - Market size and forecast 2025-2030 ($ million)
Data Table on Brazil - Market size and forecast 2025-2030 ($ million)
Chart on Brazil - Year-over-year growth 2025-2030 (%)
Data Table on Brazil - Year-over-year growth 2025-2030 (%)

12.6.2 Argentina - Market size and forecast 2025-2030

Chart on Argentina - Market size and forecast 2025-2030 ($ million)
Data Table on Argentina - Market size and forecast 2025-2030 ($ million)
Chart on Argentina - Year-over-year growth 2025-2030 (%)
Data Table on Argentina - Year-over-year growth 2025-2030 (%)

12.6.3 Colombia - Market size and forecast 2025-2030

Chart on Colombia - Market size and forecast 2025-2030 ($ million)
Data Table on Colombia - Market size and forecast 2025-2030 ($ million)
Chart on Colombia - Year-over-year growth 2025-2030 (%)
Data Table on Colombia - Year-over-year growth 2025-2030 (%)

12.7 Middle East and Africa - Market size and forecast 2025-2030

Chart on Middle East and Africa - Market size and forecast 2025-2030 ($ million)
Data Table on Middle East and Africa - Market size and forecast 2025-2030 ($ million)
Chart on Middle East and Africa - Year-over-year growth 2025-2030 (%)
Data Table on Middle East and Africa - Year-over-year growth 2025-2030 (%)
Chart on Regional Comparison - Middle East and Africa
Data Table on Regional Comparison - Middle East and Africa

12.7.1 Saudi Arabia - Market size and forecast 2025-2030

Chart on Saudi Arabia - Market size and forecast 2025-2030 ($ million)
Data Table on Saudi Arabia - Market size and forecast 2025-2030 ($ million)
Chart on Saudi Arabia - Year-over-year growth 2025-2030 (%)
Data Table on Saudi Arabia - Year-over-year growth 2025-2030 (%)

12.7.2 UAE - Market size and forecast 2025-2030

Chart on UAE - Market size and forecast 2025-2030 ($ million)
Data Table on UAE - Market size and forecast 2025-2030 ($ million)
Chart on UAE - Year-over-year growth 2025-2030 (%)
Data Table on UAE - Year-over-year growth 2025-2030 (%)

12.7.3 South Africa - Market size and forecast 2025-2030

Chart on South Africa - Market size and forecast 2025-2030 ($ million)
Data Table on South Africa - Market size and forecast 2025-2030 ($ million)
Chart on South Africa - Year-over-year growth 2025-2030 (%)
Data Table on South Africa - Year-over-year growth 2025-2030 (%)

12.7.4 Israel - Market size and forecast 2025-2030

Chart on Israel - Market size and forecast 2025-2030 ($ million)
Data Table on Israel - Market size and forecast 2025-2030 ($ million)
Chart on Israel - Year-over-year growth 2025-2030 (%)
Data Table on Israel - Year-over-year growth 2025-2030 (%)

12.7.5 Turkey - Market size and forecast 2025-2030

Chart on Turkey - Market size and forecast 2025-2030 ($ million)
Data Table on Turkey - Market size and forecast 2025-2030 ($ million)
Chart on Turkey - Year-over-year growth 2025-2030 (%)
Data Table on Turkey - Year-over-year growth 2025-2030 (%)

12.8 Market opportunity by geography

Market opportunity by geography ($ million)
Data Tables on Market opportunity by geography ($ million)

13. Drivers, Challenges, and Opportunity

13.1 Market drivers

Surging adoption of electric vehicles and advanced electronics propelling demand
Expansion of healthcare sector and innovations in medical technology
Regulatory push and consumer preference for sustainable and circular packaging

13.2 Market challenges

Persistent volatility in petrochemical feedstock costs and supply chain instability
Stringent environmental regulations and growing public concern over plastic waste
Intense competition from high-performance non-polar polymers and alternative materials

13.3 Impact of drivers and challenges

Impact of drivers and challenges in 2025 and 2030

13.4 Market opportunities

Proliferation of bio-based and circular polar polymers driven by regulatory and consumer pressure
High performance polar polymers gaining prominence in e-mobility and advanced electronics
Innovations in adhesives and coatings driven by lightweighting and environmental compliance

14. Competitive Landscape

14.1 Overview

14.2

Overview on criticality of inputs and factors of differentiation

14.3 Landscape disruption

Overview on factors of disruption

14.4 Industry risks

Impact of key risks on business

15. Competitive Analysis

15.1 Companies profiled

Companies covered

15.2 Company ranking index

15.3 Market positioning of companies

Matrix on companies position and classification

15.4 Arkema Group

Arkema Group - Overview
Arkema Group - Business segments
Arkema Group - Key news
Arkema Group - Key offerings
Arkema Group - Segment focus
SWOT

15.5 Asahi Kasei Corp.

Asahi Kasei Corp. - Overview
Asahi Kasei Corp. - Business segments
Asahi Kasei Corp. - Key news
Asahi Kasei Corp. - Key offerings
Asahi Kasei Corp. - Segment focus
SWOT

15.6 BASF SE

BASF SE - Overview
BASF SE - Business segments
BASF SE - Key news
BASF SE - Key offerings
BASF SE - Segment focus
SWOT

15.7 Celanese Corp.

Celanese Corp. - Overview
Celanese Corp. - Business segments
Celanese Corp. - Key news
Celanese Corp. - Key offerings
Celanese Corp. - Segment focus
SWOT

15.8 Covestro AG

Covestro AG - Overview
Covestro AG - Business segments
Covestro AG - Key news
Covestro AG - Key offerings
Covestro AG - Segment focus
SWOT

15.9 Dow Chemical Co.

Dow Chemical Co. - Overview
Dow Chemical Co. - Business segments
Dow Chemical Co. - Key news
Dow Chemical Co. - Key offerings
Dow Chemical Co. - Segment focus
SWOT

15.10 DuPont de Nemours Inc.

DuPont de Nemours Inc. - Overview
DuPont de Nemours Inc. - Business segments
DuPont de Nemours Inc. - Key news
DuPont de Nemours Inc. - Key offerings
DuPont de Nemours Inc. - Segment focus
SWOT

15.11 Eastman Chemical Co.

Eastman Chemical Co. - Overview
Eastman Chemical Co. - Business segments
Eastman Chemical Co. - Key news
Eastman Chemical Co. - Key offerings
Eastman Chemical Co. - Segment focus
SWOT

15.12 Evonik Industries AG

Evonik Industries AG - Overview
Evonik Industries AG - Business segments
Evonik Industries AG - Key news
Evonik Industries AG - Key offerings
Evonik Industries AG - Segment focus
SWOT

15.13 Lanxess AG

Lanxess AG - Overview
Lanxess AG - Business segments
Lanxess AG - Key news
Lanxess AG - Key offerings
Lanxess AG - Segment focus
SWOT

15.14 LG Chem Ltd.

LG Chem Ltd. - Overview
LG Chem Ltd. - Business segments
LG Chem Ltd. - Key news
LG Chem Ltd. - Key offerings
LG Chem Ltd. - Segment focus
SWOT

15.15 Mitsubishi Chemical Grp.

Mitsubishi Chemical Grp. - Overview
Mitsubishi Chemical Grp. - Business segments
Mitsubishi Chemical Grp. - Key news
Mitsubishi Chemical Grp. - Key offerings
Mitsubishi Chemical Grp. - Segment focus
SWOT

15.16 Saudi Basic Industries

Saudi Basic Industries - Overview
Saudi Basic Industries - Business segments
Saudi Basic Industries - Key offerings
Saudi Basic Industries - Segment focus
SWOT

15.17 Solvay SA

Solvay SA - Overview
Solvay SA - Business segments
Solvay SA - Key news
Solvay SA - Key offerings
Solvay SA - Segment focus
SWOT

15.18 Toray Industries Inc.

Toray Industries Inc. - Overview
Toray Industries Inc. - Business segments
Toray Industries Inc. - Key news
Toray Industries Inc. - Key offerings
Toray Industries Inc. - Segment focus
SWOT

16. Appendix

16.1 Scope of the report

Market definition
Objectives
Notes and caveats

16.2 Inclusions and exclusions checklist

Inclusions checklist
Exclusions checklist

16.3 Currency conversion rates for US$

16.4 Research methodology

16.5 Data procurement

Information sources

16.6 Data validation

16.7 Validation techniques employed for market sizing

16.8 Data synthesis

16.9 360 degree market analysis

16.10 List of abbreviations

Research Methodology

Technavio presents a detailed picture of the market by way of study, synthesis, and summation of data from multiple sources. The analysts have presented the various facets of the market with a particular focus on identifying the key industry influencers. The data thus presented is comprehensive, reliable, and the result of extensive research, both primary and secondary.

INFORMATION SOURCES

Primary sources

  • Manufacturers and suppliers
  • Channel partners
  • Industry experts
  • Strategic decision makers

Secondary sources

  • Industry journals and periodicals
  • Government data
  • Financial reports of key industry players
  • Historical data
  • Press releases

DATA ANALYSIS

Data Synthesis

  • Collation of data
  • Estimation of key figures
  • Analysis of derived insights

Data Validation

  • Triangulation with data models
  • Reference against proprietary databases
  • Corroboration with industry experts

REPORT WRITING

Qualitative

  • Market drivers
  • Market challenges
  • Market trends
  • Five forces analysis

Quantitative

  • Market size and forecast
  • Market segmentation
  • Geographical insights
  • Competitive landscape

Interested in this report?

Get your sample now to see our research methodology and insights!

Download Now

Frequently Asked Questions

Polar Polymers market growth will increase by USD 22104.8 million during 2026-2030 .

The Polar Polymers market is expected to grow at a CAGR of 7.2% during 2026-2030 .

Polar Polymers market is segmented by Type (Polyamide, Polyurethane, Polyethylene glycol, Polyvinyl alcohol) Application (Films, Coatings, Adhesives, Others) End-user (Electronics, Consumer goods, Automotive, Medical)

Arkema Group, Asahi Kasei Corp., BASF SE, Celanese Corp., Covestro AG, Dow Chemical Co., DuPont de Nemours Inc., Eastman Chemical Co., Evonik Industries AG, Formosa Plastics Corp., Huntsman International LLC, Lanxess AG, LG Chem Ltd., LyondellBasell Industries NV, Mitsubishi Chemical Grp., Saudi Basic Industries, Shin Etsu Chemical Co. Ltd., Solvay SA, Sumitomo Chemical Co. Ltd., Toray Industries Inc. are a few of the key vendors in the Polar Polymers market.

APAC will register the highest growth rate of 49.9% among the other regions. Therefore, the Polar Polymers market in APAC is expected to garner significant business opportunities for the vendors during the forecast period.

China, Japan, India, South Korea, Australia, Indonesia, US, Canada, Mexico, Germany, UK, France, Italy, Spain, The Netherlands, Brazil, Argentina, Colombia, Saudi Arabia, UAE, South Africa, Israel, Turkey

  • Surging adoption of electric vehicles and advanced electronics propelling demand is the driving factor this market.

The Polar Polymers market vendors should focus on grabbing business opportunities from the Type segment as it accounted for the largest market share in the base year.