Pool Tables Market Analysis North America, Europe, APAC, South America, Middle East and Africa - US, China, UK, France, Germany - Size and Forecast 2024-2028

Pool Tables Market Analysis North America, Europe, APAC, South America, Middle East and Africa - US, China, UK, France, Germany - Size and Forecast 2024-2028

Published: Jul 2024 147 Pages SKU: IRTNTR73872

Market Overview at a Glance

$75.6 Mn
Market Opportunity
6.37%
CAGR
5.6
YoY growth 2023-2024(%)

Pool Tables Market Size 2024-2028

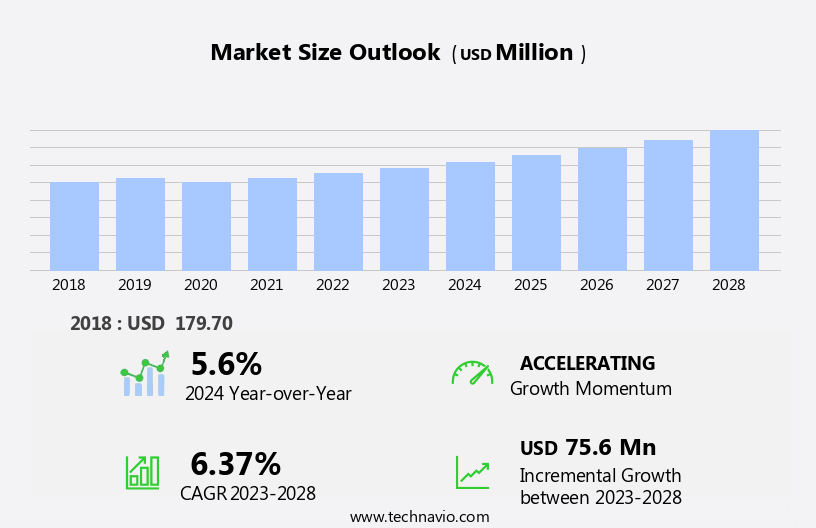
The pool tables market size is forecast to increase by USD 75.6 million, at a CAGR of 6.37% between 2023 and 2028.

  • The market is experiencing significant growth, driven by the increasing popularity of home leisure activities and a rising demand in the Asia Pacific region. This trend is further amplified by the increasing online sales of pool tables through e-commerce, providing consumers with greater accessibility and convenience. However, the market faces challenges in the form of fluctuating raw material prices and transportation costs, which can impact profitability for manufacturers and retailers. Companies seeking to capitalize on market opportunities must stay agile and adapt to these price fluctuations, while also focusing on providing competitive pricing and exceptional customer service to maintain a strong market position.
  • To navigate these challenges effectively, strategic partnerships and collaborations with suppliers and logistics providers can help mitigate risks and ensure a steady supply chain. Additionally, innovation in product design and technology can differentiate offerings and attract price-sensitive consumers. Overall, the market presents a dynamic and promising landscape, with opportunities for growth and innovation amidst the challenges of price volatility.

What will be the Size of the Pool Tables Market during the forecast period?

Pool Tables Market Size

Explore in-depth regional segment analysis with market size data - historical 2018-2022 and forecasts 2024-2028 - in the full report.  
Request Free Sample

The market exhibits a dynamic and evolving landscape, with ongoing innovations and applications across various sectors. Pub tables, once a staple of recreational establishments, have expanded into residential settings, transforming home recreation spaces. Masse shot, jump shot, and follow shot techniques continue to evolve, pushing the boundaries of billiard instruction and performance. Three-cushion billiards, carom billiards, and snooker tables cater to diverse player preferences, while table size and slate thickness vary to accommodate different game styles and commercial venues. Import/export and supply chain management play crucial roles in ensuring timely delivery and quality control. Cue tips, maintenance kits, cleaning products, and protective covers are essential components of billiard care, while cue sticks, bridge heads, and rail height customization cater to professional players.

Game scoring systems, table lights, and direct sales channels streamline tournament play and distribution. Market activities unfold continuously, with safety features, pocket size, and table weight influencing design and manufacturing. Rubber bumpers, bank shot, and billiard balls undergo constant refinement, reflecting the industry's commitment to innovation. Repair services, installation services, and maintenance tools address the needs of commercial venues and game rooms. Online sales and retail sales channels cater to diverse customer preferences, ensuring accessibility and convenience. Cue cases and distribution channels further expand market reach, as the market continues to evolve.

How is this Pool Tables Industry segmented?

The pool tables industry research report provides comprehensive data (region-wise segment analysis), with forecasts and estimates in "USD million" for the period 2024-2028, as well as historical data from 2018-2022 for the following segments.

  • Type
    • American pool table
    • British pool table
  • Material
    • Slate pool table
    • Wooden pool table
    • Metallic pool table
    • Rubber pool table
  • Geography
    • North America
      • US
    • Europe
      • France
      • Germany
      • UK
    • APAC
      • China
    • Rest of World (ROW)

By Type Insights

The american pool table segment is estimated to witness significant growth during the forecast period.

The American pool table market is experiencing notable growth in the global pool table industry, primarily due to the increasing popularity of pool halls, sports clubs, and recreational centers. The standard sizes of American pool tables, which include 7 ft, 8 ft, and 9 ft models, cater to both amateur and professional players. In official tournament play, larger 9-ft tables are utilized for an optimal experience while playing snooker. The trend toward customization is driving market expansion, with manufacturers offering custom designs to broaden their customer base and boost sales. Moreover, the integration of coin mechanisms and game scoring systems in pool tables has attracted more players to recreational venues.

The availability of various cleaning products and maintenance tools ensures that pool tables remain in top condition. The import/export sector plays a crucial role in the supply chain management of pool tables, with various distribution channels catering to both residential and commercial markets. Professional players and billiard clubs have a significant impact on the market, with many investing in high-quality cue sticks, cue tips, and maintenance kits. Commercial venues, such as pubs and bars, offer pool tables for home recreation, while game rooms and game scoring systems cater to the growing demand for immersive and harmonious gaming experiences.

Safety features, such as protective covers and rubber bumpers, are essential considerations for manufacturers and consumers alike. The market also includes various accessories, such as table lights, masse shots, jump shots, and follow shots, which add to the overall gaming experience. Online sales and retail sales channels offer convenience and accessibility to consumers, while repair services and installation services ensure the longevity of pool tables. The market for pool tables is diverse, with various entities, including manufacturers, distributors, retailers, and consumers, contributing to its growth. The market is expected to continue evolving, with innovations in table construction, billiard instruction, and technology enhancing the overall pool table experience.

Pool Tables Market Size

Request Free Sample

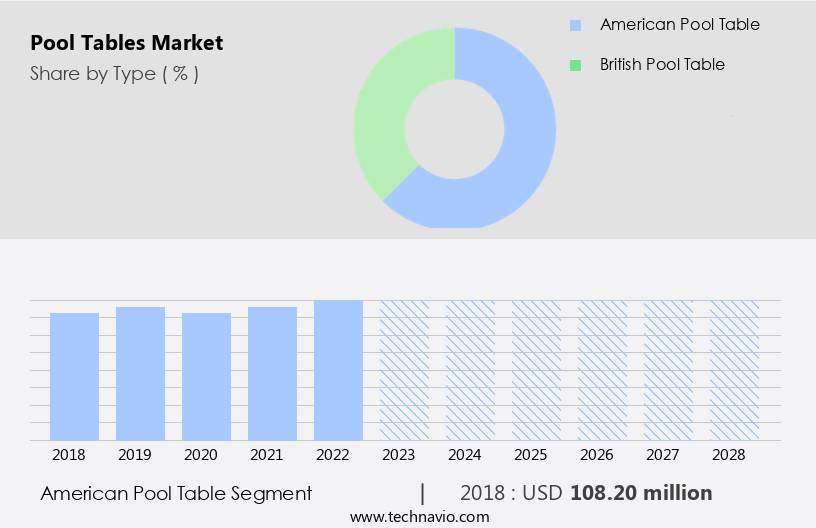
The American pool table segment was valued at USD 108.20 million in 2018 and showed a gradual increase during the forecast period.

Regional Analysis

North America is estimated to contribute 35% to the growth of the global market during the forecast period. Technavio's analysts have elaborately explained the regional trends and drivers that shape the market during the forecast period.

Pool Tables Market Share by Geography

 Request Free Sample

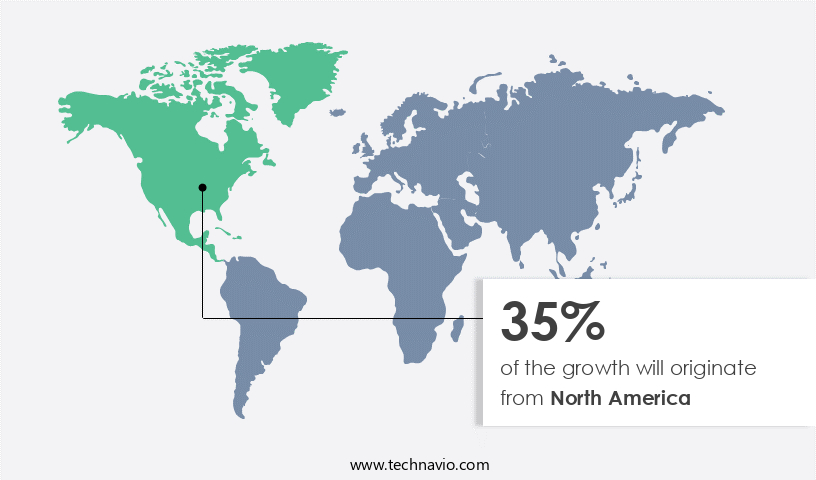
The market experienced significant growth in North America in 2023, with the United States and Canada being the primary contributors to revenue. The region's strong affinity for cue sports and recreational activities, coupled with the support of governing bodies like the USBA, fueled this growth. The demand for billiard and snooker games is anticipated to continue increasing, leading to a boost in pool table sales. Amateur and professional players alike enjoy various pool games such as straight pool, three-cushion billiards, and carom billiards. Table construction varies, with slate thickness and rail height influencing performance. Cue chalk and tips are essential accessories, while maintenance tools and protective covers ensure table longevity.

Commercial venues, including recreation centers, bars, and billiard clubs, contribute significantly to the market. Direct sales, retail sales, and online sales cater to various customer preferences. Import/export and supply chain management are crucial aspects of the industry. Safety features, such as rubber bumpers and pocket size, are essential considerations. Tournament play and game scoring systems add to the market's appeal. Table lights and coin mechanisms enhance the user experience. Maintenance kits and cleaning products ensure tables remain in top condition. The market also includes various table sizes and types, including residential pool tables, bar tables, and commercial pool tables.

Repair services address any issues, while wood finishes and installation services cater to customization preferences. Game rooms and home recreation spaces continue to be popular applications for pool tables.

Market Dynamics

Our researchers analyzed the data with 2023 as the base year, along with the key drivers, trends, and challenges. A holistic analysis of drivers will help companies refine their marketing strategies to gain a competitive advantage.

What are the key market drivers leading to the rise in the adoption of Pool Tables Industry?

  • The surging demand from the Asia-Pacific region serves as the primary catalyst for market growth. 
  • The market in Asia Pacific (APAC) is experiencing significant growth due to the rising popularity of pool and snooker in major markets, including China, Hong Kong, Taiwan, and India. The large population base and favorable economic conditions are key drivers for this growth. Companies catering to the pool table market in developing economies of APAC, such as China, Taiwan, Hong Kong, and India, are anticipated to witness increased demand. Favorable environmental regulations and low labor and manufacturing costs are attracting manufacturers to establish or expand their production facilities in APAC. Amateur and professional players alike are drawn to the game's immersive and harmonious nature.
  • Table construction, with its emphasis on precision and durability, is a crucial factor in the market. Slate thickness, a critical aspect of table construction, ensures accurate ball roll and shot execution. Cue chalk and bridge heads are essential accessories for players, while cleaning products maintain the tables' condition. Coin mechanisms add a recreational element to the tables, making them a popular choice for residential use. Increasingly, pool tables are finding their place in recreation centers and professional tournaments, with straight pool and other variations gaining popularity. The market's growth is further fueled by the increasing number of tournaments and events, providing opportunities for players to showcase their skills.
  • Despite these favorable conditions, it is essential for companies to maintain the highest quality standards and offer competitive pricing to meet the growing demand.

What are the market trends shaping the Pool Tables Industry?

  • The market trend indicates a significant increase in online sales of pool tables. As a professional and knowledgeable virtual assistant, I can help you capitalize on this trend by providing expert advice on how to effectively market and sell pool tables online.
  • Pool tables have gained significant popularity in both home recreation and pub settings. The market for pool tables is dynamic, with companies selling their products through various channels to expand their customer base. Online sales have become a preferred option due to the convenience and wide range of options available to consumers. Leading manufacturers and smaller brands sell pool tables on e-commerce websites such as Shopify Inc., Amazon.Com, Inc., and Flipkart Internet Pvt Ltd. The demand for pool tables is driven by various factors, including the increasing popularity of billiard games like masse shot, jump shot, three-cushion billiards, follow shot, and snooker.
  • Billiard instruction and the establishment of billiard clubs have also contributed to the growth of the market. The import/export market plays a crucial role in the supply chain management of pool tables, ensuring the availability of high-quality products for consumers. Cue tips are an essential accessory for pool tables, and companies offer various types to cater to different preferences. Effective supply chain management and efficient import/export processes are crucial to ensure the timely delivery of cue tips and other accessories. The market is expected to continue growing, with consumers showing a preference for immersive and harmonious gaming experiences.

What challenges does the Pool Tables Industry face during its growth?

  • The volatility in raw material prices and transportation costs poses a significant challenge to the industry's growth trajectory. 
  • Pool tables continue to be a popular addition to game rooms and commercial venues. Companies provide a diverse selection, ranging from economical models made with synthetic slates or plastic honeycomb sheets to premium tables featuring authentic Italian, French, or Brazilian slate sheets. The choice of raw materials impacts the price, with the cost of high-quality slate sheets increasing due to global supply-demand imbalances and transportation expenses. Pool table accessories, such as cue sticks, maintenance kits, bar tables, game scoring systems, carom billiards, table lights, and various maintenance tools, are also in demand. Direct sales and installation services are offered by companies to cater to the needs of individual consumers and commercial clients.
  • Repair services are essential to maintain the longevity and functionality of these tables. Wood finishes are popular choices for those seeking a classic and elegant look. In the pool table market, companies focus on providing immersive and harmonious gaming experiences. Recent research indicates a growing interest in pool tables as a form of entertainment and relaxation. Maintenance kits and tools are essential for keeping these tables in top condition. Table lights enhance the ambiance and create an inviting atmosphere for players. Overall, the pool table market is driven by the increasing popularity of game rooms and the desire for high-quality, authentic gaming experiences.
  • Companies must navigate the challenges of raw material availability and transportation costs to meet the demands of consumers and commercial clients.

Exclusive Customer Landscape

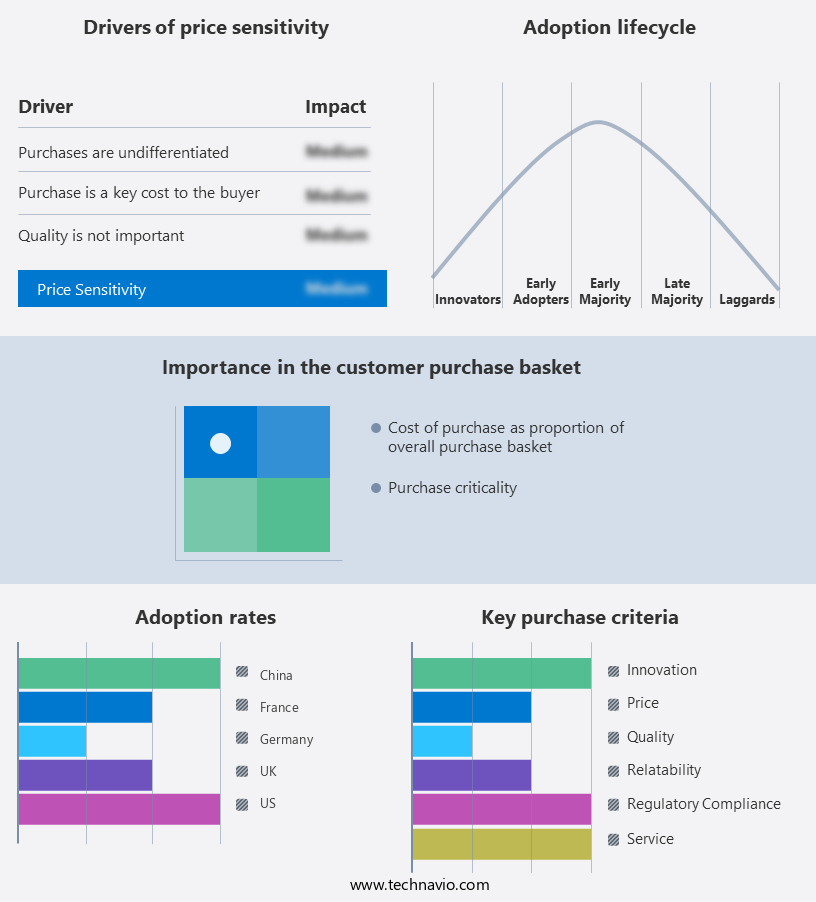
The pool tables market forecasting report includes the adoption lifecycle of the market, covering from the innovator's stage to the laggard's stage. It focuses on adoption rates in different regions based on penetration. Furthermore, the pool tables market report also includes key purchase criteria and drivers of price sensitivity to help companies evaluate and develop their market growth analysis strategies.

Pool Tables Market Share by Geography

 Customer Landscape

Key Companies & Market Insights

Companies are implementing various strategies, such as strategic alliances, pool tables market forecast, partnerships, mergers and acquisitions, geographical expansion, and product/service launches, to enhance their presence in the industry.

Alibaba Group Holding Ltd. - This company specializes in the production and distribution of unique pool table models, including the Williamsburg Bumper Pool, Transitional Bumper Pool, and Tokyo Game Table. 

The industry research and growth report includes detailed analyses of the competitive landscape of the market and information about key companies, including:

  • Alibaba Group Holding Ltd.
  • BCE Distributors Ltd.
  • Blatt Billiards
  • Brunswick Billiards
  • CHEVILLOTTE
  • Connelly Billiards Tucson
  • Diamond Billiard Products INC.
  • EastPoint Sports Ltd. LLC
  • Escalade Sports Inc.
  • GDM Sports
  • Gold Standard Games
  • H. Betti Industries Inc.
  • Legacy Billiards
  • Olhausen Billiard Mfg. Inc.
  • Plank and Hide Co.
  • Presidential Billiards
  • Rene Pierre SA
  • Sharma Billiard Accessories
  • Tanishq Billiards
  • Valley Dynamo Inc.

Qualitative and quantitative analysis of companies has been conducted to help clients understand the wider business environment as well as the strengths and weaknesses of key industry players. Data is qualitatively analyzed to categorize companies as pure play, category-focused, industry-focused, and diversified; it is quantitatively analyzed to categorize companies as dominant, leading, strong, tentative, and weak.

Recent Development and News in Pool Tables Market

  • In January 2024, Brunswick Corporation, a leading manufacturer in the billiards industry, announced the launch of its new high-end pool table line, "Brunswick Centennial," featuring advanced ball return systems and customizable designs (Brunswick Corporation Press Release).
  • In March 2024, American Heritage Billiards, a leading pool table retailer, formed a strategic partnership with PoolTabledeals, an online marketplace for refurbished pool tables, to expand their product offerings and reach a broader customer base (American Heritage Billiards Press Release).
  • In May 2024, Italian billiards equipment manufacturer, Campezzano, completed a € 5 million investment round, led by private equity firm, Investindustrial, to expand its production capacity and global market presence (Reuters).
  • In April 2025, the European Union introduced new regulations on the production and sale of pool tables, requiring all new tables to meet strict safety and environmental standards, effective from January 2026 (European Commission Press Release).

Research Analyst Overview

  • The market experiences dynamic shifts as material sourcing and supply chain optimization play crucial roles in ensuring product differentiation and customer loyalty. Brands invest heavily in brand awareness and public relations to distinguish themselves, while influencer marketing and marketing strategies cater to consumer preferences. Warranty claims and technology adoption impact customer service and user experience, shaping the market trend. Social media marketing and digital marketing channels facilitate trend analysis and competitor analysis. Online reviews and customer reviews influence purchasing decisions, affecting return rates and price strategy. Precision engineering and virtual reality simulation enhance the product lifecycle management and sales promotion.
  • App integration, digital displays, and custom designs cater to evolving consumer demands. High-end materials, repair frequency, and environmental impact are critical factors in the market's sustainability. Manufacturing technology and product lifecycle management strategies ensure quality control and automated scoring systems meet customer expectations. Distribution networks and specialty fabrics contribute to the market's growth, with ongoing innovation in technology and design aesthetics driving competition.

Dive into Technavio's robust research methodology, blending expert interviews, extensive data synthesis, and validated models for unparalleled Pool Tables Market insights. See full methodology.

Market Scope

Report Coverage

Details

Page number

147

Base year

2023

Historic period

2018-2022

Forecast period

2024-2028

Growth momentum & CAGR

Accelerate at a CAGR of 6.37%

Market growth 2024-2028

USD 75.6 million

Market structure

Fragmented

YoY growth 2023-2024(%)

5.6

Key countries

US, China, UK, France, and Germany

Competitive landscape

Leading Companies, Market Positioning of Companies, Competitive Strategies, and Industry Risks

Request Free Sample

What are the Key Data Covered in this Pool Tables Market Research and Growth Report?

  • CAGR of the Pool Tables industry during the forecast period
  • Detailed information on factors that will drive the growth and forecasting between 2024 and 2028
  • Precise estimation of the size of the market and its contribution of the industry in focus to the parent market
  • Accurate predictions about upcoming growth and trends and changes in consumer behaviour
  • Growth of the market across North America, Europe, APAC, South America, and Middle East and Africa
  • Thorough analysis of the market's competitive landscape and detailed information about companies
  • Comprehensive analysis of factors that will challenge the pool tables market growth of industry companies

We can help! Our analysts can customize this pool tables market research report to meet your requirements.

Get in touch

1 Executive Summary

  • 1.1 Market overview
    • Executive Summary - Chart on Market Overview
    • Executive Summary - Data Table on Market Overview
    • Executive Summary - Chart on Global Market Characteristics
    • Executive Summary - Chart on Market by Geography
    • Executive Summary - Chart on Market Segmentation by Type
    • Executive Summary - Chart on Market Segmentation by Material
    • Executive Summary - Chart on Incremental Growth
    • Executive Summary - Data Table on Incremental Growth
    • Executive Summary - Chart on Company Market Positioning

2 Market Landscape

  • 2.1 Market ecosystem
    • Parent Market
    • Data Table on - Parent Market
  • 2.2 Market characteristics
    • Market characteristics analysis
  • 2.3 Value chain analysis
    • Value Chain Analysis

3 Market Sizing

  • 3.1 Market definition
    • Offerings of companies included in the market definition
  • 3.2 Market segment analysis
    • Market segments
  • 3.3 Market size 2023
    • 3.4 Market outlook: Forecast for 2023-2028
      • Chart on Global - Market size and forecast 2023-2028 ($ million)
      • Data Table on Global - Market size and forecast 2023-2028 ($ million)
      • Chart on Global Market: Year-over-year growth 2023-2028 (%)
      • Data Table on Global Market: Year-over-year growth 2023-2028 (%)

    4 Historic Market Size

    • 4.1 Global Pool Tables Market 2018 - 2022
      • Historic Market Size - Data Table on Global Pool Tables Market 2018 - 2022 ($ million)
    • 4.2 Type segment analysis 2018 - 2022
      • Historic Market Size - Type Segment 2018 - 2022 ($ million)
    • 4.3 Material segment analysis 2018 - 2022
      • Historic Market Size - Material Segment 2018 - 2022 ($ million)
    • 4.4 Geography segment analysis 2018 - 2022
      • Historic Market Size - Geography Segment 2018 - 2022 ($ million)
    • 4.5 Country segment analysis 2018 - 2022
      • Historic Market Size - Country Segment 2018 - 2022 ($ million)

    5 Five Forces Analysis

    • 5.1 Five forces summary
      • Five forces analysis - Comparison between 2023 and 2028
    • 5.2 Bargaining power of buyers
      • Bargaining power of buyers - Impact of key factors 2023 and 2028
    • 5.3 Bargaining power of suppliers
      • Bargaining power of suppliers - Impact of key factors in 2023 and 2028
    • 5.4 Threat of new entrants
      • Threat of new entrants - Impact of key factors in 2023 and 2028
    • 5.5 Threat of substitutes
      • Threat of substitutes - Impact of key factors in 2023 and 2028
    • 5.6 Threat of rivalry
      • Threat of rivalry - Impact of key factors in 2023 and 2028
    • 5.7 Market condition
      • Chart on Market condition - Five forces 2023 and 2028

    6 Market Segmentation by Type

    • 6.1 Market segments
      • Chart on Type - Market share 2023-2028 (%)
      • Data Table on Type - Market share 2023-2028 (%)
    • 6.2 Comparison by Type
      • Chart on Comparison by Type
      • Data Table on Comparison by Type
    • 6.3 American pool table - Market size and forecast 2023-2028
      • Chart on American pool table - Market size and forecast 2023-2028 ($ million)
      • Data Table on American pool table - Market size and forecast 2023-2028 ($ million)
      • Chart on American pool table - Year-over-year growth 2023-2028 (%)
      • Data Table on American pool table - Year-over-year growth 2023-2028 (%)
    • 6.4 British pool table - Market size and forecast 2023-2028
      • Chart on British pool table - Market size and forecast 2023-2028 ($ million)
      • Data Table on British pool table - Market size and forecast 2023-2028 ($ million)
      • Chart on British pool table - Year-over-year growth 2023-2028 (%)
      • Data Table on British pool table - Year-over-year growth 2023-2028 (%)
    • 6.5 Market opportunity by Type
      • Market opportunity by Type ($ million)
      • Data Table on Market opportunity by Type ($ million)

    7 Market Segmentation by Material

    • 7.1 Market segments
      • Chart on Material - Market share 2023-2028 (%)
      • Data Table on Material - Market share 2023-2028 (%)
    • 7.2 Comparison by Material
      • Chart on Comparison by Material
      • Data Table on Comparison by Material
    • 7.3 Slate pool table - Market size and forecast 2023-2028
      • Chart on Slate pool table - Market size and forecast 2023-2028 ($ million)
      • Data Table on Slate pool table - Market size and forecast 2023-2028 ($ million)
      • Chart on Slate pool table - Year-over-year growth 2023-2028 (%)
      • Data Table on Slate pool table - Year-over-year growth 2023-2028 (%)
    • 7.4 Wooden pool table - Market size and forecast 2023-2028
      • Chart on Wooden pool table - Market size and forecast 2023-2028 ($ million)
      • Data Table on Wooden pool table - Market size and forecast 2023-2028 ($ million)
      • Chart on Wooden pool table - Year-over-year growth 2023-2028 (%)
      • Data Table on Wooden pool table - Year-over-year growth 2023-2028 (%)
    • 7.5 Metallic pool table - Market size and forecast 2023-2028
      • Chart on Metallic pool table - Market size and forecast 2023-2028 ($ million)
      • Data Table on Metallic pool table - Market size and forecast 2023-2028 ($ million)
      • Chart on Metallic pool table - Year-over-year growth 2023-2028 (%)
      • Data Table on Metallic pool table - Year-over-year growth 2023-2028 (%)
    • 7.6 Rubber pool table - Market size and forecast 2023-2028
      • Chart on Rubber pool table - Market size and forecast 2023-2028 ($ million)
      • Data Table on Rubber pool table - Market size and forecast 2023-2028 ($ million)
      • Chart on Rubber pool table - Year-over-year growth 2023-2028 (%)
      • Data Table on Rubber pool table - Year-over-year growth 2023-2028 (%)
    • 7.7 Market opportunity by Material
      • Market opportunity by Material ($ million)
      • Data Table on Market opportunity by Material ($ million)

    8 Customer Landscape

    • 8.1 Customer landscape overview
      • Analysis of price sensitivity, lifecycle, customer purchase basket, adoption rates, and purchase criteria

    9 Geographic Landscape

    • 9.1 Geographic segmentation
      • Chart on Market share by geography 2023-2028 (%)
      • Data Table on Market share by geography 2023-2028 (%)
    • 9.2 Geographic comparison
      • Chart on Geographic comparison
      • Data Table on Geographic comparison
    • 9.3 North America - Market size and forecast 2023-2028
      • Chart on North America - Market size and forecast 2023-2028 ($ million)
      • Data Table on North America - Market size and forecast 2023-2028 ($ million)
      • Chart on North America - Year-over-year growth 2023-2028 (%)
      • Data Table on North America - Year-over-year growth 2023-2028 (%)
    • 9.4 Europe - Market size and forecast 2023-2028
      • Chart on Europe - Market size and forecast 2023-2028 ($ million)
      • Data Table on Europe - Market size and forecast 2023-2028 ($ million)
      • Chart on Europe - Year-over-year growth 2023-2028 (%)
      • Data Table on Europe - Year-over-year growth 2023-2028 (%)
    • 9.5 APAC - Market size and forecast 2023-2028
      • Chart on APAC - Market size and forecast 2023-2028 ($ million)
      • Data Table on APAC - Market size and forecast 2023-2028 ($ million)
      • Chart on APAC - Year-over-year growth 2023-2028 (%)
      • Data Table on APAC - Year-over-year growth 2023-2028 (%)
    • 9.6 South America - Market size and forecast 2023-2028
      • Chart on South America - Market size and forecast 2023-2028 ($ million)
      • Data Table on South America - Market size and forecast 2023-2028 ($ million)
      • Chart on South America - Year-over-year growth 2023-2028 (%)
      • Data Table on South America - Year-over-year growth 2023-2028 (%)
    • 9.7 Middle East and Africa - Market size and forecast 2023-2028
      • Chart on Middle East and Africa - Market size and forecast 2023-2028 ($ million)
      • Data Table on Middle East and Africa - Market size and forecast 2023-2028 ($ million)
      • Chart on Middle East and Africa - Year-over-year growth 2023-2028 (%)
      • Data Table on Middle East and Africa - Year-over-year growth 2023-2028 (%)
    • 9.8 US - Market size and forecast 2023-2028
      • Chart on US - Market size and forecast 2023-2028 ($ million)
      • Data Table on US - Market size and forecast 2023-2028 ($ million)
      • Chart on US - Year-over-year growth 2023-2028 (%)
      • Data Table on US - Year-over-year growth 2023-2028 (%)
    • 9.9 China - Market size and forecast 2023-2028
      • Chart on China - Market size and forecast 2023-2028 ($ million)
      • Data Table on China - Market size and forecast 2023-2028 ($ million)
      • Chart on China - Year-over-year growth 2023-2028 (%)
      • Data Table on China - Year-over-year growth 2023-2028 (%)
    • 9.10 UK - Market size and forecast 2023-2028
      • Chart on UK - Market size and forecast 2023-2028 ($ million)
      • Data Table on UK - Market size and forecast 2023-2028 ($ million)
      • Chart on UK - Year-over-year growth 2023-2028 (%)
      • Data Table on UK - Year-over-year growth 2023-2028 (%)
    • 9.11 France - Market size and forecast 2023-2028
      • Chart on France - Market size and forecast 2023-2028 ($ million)
      • Data Table on France - Market size and forecast 2023-2028 ($ million)
      • Chart on France - Year-over-year growth 2023-2028 (%)
      • Data Table on France - Year-over-year growth 2023-2028 (%)
    • 9.12 Germany - Market size and forecast 2023-2028
      • Chart on Germany - Market size and forecast 2023-2028 ($ million)
      • Data Table on Germany - Market size and forecast 2023-2028 ($ million)
      • Chart on Germany - Year-over-year growth 2023-2028 (%)
      • Data Table on Germany - Year-over-year growth 2023-2028 (%)
    • 9.13 Market opportunity by geography
      • Market opportunity by geography ($ million)
      • Data Tables on Market opportunity by geography ($ million)

    10 Drivers, Challenges, and Opportunity/Restraints

    • 10.1 Market drivers
      • 10.2 Market challenges
        • 10.3 Impact of drivers and challenges
          • Impact of drivers and challenges in 2023 and 2028
        • 10.4 Market opportunities/restraints

          11 Competitive Landscape

          • 11.1 Overview
            • 11.2 Competitive Landscape
              • Overview on criticality of inputs and factors of differentiation
            • 11.3 Landscape disruption
              • Overview on factors of disruption
            • 11.4 Industry risks
              • Impact of key risks on business

            12 Competitive Analysis

            • 12.1 Companies profiled
              • Companies covered
            • 12.2 Market positioning of companies
              • Matrix on companies position and classification
            • 12.3 Alibaba Group Holding Ltd.
              • Alibaba Group Holding Ltd. - Overview
              • Alibaba Group Holding Ltd. - Business segments
              • Alibaba Group Holding Ltd. - Key news
              • Alibaba Group Holding Ltd. - Key offerings
              • Alibaba Group Holding Ltd. - Segment focus
            • 12.4 BCE Distributors Ltd.
              • BCE Distributors Ltd. - Overview
              • BCE Distributors Ltd. - Product / Service
              • BCE Distributors Ltd. - Key offerings
            • 12.5 Blatt Billiards
              • Blatt Billiards - Overview
              • Blatt Billiards - Product / Service
              • Blatt Billiards - Key offerings
            • 12.6 Brunswick Billiards
              • Brunswick Billiards - Overview
              • Brunswick Billiards - Product / Service
              • Brunswick Billiards - Key offerings
            • 12.7 Escalade Sports Inc.
              • Escalade Sports Inc. - Overview
              • Escalade Sports Inc. - Product / Service
              • Escalade Sports Inc. - Key offerings
            • 12.8 GDM Sports
              • GDM Sports - Overview
              • GDM Sports - Product / Service
              • GDM Sports - Key offerings
            • 12.9 H. Betti Industries Inc.
              • H. Betti Industries Inc. - Overview
              • H. Betti Industries Inc. - Product / Service
              • H. Betti Industries Inc. - Key offerings
            • 12.10 Legacy Billiards
              • Legacy Billiards - Overview
              • Legacy Billiards - Product / Service
              • Legacy Billiards - Key offerings
            • 12.11 Olhausen Billiard Mfg. Inc.
              • Olhausen Billiard Mfg. Inc. - Overview
              • Olhausen Billiard Mfg. Inc. - Product / Service
              • Olhausen Billiard Mfg. Inc. - Key offerings
            • 12.12 Valley Dynamo Inc.
              • Valley Dynamo Inc. - Overview
              • Valley Dynamo Inc. - Product / Service
              • Valley Dynamo Inc. - Key offerings

            13 Appendix

            • 13.1 Scope of the report
              • 13.2 Inclusions and exclusions checklist
                • Inclusions checklist
                • Exclusions checklist
              • 13.3 Currency conversion rates for US$
                • Currency conversion rates for US$
              • 13.4 Research methodology
                • Research methodology
              • 13.5 Data procurement
                • Information sources
              • 13.6 Data validation
                • Data validation
              • 13.7 Validation techniques employed for market sizing
                • Validation techniques employed for market sizing
              • 13.8 Data synthesis
                • Data synthesis
              • 13.9 360 degree market analysis
                • 360 degree market analysis
              • 13.10 List of abbreviations
                • List of abbreviations

              Research Methodology

              Technavio presents a detailed picture of the market by way of study, synthesis, and summation of data from multiple sources. The analysts have presented the various facets of the market with a particular focus on identifying the key industry influencers. The data thus presented is comprehensive, reliable, and the result of extensive research, both primary and secondary.

              INFORMATION SOURCES

              Primary sources

              • Manufacturers and suppliers
              • Channel partners
              • Industry experts
              • Strategic decision makers

              Secondary sources

              • Industry journals and periodicals
              • Government data
              • Financial reports of key industry players
              • Historical data
              • Press releases

              DATA ANALYSIS

              Data Synthesis

              • Collation of data
              • Estimation of key figures
              • Analysis of derived insights

              Data Validation

              • Triangulation with data models
              • Reference against proprietary databases
              • Corroboration with industry experts

              REPORT WRITING

              Qualitative

              • Market drivers
              • Market challenges
              • Market trends
              • Five forces analysis

              Quantitative

              • Market size and forecast
              • Market segmentation
              • Geographical insights
              • Competitive landscape

              Interested in this report?

              Get your sample now to see our research methodology and insights!

              Download Now

              Frequently Asked Questions

              Pool Tables market growth will increase by $ 75.6 mn during 2024-2028.

              The Pool Tables market is expected to grow at a CAGR of 6.37% during 2024-2028.

              Pool Tables market is segmented by Type( American pool table, British pool table) Material( Slate pool table, Wooden pool table, Metallic pool table, Rubber pool table)

              Alibaba Group Holding Ltd., BCE Distributors Ltd., Blatt Billiards, Brunswick Billiards, CHEVILLOTTE, Connelly Billiards Tucson, Diamond Billiard Products INC., EastPoint Sports Ltd. LLC, Escalade Sports Inc., GDM Sports, Gold Standard Games, H. Betti Industries Inc., Legacy Billiards, Olhausen Billiard Mfg. Inc., Plank and Hide Co., Presidential Billiards, Rene Pierre SA, Sharma Billiard Accessories, Tanishq Billiards, Valley Dynamo Inc. are a few of the key vendors in the Pool Tables market.

              North America will register the highest growth rate of 35% among the other regions. Therefore, the Pool Tables market in North America is expected to garner significant business opportunities for the vendors during the forecast period.

              US, China, UK, France, Germany

              • Rising demand from APACThe pool tables market in APAC is witnessing a strong growth rate owing to the increasing popularity of the sport in major markets is the driving factor this market.
              • such as China is the driving factor this market.
              • Hong Kong is the driving factor this market.
              • Taiwan is the driving factor this market.
              • and India. The large population is the driving factor this market.
              • increasing popularity of snooker is the driving factor this market.
              • and strong economic conditions are driving the pool tables market in the region. Vendors that offer pool tables in the developing economies of APAC is the driving factor this market.
              • such as China is the driving factor this market.
              • Taiwan is the driving factor this market.
              • Hing Kong is the driving factor this market.
              • and India is the driving factor this market.
              • are expected to witness a further increase in demand during the forecast period. Flexible environmental regulations and low labor and manufacturing costs are attracting several manufacturers to switch their production facilities or expand their production capabilities in APAC. With the growing urbanization and rising number of high-net-worth individuals (HNWIs) is the driving factor this market.
              • snooker is gaining popularity in APAC. Major markets for pool tables in APAC are China is the driving factor this market.
              • Taiwan is the driving factor this market.
              • Hing Kong is the driving factor this market.
              • India is the driving factor this market.
              • the Philippines is the driving factor this market.
              • Australia is the driving factor this market.
              • South Korea is the driving factor this market.
              • and Thailand. Snooker is one of the most-viewed sports in China is the driving factor this market.
              • and it is estimated that snooker is played by more than 60 million people in China. Also is the driving factor this market.
              • there are more than 1 is the driving factor this market.
              • 500 snooker clubs in Shanghai is the driving factor this market.
              • and the number is expected to increase during the forecast period. The demand for pool tables is also expected to increase due to initiatives such as the introduction of cue zones in Chinese schools is the driving factor this market.
              • which will increase the interest of students in snooker during the forecast period.  In APAC is the driving factor this market.
              • popular sports tournaments is the driving factor this market.
              • such as the Asian Snooker Championship and Asian Billiards Championship is the driving factor this market.
              • help to drive the regional pool tables market during the forecast period. The market in APAC is also driven by the increasing number of retail stores offering pool tables in developing markets such as India. For instance is the driving factor this market.
              • Decathlon SA is the driving factor this market.
              • a leading French sporting goods retailer is the driving factor this market.
              • operates over 70 stores in India. All these factors are expected to drive the growth of the regional pool tables market during the forecast period. is the driving factor this market.

              The Pool Tables market vendors should focus on grabbing business opportunities from the American pool table segment as it accounted for the largest market share in the base year.