Pubs, Bars And Nightclubs Market Size 2026-2030
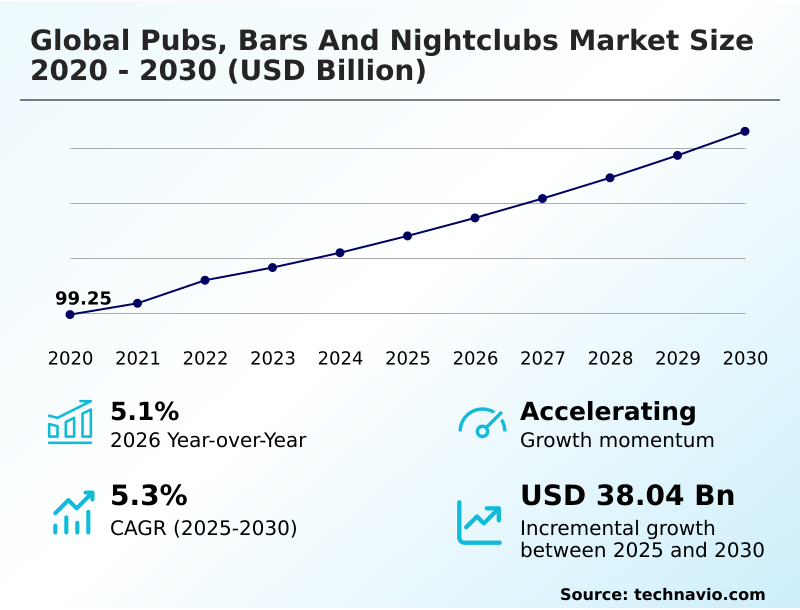
The pubs, bars and nightclubs market size is valued to increase by USD 38.04 billion, at a CAGR of 5.3% from 2025 to 2030. Sustained growth in global disposable income and consumer expenditure on leisure will drive the pubs, bars and nightclubs market.
Major Market Trends & Insights
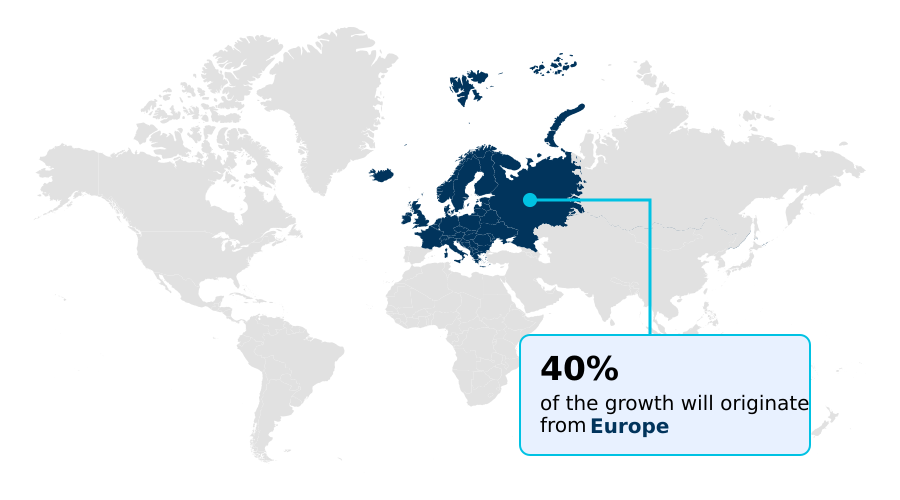
- Europe dominated the market and accounted for a 39.7% growth during the forecast period.
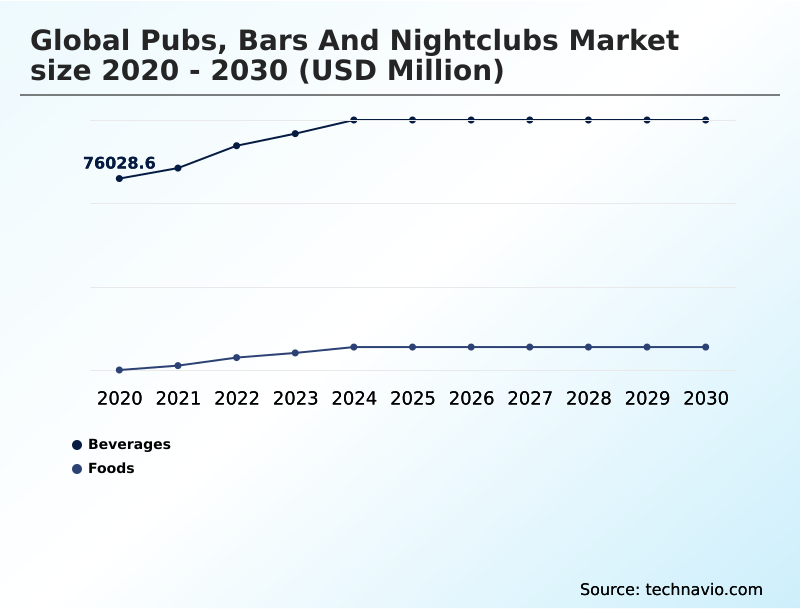
- By Product - Beverages segment was valued at USD 92.18 billion in 2024
- By Application - Men segment accounted for the largest market revenue share in 2024
Market Size & Forecast
- Market Opportunities: USD 66.64 billion
- Market Future Opportunities: USD 38.04 billion
- CAGR from 2025 to 2030 : 5.3%
Market Summary
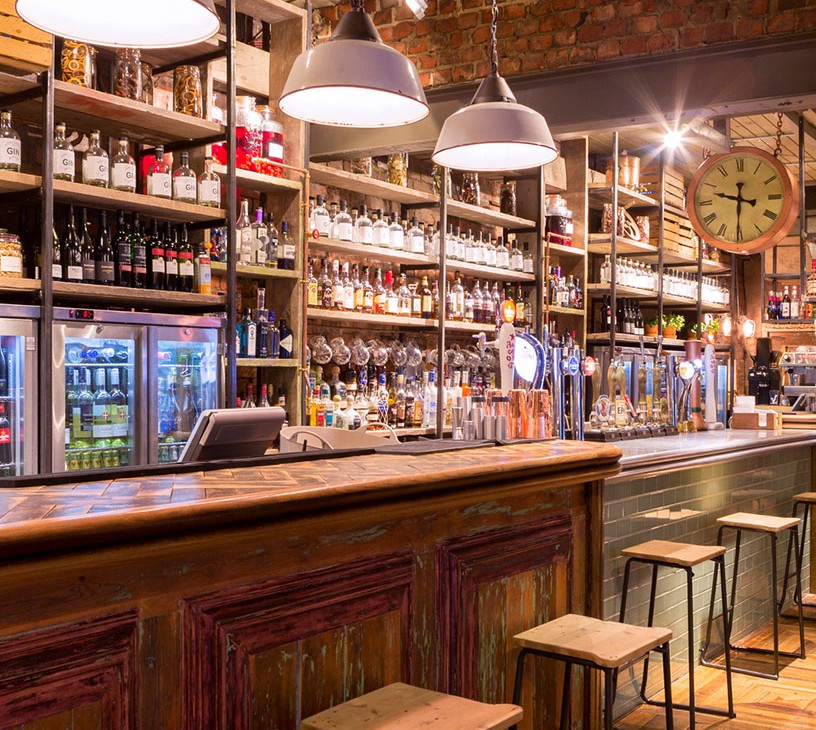
- The pubs, bars and nightclubs market is undergoing a significant transformation, driven by evolving consumer expectations for experiential entertainment concepts. Beyond simple on-premise beverage consumption, patrons now seek memorable social outings, fueling the trend toward the premiumization of beverages and curated craft beverage programs.
- This shift necessitates that operators create a distinct venue ambiance design and consider offerings like live music programming to differentiate. A key business scenario involves an independent operator leveraging independent operator agility to pivot their establishment into a gastropub business model.
- This requires not only a revised food and beverage menu featuring artisanal spirit offerings but also investment in high-end mixology services to attract a more discerning clientele. Success in this competitive landscape depends on balancing traditional hospitality with innovative concepts such as themed night events and interactive game integration, all while managing complex supply chain logistics.
- This operator must also implement robust inventory management software to track high-value stock and utilize social media engagement analytics to refine marketing efforts. The challenge is to fund this transformation while ensuring beverage cost control and labor optimization.
What will be the Size of the Pubs, Bars And Nightclubs Market during the forecast period?
Get Key Insights on Market Forecast (PDF) Get Free Sample
How is the Pubs, Bars And Nightclubs Market Segmented?
The pubs, bars and nightclubs industry research report provides comprehensive data (region-wise segment analysis), with forecasts and estimates in "USD million" for the period 2026-2030, as well as historical data from 2020-2024 for the following segments.
- Product
- Beverages
- Foods
- Application
- Men
- Women
- Ownership
- Independent
- Chain
- Franchise
- Geography
- Europe
- UK
- Germany
- France
- APAC
- China
- Japan
- India
- North America
- US
- Canada
- Mexico
- Middle East and Africa
- UAE
- Saudi Arabia
- South Africa
- South America
- Brazil
- Argentina
- Rest of World (ROW)
- Europe
By Product Insights
The beverages segment is estimated to witness significant growth during the forecast period.
The beverage segment is the cornerstone of on-premise social experiences, with its strategic management central to brand identity curation and overall venue differentiation tactics.
The widespread premiumization of beverages, from artisanal spirit offerings to the rapidly expanding NOLO beverage category, provides a strong experiential value proposition.
Establishments are leveraging zero-proof cocktail menus to cater to new demographics, achieving premium product margins that are up to 22% higher than traditional soft drinks.
The food segment, particularly within a gastropub business model, complements on-premise beverage consumption, extending customer dwell time. Integrating late-night food service is another key strategy, leveraging patron preference insights to drive incremental revenue and solidify market position.
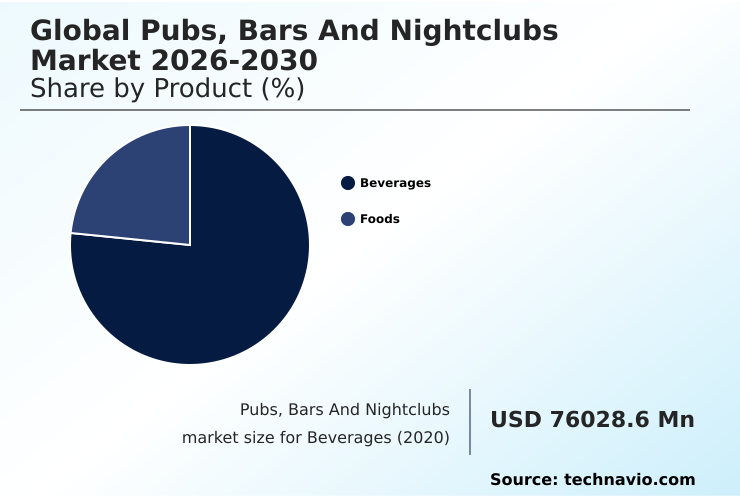
The Beverages segment was valued at USD 92.18 billion in 2024 and showed a gradual increase during the forecast period.
Regional Analysis
Europe is estimated to contribute 39.7% to the growth of the global market during the forecast period.Technavio’s analysts have elaborately explained the regional trends and drivers that shape the market during the forecast period.
See How Pubs, Bars And Nightclubs Market Demand is Rising in Europe Get Free Sample
The geographic landscape is highly varied, with mature markets like Europe contributing nearly 39.7% of incremental growth, while APAC shows dynamic expansion.
In all regions, operators use customer data analysis and social media engagement analytics for digital brand building and to tailor offerings. For instance, implementing inventory management software based on regional trends has led to a 15% reduction in waste.
The dayparting business model is being adapted globally, with dayparting revenue strategies adjusted for local cultural norms. Chain brand standardization offers consistency in a high-traffic location strategy, whereas local venues focus on venue ambiance design and sustainable sourcing practices.
Patron preference insights are critical, driving decisions from menu development, including plant-based menu options, to activating customer loyalty programs.
Market Dynamics
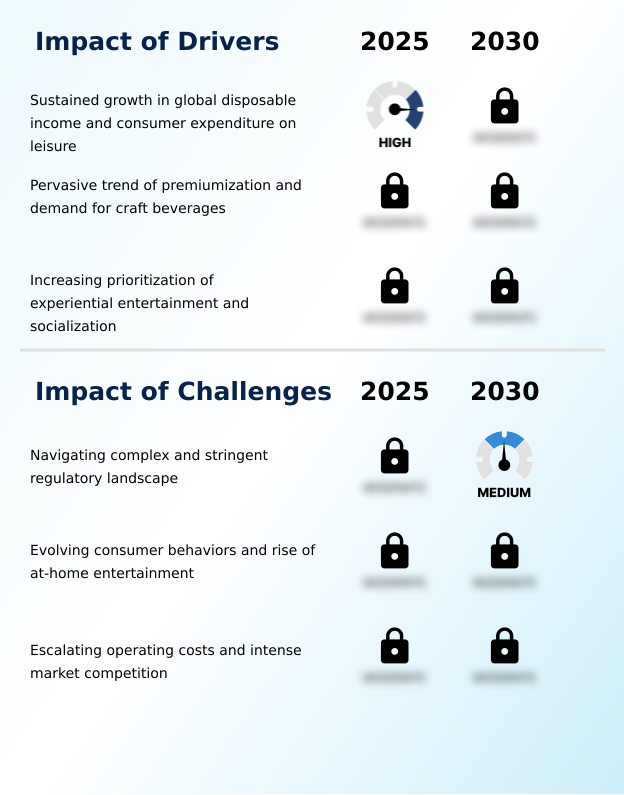
Our researchers analyzed the data with 2025 as the base year, along with the key drivers, trends, and challenges. A holistic analysis of drivers will help companies refine their marketing strategies to gain a competitive advantage.
- Strategic decision-making in the current market hinges on understanding several interconnected dynamics. A key area is the impact of premiumization on beverage sales, which compels a reassessment of inventory management for artisanal spirits and refined craft beer menu curation strategies. The role of mixology in brand differentiation has become central, moving beyond the drink itself to the entire customer experience.
- Simultaneously, the growth of NOLO beverage menus is reshaping what it means to socialize, challenging operators to innovate. Technology integration in bar management is no longer optional, with data analytics for patron behavior directly informing digital marketing for restaurant-bars. Operators are exploring hybrid venue revenue diversification models and optimizing dayparting in hospitality to maximize asset use.
- This is crucial as they compete with the trend of at-home entertainment vs on-premise spending. For chain pubs, customer retention is a core focus, while those exploring a franchise model for themed bars must provide a proven playbook. The growth of eatertainment is reflected in strategies for competitive socializing venues and efforts toward improving profitability in gastropubs.
- Throughout these initiatives, navigating the challenges of liquor licensing compliance and the legal risks of dram shop liability remains a constant operational burden, compounded by the need for managing operating costs in nightclubs. Sustainable practices in bar operations offer a way to connect with modern values, providing a competitive edge.
- Venues employing these diverse strategies report operational efficiencies that are comparatively higher than those with a singular focus.
What are the key market drivers leading to the rise in the adoption of Pubs, Bars And Nightclubs Industry?
- Market expansion is primarily driven by sustained growth in global disposable income and the corresponding rise in consumer expenditure on leisure.
- Market growth is fundamentally driven by the demand for venues that serve a social hub functionality, acting as a modern third place concept. This is fueled by the rising value of experiential social currency, where unique outings are prized.
- Competitive socializing venues and those with strong craft beverage programs are thriving, particularly those showcasing high-end mixology services.
- The independent operator agility allows for rapid implementation of live music programming, themed night events, and interactive game integration, which can boost midweek traffic by over 30%.
- These competitive socializing activities cater to a diverse audience, including the growing sober curious clientele.
- Effective targeted marketing campaigns, leveraging data from customer loyalty programs, have proven to increase repeat business by more than 20%, demonstrating the power of personalized engagement.
What are the market trends shaping the Pubs, Bars And Nightclubs Industry?
- The pervasive integration of technology and the subsequent digital transformation are emerging as a defining trend, reshaping the market's operational and strategic landscape.
- Market trends are increasingly centered on hybrid venue operations and experiential entertainment concepts that redefine the consumer outing. The eatertainment business format, which blends dining with activities, has shown an ability to increase customer spend by up to 25% per visit. This move toward multi-functional space design is supported by a comprehensive digital transformation that improves the holistic customer journey.
- For patrons, this means seamless interactions via digital menu integration, contactless payment systems, and mobile ordering applications. For operators, it involves leveraging back-of-house technology and hospitality CRM platforms for gains in operational efficiency tools, reducing order processing times by 18%. Concepts like all-day cafe-bar concepts are also gaining traction, responding to mindful consumption trends through sophisticated digital brand building.
What challenges does the Pubs, Bars And Nightclubs Industry face during its growth?
- A key challenge affecting industry growth is the need to navigate an exceptionally complex and stringent regulatory landscape.
- Operators face a significant regulatory compliance burden, with complex liquor licensing regulations and strict dram shop liability laws presenting constant financial risk. Adhering to varied zoning and noise ordinances and stringent health and safety standards requires diligent capital expenditure planning, with compliance-related costs representing up to 10% of operational budgets.
- On the economic front, high occupancy cost management in prime locations and escalating labor cost optimization pressures compress margins. This is intensified by intense at-home entertainment competition. Furthermore, managing intricate supply chain logistics for consistent beverage cost control is critical.
- For entities using franchise operating models, maintaining brand standards across a high-traffic location strategy while supporting franchisee profitability adds another layer of complexity. Effective staff retention strategies are crucial to mitigate high employee turnover costs.
Exclusive Technavio Analysis on Customer Landscape
The pubs, bars and nightclubs market forecasting report includes the adoption lifecycle of the market, covering from the innovator’s stage to the laggard’s stage. It focuses on adoption rates in different regions based on penetration. Furthermore, the pubs, bars and nightclubs market report also includes key purchase criteria and drivers of price sensitivity to help companies evaluate and develop their market growth analysis strategies.
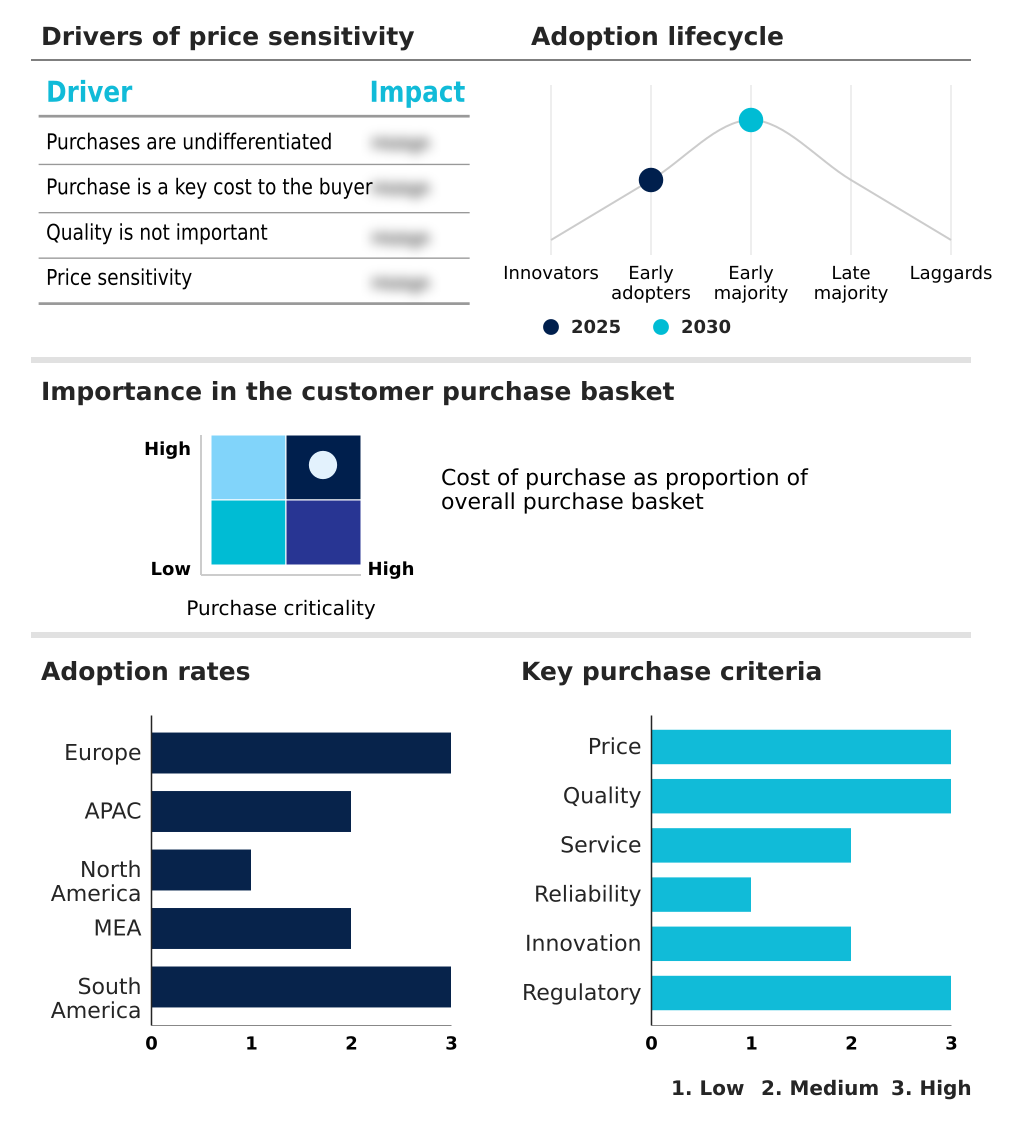
Customer Landscape of Pubs, Bars And Nightclubs Industry
Competitive Landscape
Companies are implementing various strategies, such as strategic alliances, pubs, bars and nightclubs market forecast, partnerships, mergers and acquisitions, geographical expansion, and product/service launches, to enhance their presence in the industry.
Admiral Taverns Ltd. - Offerings include managed pubs, bars, and nightclubs, featuring concepts such as leased and tenanted establishments, providing a range of social entertainment and hospitality experiences.
The industry research and growth report includes detailed analyses of the competitive landscape of the market and information about key companies, including:
- Admiral Taverns Ltd.
- Dave and Busters Entertainment
- Fuller, Smith and Turner P.L.C.
- Greene King Plc
- Groot Hospitality
- Grupo Pacha
- Inspire Brands Inc.
- J D Wetherspoon plc
- Loungers Plc
- Marston PLC
- Mitchells and Butlers plc
- Palladium Hotel Group
- Punch Pubs and Co
- Rekom Group AS
- Stonegate Pub Co. Ltd.
- Tao Group Hospitality
- Young and Co. Brewery P.L.C.
- Zouk Group
Qualitative and quantitative analysis of companies has been conducted to help clients understand the wider business environment as well as the strengths and weaknesses of key industry players. Data is qualitatively analyzed to categorize companies as pure play, category-focused, industry-focused, and diversified; it is quantitatively analyzed to categorize companies as dominant, leading, strong, tentative, and weak.
Recent Development and News in Pubs, bars and nightclubs market
- In January, 2025, RCI Hospitality Holdings Inc. completed its acquisition of Flight Club, a strategic move to broaden its portfolio with high-end entertainment and competitive socializing venues.
- In April, 2025, a consortium of international beverage associations launched the Green Chalice Initiative, a new certification program promoting sustainability criteria such as waste reduction and ethical sourcing.
- In March, 2025, the high-concept cocktail bar Alchemist Garden launched in Toronto, Canada, combining mixology with immersive theatrical performances and interactive narrative elements.
- In January, 2025, the Celestial Bar was launched within the new Desert Star hotel in Doha, Qatar, offering bespoke cocktails and panoramic city views to a discerning clientele.
Dive into Technavio’s robust research methodology, blending expert interviews, extensive data synthesis, and validated models for unparalleled Pubs, Bars And Nightclubs Market insights. See full methodology.
| Market Scope | |
|---|---|
| Page number | 285 |
| Base year | 2025 |
| Historic period | 2020-2024 |
| Forecast period | 2026-2030 |
| Growth momentum & CAGR | Accelerate at a CAGR of 5.3% |
| Market growth 2026-2030 | USD 38038.7 million |
| Market structure | Fragmented |
| YoY growth 2025-2026(%) | 5.1% |
| Key countries | UK, Germany, France, Spain, Italy, The Netherlands, China, Japan, India, Australia, South Korea, Indonesia, US, Canada, Mexico, UAE, Saudi Arabia, South Africa, Turkey, Qatar, Brazil, Argentina and Chile |
| Competitive landscape | Leading Companies, Market Positioning of Companies, Competitive Strategies, and Industry Risks |
Research Analyst Overview
- The market is defined by a strategic pivot towards high-value on-premise beverage consumption, where experiential entertainment concepts and competitive socializing venues are becoming standard. This requires robust craft beverage programs and high-end mixology services to support the premiumization of beverages.
- Boardroom decisions now center on the gastropub business model and hybrid venue operations, which utilize dayparting revenue strategies and all-day cafe-bar concepts to maximize profitability.
- Technology is critical; digital menu integration, contactless payment systems, and mobile ordering applications are essential front-of-house tools, while hospitality CRM platforms and advanced inventory management software anchor back-end efficiency, with some operators reducing inventory discrepancies by over 30%. Independent operator agility allows for rapid adaptation, such as incorporating live music programming or themed night events.
- In contrast, chain brand standardization and franchise operating models focus on scalability. Key operational challenges include navigating complex liquor licensing regulations, mitigating dram shop liability laws, optimizing labor cost optimization, and managing supply chain logistics. Firms must also compete with at-home entertainment competition through superior venue ambiance design and interactive game integration.
- The rise of the NOLO beverage category and zero-proof cocktail menus, alongside late-night food service and sustainable sourcing practices, reflects a response to evolving consumer demands, with customer data analysis and social media engagement analytics guiding these strategic shifts, all while managing beverage cost control.
What are the Key Data Covered in this Pubs, Bars And Nightclubs Market Research and Growth Report?
-
What is the expected growth of the Pubs, Bars And Nightclubs Market between 2026 and 2030?
-
USD 38.04 billion, at a CAGR of 5.3%
-
-
What segmentation does the market report cover?
-
The report is segmented by Product (Beverages, and Foods), Application (Men, and Women), Ownership (Independent, Chain, and Franchise) and Geography (Europe, APAC, North America, Middle East and Africa, South America)
-
-
Which regions are analyzed in the report?
-
Europe, APAC, North America, Middle East and Africa and South America
-
-
What are the key growth drivers and market challenges?
-
Sustained growth in global disposable income and consumer expenditure on leisure, Navigating complex and stringent regulatory landscape
-
-
Who are the major players in the Pubs, Bars And Nightclubs Market?
-
Admiral Taverns Ltd., Dave and Busters Entertainment, Fuller, Smith and Turner P.L.C., Greene King Plc, Groot Hospitality, Grupo Pacha, Inspire Brands Inc., J D Wetherspoon plc, Loungers Plc, Marston PLC, Mitchells and Butlers plc, Palladium Hotel Group, Punch Pubs and Co, Rekom Group AS, Stonegate Pub Co. Ltd., Tao Group Hospitality, Young and Co. Brewery P.L.C. and Zouk Group
-
Market Research Insights
- The market's dynamics are shaped by a pronounced shift toward an experiential value proposition, where venues act as hubs for on-premise social experiences. This transition requires significant capital expenditure planning, with operators focusing on venue differentiation tactics to stand out. Establishments that extend customer dwell time through engaging programming see revenue increases of over 15% compared to competitors.
- Furthermore, aligning with mindful consumption trends by offering sophisticated options from the NOLO beverage category has been shown to improve customer loyalty by 10%. Brand identity curation is now paramount, moving beyond the product to encompass the entire holistic customer journey and the venue's role as a third place concept.
We can help! Our analysts can customize this pubs, bars and nightclubs market research report to meet your requirements.
 RIA -
RIA - 
