
Port Community Systems (Pcs) Market Size and Growth Forecast 2026-2030
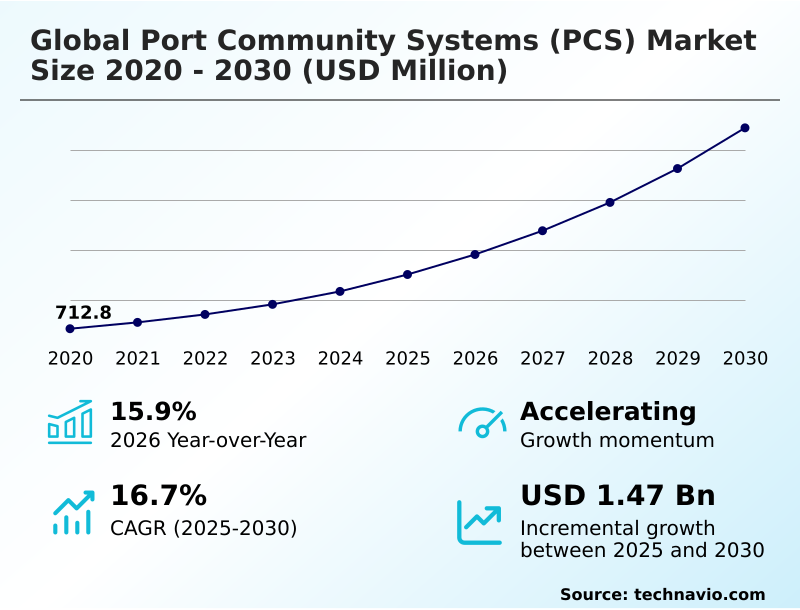
The Port Community Systems (Pcs) Market size was valued at USD 1.26 billion in 2025 growing at a CAGR of 16.7% during the forecast period 2026-2030.
APAC accounts for 36.3% of incremental growth during the forecast period. The Software segment by Component was valued at USD 732.5 million in 2024, while the Cloud-based segment holds the largest revenue share by Deployment.
The market is projected to grow by USD 2.01 billion from 2020 to 2030, with USD 1.47 billion of the growth expected during the forecast period of 2025 to 2030.
Get Key Insights on Market Forecast (PDF) Request Free Sample
Port Community Systems (Pcs) Market Overview
The port community systems market is expanding as maritime trade digitizes to enhance efficiency and comply with global standards like the IMO's FAL Convention. Driven by the need to manage complex logistics, these systems function as a neutral supply chain visibility platform, connecting disparate stakeholders. Growth is most pronounced in APAC, which accounts for over 36% of market expansion. A key trend is the move toward proactive operational management. For instance, a major container port deploys a digital twin for ports, integrating real-time cargo tracking data with feeds from automated gate systems. This allows for predictive analysis of yard density and truck traffic, enabling dynamic port call optimization. The system communicates adjusted vessel arrival times directly to carriers, reducing anchorage time and fuel consumption by up to 15%, demonstrating a direct link between digital integration and tangible operational and environmental benefits.
Drivers, Trends, and Challenges in the Port Community Systems (Pcs) Market
The evolution of port community systems is driven by a focus on specific, high-value outcomes. For procurement decision-makers, implementing AI for predictive vessel arrivals and coordinating just-in-time vessel port calls are no longer futuristic concepts but key requirements for reducing fuel consumption and emissions.
This involves providing real-time container status updates and automating truck appointment scheduling systems to smooth out landside operations. A core objective is ensuring IMO FAL compliance via digital reporting, which necessitates managing cross-border customs data exchange efficiently and facilitating paperless customs declaration submission.
To achieve this, ports are creating digital twins for port operation simulation to test new workflows before deployment. Technologically, this means integrating blockchain for trade document security and developing APIs for third-party logistics integration. Securing maritime data against cyber threats remains a paramount concern.
The ultimate goal is enhancing supply chain resilience through PCS by improving port throughput with automation, optimizing intermodal connections via PCS, and using PCS data for managing hinterland transport.
This strategy, which includes deploying SaaS PCS for small ports, links trade finance with logistics data, calculates the carbon footprint per container move, and is crucial for reducing port congestion with data analytics.
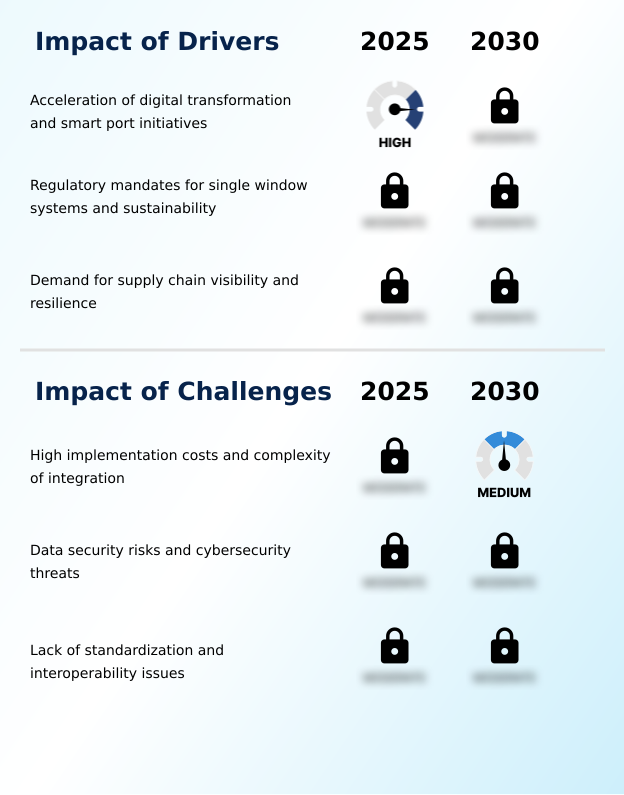
Primary Growth Driver: The acceleration of digital transformation and smart port initiatives serves as a key driver for the adoption of advanced port community systems.
The demand for operational efficiency gains is a primary market catalyst, compelling port authorities to replace manual processes with logistics process automation.
The mandatory implementation of a Maritime Single Window environment, as required by the International Maritime Organization (IMO), serves as a significant regulatory driver, pushing for standardized digital reporting and regulatory compliance management.
This push is reinforced by the need for end-to-end supply chain visibility, as cargo owners now require granular, real-time tracking to manage inventory and mitigate disruption risks.
Systems that facilitate Just-in-Time (JIT) arrival not only enhance efficiency but also address environmental pressures by reducing fuel consumption, creating a powerful combination of commercial and regulatory incentives for adoption.
Emerging Market Trend: The acceleration of cloud-based architectures and SaaS models is a significant upcoming trend, fundamentally reshaping the deployment of digital infrastructure within the maritime industry.
The market is shifting from on-premise systems to cloud-based SaaS models, which offer greater scalability and facilitate API-driven connectivity. This architectural evolution democratizes access for smaller ports and enhances interoperability, a key goal of DCSA standards.
Concurrently, the integration of distributed ledger technology is gaining momentum, with blockchain-based bills of lading and smart contracts in logistics automating documentation and payment processes to reduce fraud. Furthermore, the application of artificial intelligence for predictive congestion analytics is transforming platforms from data exchanges into decision-support tools.
These systems now enable just-in-time arrival protocols and facilitate GHG emission tracking, aligning operational efficiency with sustainability mandates from the International Maritime Organization.
Key Industry Challenge: High implementation costs and the inherent complexity of integrating disparate legacy systems present key challenges affecting the market's growth trajectory.
High implementation costs and the complexity of integrating with disparate legacy systems remain significant barriers to adoption, particularly for smaller ports. A critical challenge is ensuring robust cybersecurity for maritime systems, as centralizing sensitive commercial data creates a high-value target for cyberattacks, raising concerns over stakeholder data exchange.
Furthermore, the lack of universal interoperability standards hinders seamless data flow between different port ecosystems, creating digital silos and operational friction. While organizations like the Digital Container Shipping Association (DCSA) are promoting standardization, a fragmented landscape persists.
This fragmentation is compounded by issues of data sovereignty in logistics, where national regulations restrict cross-border data flows, complicating efforts to achieve a truly global, interconnected system.
Explore Full Market Dynamics Analysis Request Free Sample
Port Community Systems (Pcs) Market Segmentation
The port community systems (pcs) industry research report provides comprehensive data including region-wise segment analysis, with forecasts and analysis for the period 2026-2030, as well as historical data from 2020-2024 for the following segments.
Component Segment Analysis
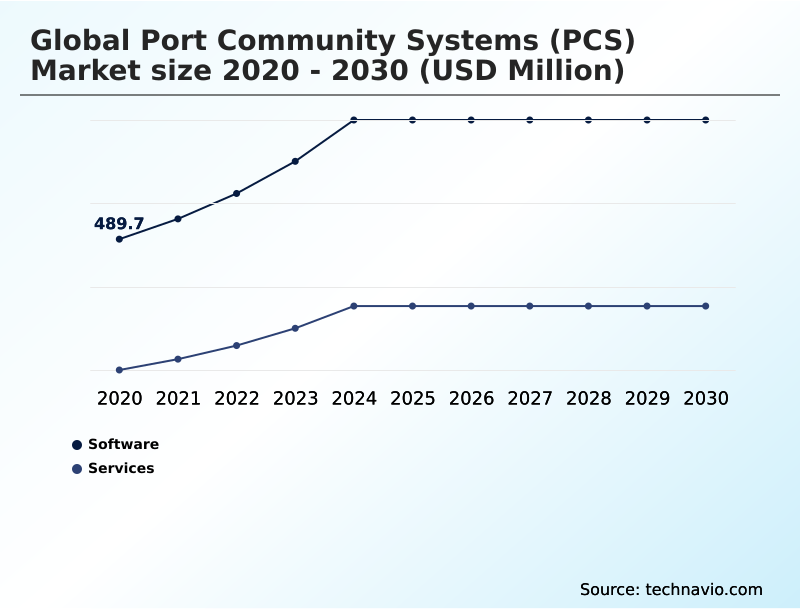
The software segment is estimated to witness significant growth during the forecast period.
The market is primarily segmented by component and deployment model. The software segment, which accounts for approximately 66% of the market, provides the core platforms for customs clearance automation and Terminal Operating System (TOS) integration.
These solutions are pivotal in creating a paperless trade environment. The services segment encompasses consulting, implementation, and maintenance, ensuring systems are aligned with local regulations and user workflows.
By deployment, the market is shifting decisively toward cloud-based models, which offer superior scalability and facilitate data-driven decision support compared to traditional on-premises solutions.
Hybrid models also persist, allowing organizations to balance security mandates with the need for agile, cloud-native applications for stakeholder collaboration.
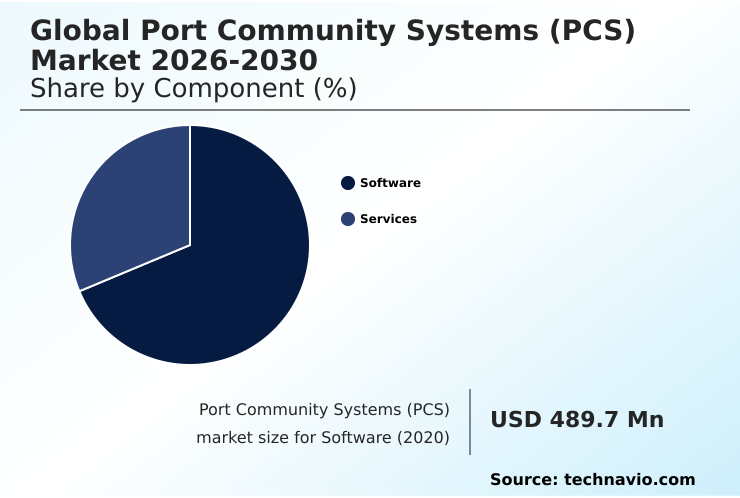
The Software segment was valued at USD 732.5 million in 2024 and showed a gradual increase during the forecast period.
Port Community Systems (Pcs) Market by Region: APAC Leads with 36.3% Growth Share
APAC is estimated to contribute 36.3% to the growth of the global market during the forecast period.
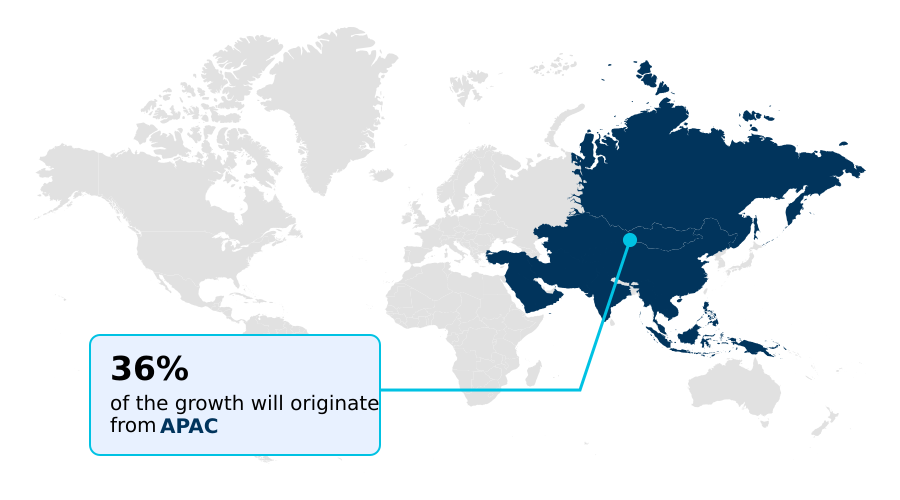
Geographically, the market landscape is diverse. APAC leads with 36.3% of the incremental growth, driven by massive trade volumes and government-led smart port ecosystem initiatives in countries like China and Singapore.
Europe, contributing nearly 28% of growth, represents a mature market focused on enhancing its digital logistics corridor through initiatives like the European Maritime Single Window environment. The focus here is on sustainability and deep hinterland logistics coordination.
In North America, the drive is to modernize and connect fragmented systems to improve intermodal transport integration and create a resilient port-centric logistics network.
The Middle East and Africa are leveraging PCS as part of economic diversification, while South America focuses on digitizing to reduce bureaucracy and support commodity exports.
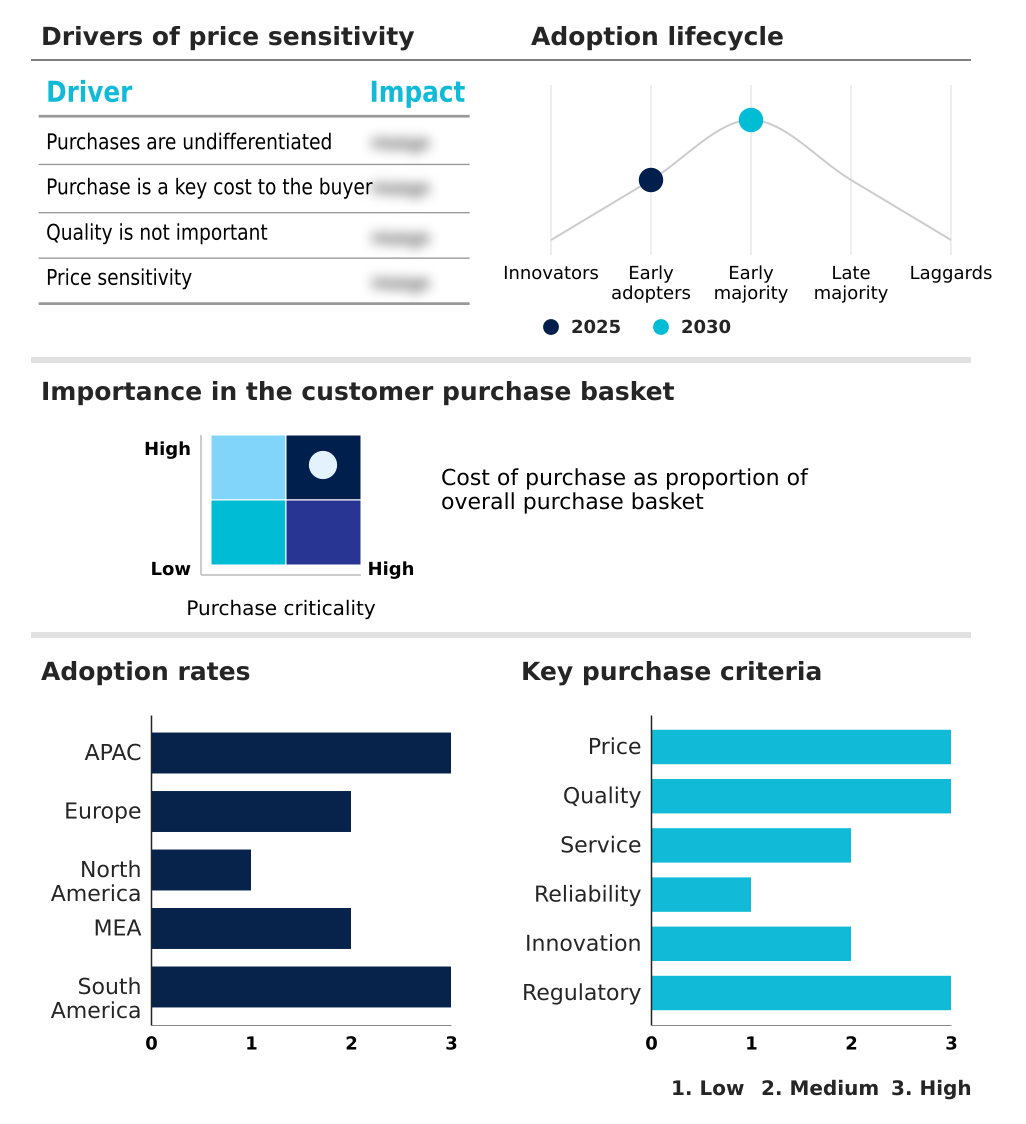
Customer Landscape Analysis for the Port Community Systems (Pcs) Market
The port community systems (pcs) market forecasting report includes the adoption lifecycle of the market, covering from the innovator’s stage to the laggard’s stage. It focuses on adoption rates in different regions based on penetration. Furthermore, the port community systems (pcs) market report also includes key purchase criteria and drivers of price sensitivity to help companies evaluate and develop their market growth analysis strategies.
Competitive Landscape of the Port Community Systems (Pcs) Market
Companies are implementing various strategies, such as strategic alliances, partnerships, mergers and acquisitions, geographical expansion, and product/service launches, to enhance their presence in the port community systems (pcs) market industry.
CONEX - Integrated digital platforms provide trade facilitation, customs compliance, and real-time cargo visibility, optimizing port operations and securing stakeholder data exchange.
The industry research and growth report includes detailed analyses of the competitive landscape of the market and information about key companies, including:
- CONEX
- CrimsonLogic Pte. Ltd.
- CyberLogitec
- DAKOSY
- dbh Logistics IT AG
- Descartes Systems Group Inc.
- Envision ES Pvt. Ltd
- German Ports
- Hexagon AB
- Kale Logistics Solutions Pvt. Ltd.
- Kaleris
- Kamarajar Port Limited
- MCP Plc
- MGI
- Portall Infosystems Pvt. Ltd.
- Portbase
- SGS SA
- SOGET SA
- Wartsila Corp.
- Webb Fontaine Group
Qualitative and quantitative analysis of companies has been conducted to help clients understand the wider business environment as well as the strengths and weaknesses of key industry players. Data is qualitatively analyzed to categorize companies as pure play, category-focused, industry-focused, and diversified; it is quantitatively analyzed to categorize companies as dominant, leading, strong, tentative, and weak.
Recent Developments in the Port Community Systems (Pcs) Market
- In March, 2025, the Maritime and Port Authority of Singapore launched a next-generation expansion of its digital platforms, integrating autonomous drone delivery coordination directly into the port community interface.
- In May, 2025, Kale Logistics Solutions partnered with Omans Ministry of Transport, Communications and Information Technology to design and implement a National Port Community System for the country.
- In October, 2025, DP World launched a digital Port Community System in Mombasa, aimed at enhancing operational efficiency and streamlining trade across Kenyas ports.
- In December, 2025, port system service provider Community Network Services completed the rollout of the latest phase of its new Port Community System (PCS), with the initial terminals now fully operational.
Research Analyst Overview: Port Community Systems (Pcs) Market
The imperative for digital transformation is forcing port authorities and terminal operators to re-evaluate their core systems, moving beyond basic data exchange to create a comprehensive data aggregation hub. The decision-making at the boardroom level now centers on justifying capital expenditure for next-generation platforms that provide a measurable return on investment through enhanced asset utilization and risk mitigation.
For example, the business case for upgrading a legacy berth allocation system is no longer about simple scheduling; it's about integrating with vessel traffic management (VTM) and drayage optimization modules to reduce truck turn times and vessel idling, directly impacting operating costs. Compliance with security standards like ISO 28000 is also a key factor.
With cloud-based deployments now commanding more than double the market share of on-premises solutions, the strategic shift towards scalable, interoperable platforms that support a single window for trade (SWIFT) is undeniable and central to competitive positioning.
Dive into Technavio’s robust research methodology, blending expert interviews, extensive data synthesis, and validated models for unparalleled Port Community Systems (Pcs) Market insights. See full methodology.
| Market Scope | |
|---|---|
| Page number | 301 |
| Base year | 2025 |
| Historic period | 2020-2024 |
| Forecast period | 2026-2030 |
| Growth momentum & CAGR | Accelerate at a CAGR of 16.7% |
| Market growth 2026-2030 | USD 1466.5 million |
| Market structure | Fragmented |
| YoY growth 2025-2026(%) | 15.9% |
| Key countries | China, Japan, India, South Korea, Australia, Indonesia, The Netherlands, Germany, UK, France, Italy, Spain, US, Canada, Mexico, UAE, Saudi Arabia, South Africa, Turkey, Israel, Brazil, Argentina and Colombia |
| Competitive landscape | Leading Companies, Market Positioning of Companies, Competitive Strategies, and Industry Risks |
Port Community Systems (Pcs) Market: Key Questions Answered in This Report
-
What is the expected growth of the Port Community Systems (Pcs) Market between 2026 and 2030?
-
The Port Community Systems (Pcs) Market is expected to grow by USD 1.47 billion during 2026-2030, registering a CAGR of 16.7%. Year-over-year growth in 2026 is estimated at 15.9%%. This acceleration is shaped by acceleration of digital transformation and smart port initiatives, which is intensifying demand across multiple end-use verticals covered in the report.
-
-
What segmentation does the market report cover?
-
The report is segmented by Component (Software, and Services), Deployment (Cloud-based, On-premises, and Hybrid), Application (Cargo and container management, Customs and compliance, Logistics and payments, Vessel and marine services, and Data and analytics) and Geography (APAC, Europe, North America, Middle East and Africa, South America). Among these, the Software segment is estimated to witness significant growth during the forecast period, driven by rising adoption across key application areas. Each segment includes detailed qualitative and quantitative analysis, along with historical data from 2020-2024 and forecasts through 2030 with year-over-year growth rates.
-
-
Which regions are analyzed in the report?
-
The report covers APAC, Europe, North America, Middle East and Africa and South America. APAC is estimated to contribute 36.3% to market growth during the forecast period. Country-level analysis includes China, Japan, India, South Korea, Australia, Indonesia, The Netherlands, Germany, UK, France, Italy, Spain, US, Canada, Mexico, UAE, Saudi Arabia, South Africa, Turkey, Israel, Brazil, Argentina and Colombia, with dedicated market size tables and year-over-year growth for each.
-
-
What are the key growth drivers and market challenges?
-
The primary driver is acceleration of digital transformation and smart port initiatives, which is accelerating investment and industry demand. The main challenge is high implementation costs and complexity of integration, creating operational barriers for key market participants. The report quantifies the impact of each driver and challenge across 2026 and 2030 with comparative analysis.
-
-
Who are the major players in the Port Community Systems (Pcs) Market?
-
Key vendors include CONEX, CrimsonLogic Pte. Ltd., CyberLogitec, DAKOSY, dbh Logistics IT AG, Descartes Systems Group Inc., Envision ES Pvt. Ltd, German Ports, Hexagon AB, Kale Logistics Solutions Pvt. Ltd., Kaleris, Kamarajar Port Limited, MCP Plc, MGI, Portall Infosystems Pvt. Ltd., Portbase, SGS SA, SOGET SA, Wartsila Corp. and Webb Fontaine Group. The report provides qualitative and quantitative analysis categorizing companies as dominant, leading, strong, tentative, and weak based on their market positioning. Company profiles include business segment analysis, SWOT assessment, key offerings, and recent strategic developments.
-
Port Community Systems (Pcs) Market Research Insights
With an accelerating year-over-year growth of 15.9%, the port community systems market is being reshaped by the urgent need for resilient supply chain management. Recent disruptions have highlighted the vulnerabilities of non-digitized processes, pushing stakeholders toward a paperless trade environment.
This involves more than just eliminating documents; it requires establishing a neutral digital platform that enables real-time data sharing among all participants. In practice, a port authority utilizes its PCS for data-driven decision support, analyzing cargo flow data to predict bottlenecks and dynamically adjust resource allocation.
The adoption of common frameworks, such as DCSA standards, is critical for ensuring that this data can be exchanged seamlessly, underpinning the collaborative ecosystem required for modern global trade.
We can help! Our analysts can customize this port community systems (pcs) market research report to meet your requirements.
 RIA -
RIA - 
