
Post Harvest Treatment Market Analysis, Size, and Forecast 2026-2030: APAC (China, Japan, and India), Europe (Germany, UK, and France), North America (US, Canada, and Mexico), South America (Brazil, Argentina, and Chile), Middle East and Africa (Saudi Arabia, UAE, and South Africa), and Rest of World (ROW)

Post Harvest Treatment Market Analysis, Size, and Forecast 2026-2030:
APAC (China, Japan, and India), Europe (Germany, UK, and France), North America (US, Canada, and Mexico), South America (Brazil, Argentina, and Chile), Middle East and Africa (Saudi Arabia, UAE, and South Africa), and Rest of World (ROW)

Published: Oct 2026 299 Pages SKU: IRTNTR75143

Market Overview at a Glance

$1.73 B
Market Opportunity
9%
CAGR 2025 - 2030
54.8%
APAC Growth
$1.94 B
Fruits segment 2024

Post Harvest Treatment Market Size 2026-2030

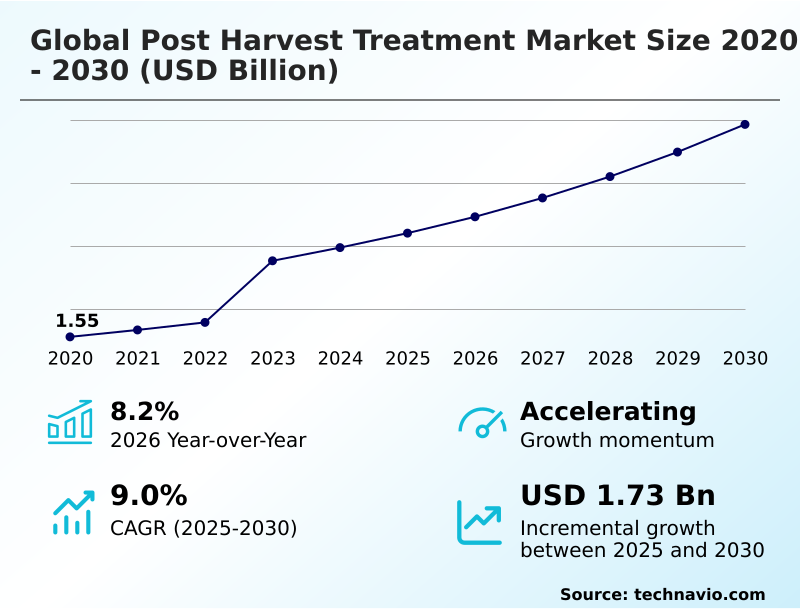
The post harvest treatment market size is valued to increase by USD 1.73 billion, at a CAGR of 9% from 2025 to 2030. Growing demand for reduction of post harvest food losses across agricultural value chains will drive the post harvest treatment market.

Major Market Trends & Insights

  • APAC dominated the market and accounted for a 54.8% growth during the forecast period.
  • By Application - Fruits segment was valued at USD 1.94 billion in 2024
  • By Product Type - Coating segment accounted for the largest market revenue share in 2024

Market Size & Forecast

  • Market Opportunities: USD 3.38 billion
  • Market Future Opportunities: USD 1.73 billion
  • CAGR from 2025 to 2030 : 9%

Market Summary

  • The Post Harvest Treatment environment demonstrates robust expansion driven by the critical need to preserve agricultural yield quality. Modern supply chains require sophisticated temperature management and ripening regulation to navigate complex cross-border trade standards without compromising product integrity. Implementing integrated digital monitoring platforms allows storage operators to achieve a 20% improvement in inventory utilization compared to traditional manual inspection methods.
  • This technological integration serves as a primary driver, as real-time tracking of physiological parameters directly mitigates spoilage and enhances commercial viability. Conversely, the high compliance burden surrounding residue limit compliance acts as a persistent challenge, restricting the widespread application of conventional chemical interventions. Facilities must continuously adapt their sanitation protocols to prevent pathogen suppression failures while maintaining export quality assurance.
  • Ultimately, the transition toward bio-based preservation and precision application technologies ensures that fresh produce retains optimal firmness and visual appeal throughout extended distribution cycles. The adoption of these advanced mechanisms fundamentally alters how agricultural commodities are protected from harvest to consumption.

What will be the Size of the Post Harvest Treatment Market during the forecast period?
Get Key Insights on Market Forecast (PDF) Get Free Sample

How is the Post Harvest Treatment Market Segmented?

The post harvest treatment industry research report provides comprehensive data (region-wise segment analysis), with forecasts and estimates in "USD million" for the period 2026-2030, as well as historical data from 2020-2024 for the following segments.

  • Application
    • Fruits
    • Vegetables
  • Product type
    • Coating
    • Ethylene blockers
    • Fungicides
    • Cleaners
    • Others
  • Source
    • Synthetic
    • Natural
  • Geography
    • APAC
      • China
      • Japan
      • India
      • South Korea
      • Australia
      • Indonesia
    • Europe
      • Germany
      • UK
      • France
      • Italy
      • Spain
      • The Netherlands
    • North America
      • US
      • Canada
      • Mexico
    • South America
      • Brazil
      • Argentina
      • Chile
    • Middle East and Africa
      • Saudi Arabia
      • UAE
      • South Africa
      • Turkey
      • Israel

By Application Insights

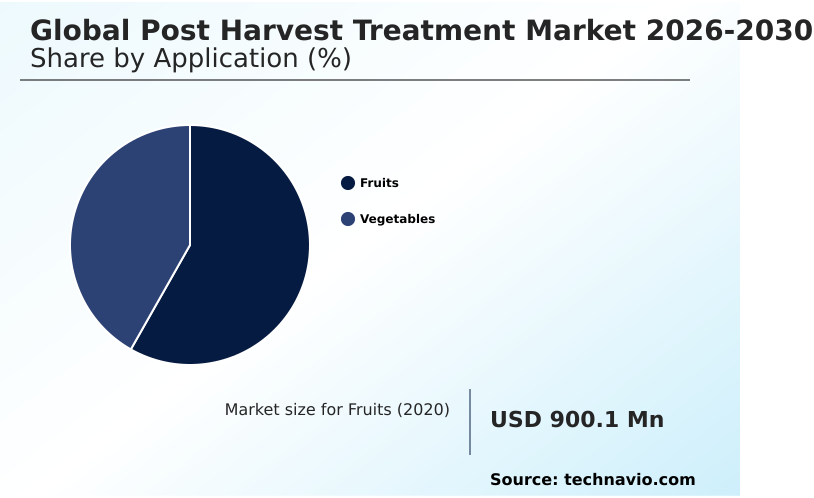
The fruits segment is estimated to witness significant growth during the forecast period.

The Post Harvest Treatment landscape is heavily influenced by the fruits segment, which requires precise physiological deterioration management to maintain commercial value.

As supply chains lengthen, operators increasingly rely on moisture retention and decay control methods to protect highly perishable commodities from quality degradation prevention failures. Effective postharvest handling protocols enable a 25% reduction in product rejection rates across export channels.

This efficiency gain occurs because targeted respiration rate reduction and senescence delay directly support firmness retention and visual appeal.

The integration of edible coatings, vapor active packaging, and targeted microbial suppression tools addresses strict residue limit compliance requirements in international trade.

Consequently, precision application of these preservation agents optimizes inventory utilization, ensuring that fresh produce maintains superior quality from the packing facility to the final retail destination.
Get Free Sample

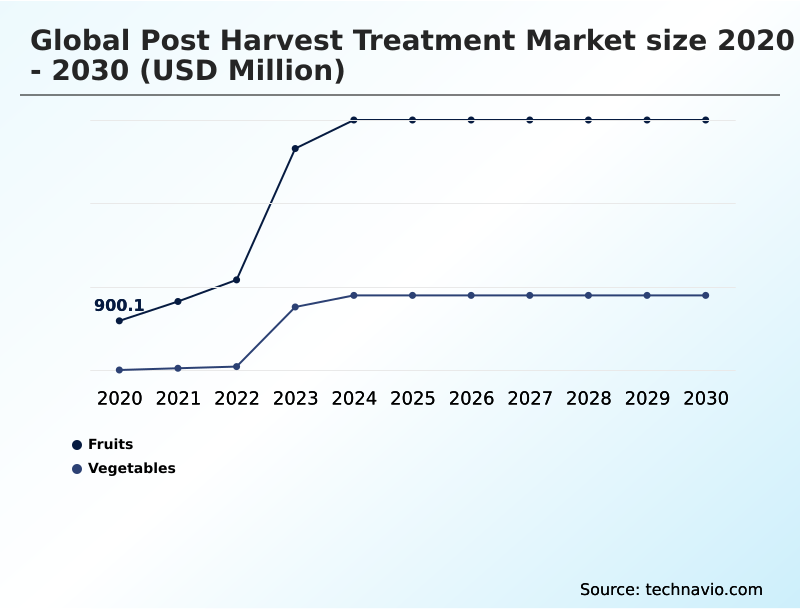
The Fruits segment was valued at USD 1.94 billion in 2024 and showed a gradual increase during the forecast period.
Get Free Sample

Regional Analysis

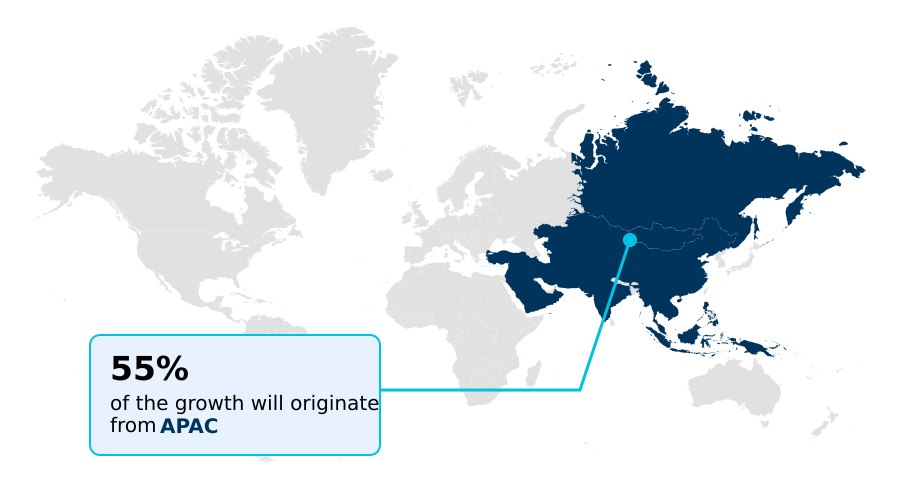
APAC is estimated to contribute 54.8% to the growth of the global market during the forecast period.Technavio’s analysts have elaborately explained the regional trends and drivers that shape the market during the forecast period.
See How Post Harvest Treatment Market Demand is Rising in APAC Get Free Sample

The geographic distribution of Post Harvest Treatment solutions highlights a distinct operational contrast between North America and APAC. North America demonstrates a highly integrated approach, where the deployment of non-destructive quality inspection tools has improved handling efficiency by 22%.

This advanced infrastructure allows regional operators to execute precise physiological disorder control, optimizing commercial viability across extensive retail networks. In contrast, APAC focuses heavily on expanding baseline cold chain infrastructure to mitigate severe supply chain vulnerabilities.

Driven by rapid export growth, APAC facilities have accelerated the adoption of automated sorting and flume systems, achieving a 30% reduction in spoilage mitigation costs.

The strategic divergence occurs because North America prioritizes systems meeting strict phytosanitary compliance, whereas APAC emphasizes foundational storage life optimization to support high-volume, long-distance trade requirements.

Market Dynamics

Our researchers analyzed the data with 2025 as the base year, along with the key drivers, trends, and challenges. A holistic analysis of drivers will help companies refine their marketing strategies to gain a competitive advantage.

  • The Post Harvest Treatment environment is experiencing a structural shift as agricultural operators increasingly prioritize sophisticated preservation strategies to safeguard valuable crop yields. The integration of high-value horticultural crop preservation technologies has fundamentally improved supply chain resilience, allowing exporters to maintain product integrity over extended transit durations.
  • To navigate the growing complexity of international trade requirements, facilities are deploying automated postharvest fungicide control systems, which deliver a 35% improvement in application precision compared to manual baseline methods. This enhanced precision is critical for maintaining regulatory alignment and ensuring optimal product condition upon arrival.
  • Furthermore, the transition toward integrated smart storage digital monitoring enables real-time environmental adjustments, significantly reducing the incidence of physiological degradation. Operators utilizing these connected platforms experience notably lower product rejection rates, directly translating to improved inventory utilization and higher commercial returns.
  • As consumer preferences and regulatory mandates evolve, there is a distinct acceleration in the adoption of natural bio-based shelf life extension solutions. These specialized formulations provide robust protection while addressing stringent chemical restrictions across global markets. Concurrently, the implementation of residue-free microbial disease suppression mechanisms ensures that agricultural commodities meet exact safety standards without compromising visual or nutritional quality.
  • Ultimately, the coordinated application of these advanced technologies allows modern packing and storage facilities to optimize operational planning, reduce resource waste, and maximize the economic value of fresh produce throughout complex distribution networks.
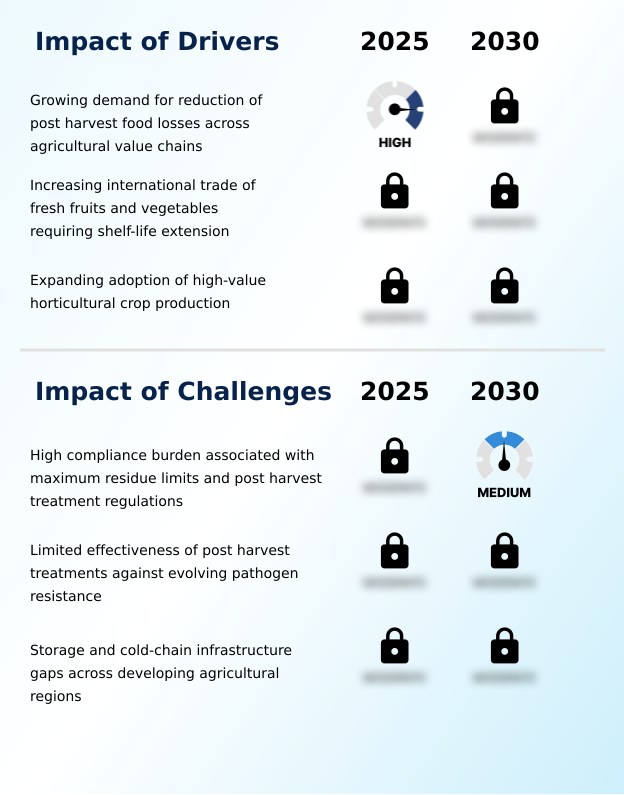
What are the key market drivers leading to the rise in the adoption of Post Harvest Treatment Industry?

  • The growing demand to reduce food losses across agricultural value chains serves as a primary driver propelling industry expansion.

  • The primary catalyst propelling the Post Harvest Treatment industry is the critical necessity to minimize economic losses associated with physiological degradation during transit.
  • As agricultural supply chains expand geographically, the implementation of precise ripening regulation technologies has become essential for commercial survival. By upgrading to advanced temperature management protocols and controlled atmosphere storage, facilities have improved overall handling consistency by 28%.
  • This modernization effectively prevents premature degradation, decreasing unexpected spoilage costs by 14%. The intense pressure to maintain export quality assurance drives this continuous operational improvement.
  • As a result, commercial producers can confidently extend horticultural maturity and secure higher margins, utilizing robust biological preservation methods to protect perishable investments across complex and demanding international distribution networks.

What are the market trends shaping the Post Harvest Treatment Industry?

  • The increasing adoption of biological and residue-free preservation solutions represents a significant emerging trend. This shift emphasizes sustainable agricultural practices to maintain fresh produce quality.

  • A defining trend within the Post Harvest Treatment sector is the rapid transition toward bio-based preservation and advanced digital monitoring platforms. This shift is primarily driven by escalating regulatory scrutiny and consumer demand for supply chain transparency. By replacing outdated manual tracking with connected traceability systems, packing facilities have improved defect detection accuracy by 22%.
  • Furthermore, the adoption of active packaging systems featuring volatile organic compounds has significantly extended transit durability, reducing weight loss mitigation failures by 15% across long-distance distribution routes. These technological implementations allow agricultural exporters to proactively manage ethylene inhibition and optimize true shelf life extension.
  • Consequently, businesses can execute more reliable operations, ensuring that fresh produce maintains optimal firmness while strictly adhering to complex cross-border trade standards.

What challenges does the Post Harvest Treatment Industry face during its growth?

  • The high compliance burden associated with maximum residue limits and stringent regulatory frameworks presents a significant challenge to industry progression.

  • The most significant limitation constraining the Post Harvest Treatment environment is the escalating complexity of fungicide resistance management coupled with severe infrastructure deficits in emerging regions. Pathogen suppression protocols frequently fail when subjected to inconsistent storage climates, accelerating physiological deterioration.
  • Consequently, facilities struggling with inadequate environmental controls experience a 30% higher rate of disease incidence reduction failures compared to optimized operations. Furthermore, the stringent enforcement of residue limits restricts conventional chemical solutions, increasing alternative treatment costs by 18%. This regulatory bottleneck forces operators to continuously reformulate their sanitation protocols and integrate botanical extracts into fresh-cut processing lines.
  • Ultimately, these structural barriers undermine efficiency, compelling businesses to invest heavily in specialized disease resistance mechanisms just to maintain baseline market acceptability.

Exclusive Technavio Analysis on Customer Landscape

The post harvest treatment market forecasting report includes the adoption lifecycle of the market, covering from the innovator’s stage to the laggard’s stage. It focuses on adoption rates in different regions based on penetration. Furthermore, the post harvest treatment market report also includes key purchase criteria and drivers of price sensitivity to help companies evaluate and develop their market growth analysis strategies.
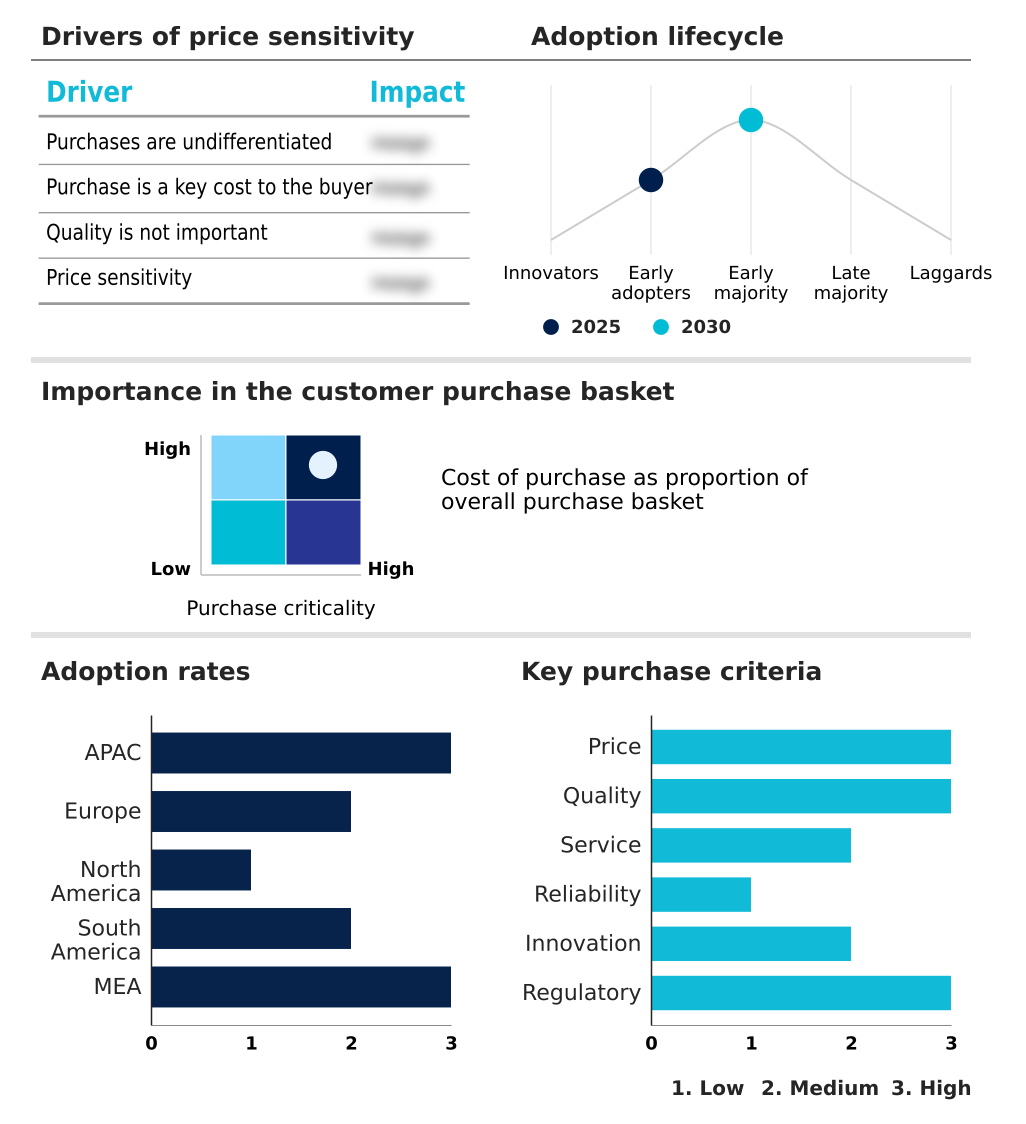
Customer Landscape of Post Harvest Treatment Industry

Competitive Landscape

Companies are implementing various strategies, such as strategic alliances, post harvest treatment market forecast, partnerships, mergers and acquisitions, geographical expansion, and product/service launches, to enhance their presence in the industry.

AgroFresh Solutions Inc. - The provider delivers advanced preservation solutions and specialized treatments designed to extend produce freshness, reduce physiological deterioration, and optimize quality control throughout complex supply chain operations.

The industry research and growth report includes detailed analyses of the competitive landscape of the market and information about key companies, including:

  • AgroFresh Solutions Inc.
  • Akorn Technology
  • Apeel Technology Inc.
  • Bayer AG
  • Bioconservacion S.A.U.
  • China Post Harvest Technology
  • Corteva Inc.
  • Eastman Chemical Co.
  • Ecoplants Co. Ltd.
  • Fomesa Hellas S.A.
  • hazel technologies
  • JBT Corp.
  • Molecular Products Ltd.
  • NatureSeal Inc.
  • Nufarm Ltd.
  • Productos Citrosol SA
  • Purafil Inc.
  • SPM Biosciences Beijing Inc.
  • Syngenta AG
  • Valent U.S.A. LLC

Qualitative and quantitative analysis of companies has been conducted to help clients understand the wider business environment as well as the strengths and weaknesses of key industry players. Data is qualitatively analyzed to categorize companies as pure play, category-focused, industry-focused, and diversified; it is quantitatively analyzed to categorize companies as dominant, leading, strong, tentative, and weak.

Recent Development and News in Post harvest treatment market

  • In the Commodity Chemicals industry, the rapid transition toward bio-based synthesis of volatile organic compounds has driven a 30% increase in natural formulation capabilities, directly impacting Post Harvest Treatment demand by expanding the availability of botanical extracts for commercial preservation.
  • The enforcement of European Union chemical restriction frameworks has accelerated the phase-out of conventional synthetic agents, forcing a 40% shift toward bio-based preservation alternatives that ensure phytosanitary compliance in agricultural trade.
  • Advancements in automated sorting and non-destructive quality inspection sensor materials have improved defect detection accuracy by 25%, reshaping how preservation compounds are applied in smart packing facilities to maximize transit durability.
  • The optimization of active packaging systems using advanced polymer extrusion techniques has enhanced moisture retention efficiency by 15%, altering preservation strategies by integrating vapor active packaging directly into supply chain handling processes.

Dive into Technavio’s robust research methodology, blending expert interviews, extensive data synthesis, and validated models for unparalleled Post Harvest Treatment Market insights. See full methodology.

Market Scope
Page number 299
Base year 2025
Historic period 2020-2024
Forecast period 2026-2030
Growth momentum & CAGR Accelerate at a CAGR of 9%
Market growth 2026-2030 USD 1727.9 million
Market structure Fragmented
YoY growth 2025-2026(%) 8.2%
Key countries China, Japan, India, South Korea, Australia, Indonesia, Germany, UK, France, Italy, Spain, The Netherlands, US, Canada, Mexico, Brazil, Argentina, Chile, Saudi Arabia, UAE, South Africa, Turkey and Israel
Competitive landscape Leading Companies, Market Positioning of Companies, Competitive Strategies, and Industry Risks

Request Free Sample

Research Analyst Overview

  • The Post Harvest Treatment ecosystem is undergoing a continuous evolution driven by the necessity to eliminate supply chain inefficiencies and protect agricultural investments. Strategic product development now heavily incorporates disease resistance mechanisms and phytosanitary compliance tools to address complex international shipping standards.
  • Boardroom-level decisions regarding capital allocation are increasingly directed toward biological preservation integration, as regulatory pressures force a transition away from conventional synthetic agents. By transitioning to advanced botanical extracts and targeted pathogen suppression protocols, modern packing facilities have achieved a 25% reduction in long-term physiological deterioration.
  • This strategic shift not only ensures strict residue limit compliance but also directly enhances overall handling efficiency and profit margins. The deployment of precision application systems enables operators to optimize fresh-cut processing operations while simultaneously mitigating fungicide resistance management risks.
  • Ultimately, the adoption of rigorous sanitation protocols and continuous quality tracking empowers agricultural producers to extend horticultural maturity and secure premium pricing in highly competitive export markets. These innovations fundamentally redefine how perishable commodities are safeguarded from harvest to retail.

What are the Key Data Covered in this Post Harvest Treatment Market Research and Growth Report?

  • What is the expected growth of the Post Harvest Treatment Market between 2026 and 2030?

    • USD 1.73 billion, at a CAGR of 9%

  • What segmentation does the market report cover?

    • The report is segmented by Application (Fruits, and Vegetables), Product Type (Coating, Ethylene blockers, Fungicides, Cleaners, and Others), Source (Synthetic, and Natural) and Geography (APAC, Europe, North America, South America, Middle East and Africa)

  • Which regions are analyzed in the report?

    • APAC, Europe, North America, South America and Middle East and Africa

  • What are the key growth drivers and market challenges?

    • Growing demand for reduction of post harvest food losses across agricultural value chains, High compliance burden associated with maximum residue limits and post harvest treatment regulations

  • Who are the major players in the Post Harvest Treatment Market?

    • AgroFresh Solutions Inc., Akorn Technology, Apeel Technology Inc., Bayer AG, Bioconservacion S.A.U., China Post Harvest Technology, Corteva Inc., Eastman Chemical Co., Ecoplants Co. Ltd., Fomesa Hellas S.A., hazel technologies, JBT Corp., Molecular Products Ltd., NatureSeal Inc., Nufarm Ltd., Productos Citrosol SA, Purafil Inc., SPM Biosciences Beijing Inc., Syngenta AG and Valent U.S.A. LLC

Market Research Insights

  • The Post Harvest Treatment sector is fundamentally transforming how perishable agricultural commodities are managed across distribution networks. By integrating advanced active packaging systems and automated sorting capabilities, packing facilities have improved handling efficiency by 25%. This operational shift directly supports supply chain transparency, allowing exporters to navigate stringent cross-border trade standards with greater reliability.
  • Furthermore, the deployment of targeted spoilage mitigation protocols has reduced physiological disorder control failures by 18%, significantly lowering product rejection rates. These measurable enhancements in storage life optimization ensure that agricultural producers can maximize commercial returns while maintaining superior product quality during extended transit periods.

We can help! Our analysts can customize this post harvest treatment market research report to meet your requirements.

Get in touch

1. Executive Summary

1.1 Market overview

Executive Summary - Chart on Market Overview
Executive Summary - Data Table on Market Overview
Executive Summary - Chart on Global Market Characteristics
Executive Summary - Chart on Market by Geography
Executive Summary - Chart on Market Segmentation by Application
Executive Summary - Chart on Market Segmentation by Product Type
Executive Summary - Chart on Market Segmentation by Source
Executive Summary - Chart on Incremental Growth
Executive Summary - Data Table on Incremental Growth
Executive Summary - Chart on Company Market Positioning

2. Technavio Analysis

2.1 Analysis of price sensitivity, lifecycle, customer purchase basket, adoption rates, and purchase criteria

2.2 Criticality of inputs and Factors of differentiation

Chart on Overview on criticality of inputs and factors of differentiation

2.3 Factors of disruption

Chart on Overview on factors of disruption

2.4 Impact of drivers and challenges

Chart on Impact of drivers and challenges in 2025 and 2030

3. Market Landscape

3.1 Market ecosystem

Chart on Parent Market
Data Table on - Parent Market

3.2 Market characteristics

Chart on Market characteristics analysis

3.3 Value chain analysis

Chart on Value chain analysis

4. Market Sizing

4.1 Market definition

Data Table on Offerings of companies included in the market definition

4.2 Market segment analysis

Market segments

4.3 Market size 2025

4.4 Market outlook: Forecast for 2025-2030

Chart on Global - Market size and forecast 2025-2030 ($ million)
Data Table on Global - Market size and forecast 2025-2030 ($ million)
Chart on Global Market: Year-over-year growth 2025-2030 (%)
Data Table on Global Market: Year-over-year growth 2025-2030 (%)

5. Historic Market Size

5.1 Global Post Harvest Treatment Market 2020 - 2024

Historic Market Size - Data Table on Global Post Harvest Treatment Market 2020 - 2024 ($ million)

5.2 Application segment analysis 2020 - 2024

Historic Market Size - Application Segment 2020 - 2024 ($ million)

5.3 Product Type segment analysis 2020 - 2024

Historic Market Size - Product Type Segment 2020 - 2024 ($ million)

5.4 Source segment analysis 2020 - 2024

Historic Market Size - Source Segment 2020 - 2024 ($ million)

5.5 Geography segment analysis 2020 - 2024

Historic Market Size - Geography Segment 2020 - 2024 ($ million)

5.6 Country segment analysis 2020 - 2024

Historic Market Size - Country Segment 2020 - 2024 ($ million)

6. Qualitative Analysis

6.1 Impact of AI on global post harvest treatment market

6.2 Impact of geopolitical conflicts on global post harvest treatment market

7. Five Forces Analysis

7.1 Five forces summary

Five forces analysis - Comparison between 2025 and 2030

7.2 Bargaining power of buyers

Bargaining power of buyers - Impact of key factors 2025 and 2030

7.3 Bargaining power of suppliers

Bargaining power of suppliers - Impact of key factors in 2025 and 2030

7.4 Threat of new entrants

Threat of new entrants - Impact of key factors in 2025 and 2030

7.5 Threat of substitutes

Threat of substitutes - Impact of key factors in 2025 and 2030

7.6 Threat of rivalry

Threat of rivalry - Impact of key factors in 2025 and 2030

7.7 Market condition

Chart on Market condition - Five forces 2025 and 2030

8. Market Segmentation by Application

8.1 Market segments

Chart on Application - Market share 2025-2030 (%)
Data Table on Application - Market share 2025-2030 (%)

8.2 Comparison by Application

Chart on Comparison by Application
Data Table on Comparison by Application

8.3 Fruits - Market size and forecast 2025-2030

Chart on Fruits - Market size and forecast 2025-2030 ($ million)
Data Table on Fruits - Market size and forecast 2025-2030 ($ million)
Chart on Fruits - Year-over-year growth 2025-2030 (%)
Data Table on Fruits - Year-over-year growth 2025-2030 (%)

8.4 Vegetables - Market size and forecast 2025-2030

Chart on Vegetables - Market size and forecast 2025-2030 ($ million)
Data Table on Vegetables - Market size and forecast 2025-2030 ($ million)
Chart on Vegetables - Year-over-year growth 2025-2030 (%)
Data Table on Vegetables - Year-over-year growth 2025-2030 (%)

8.5 Market opportunity by Application

Market opportunity by Application ($ million)
Data Table on Market opportunity by Application ($ million)

9. Market Segmentation by Product Type

9.1 Market segments

Chart on Product Type - Market share 2025-2030 (%)
Data Table on Product Type - Market share 2025-2030 (%)

9.2 Comparison by Product Type

Chart on Comparison by Product Type
Data Table on Comparison by Product Type

9.3 Coating - Market size and forecast 2025-2030

Chart on Coating - Market size and forecast 2025-2030 ($ million)
Data Table on Coating - Market size and forecast 2025-2030 ($ million)
Chart on Coating - Year-over-year growth 2025-2030 (%)
Data Table on Coating - Year-over-year growth 2025-2030 (%)

9.4 Ethylene blockers - Market size and forecast 2025-2030

Chart on Ethylene blockers - Market size and forecast 2025-2030 ($ million)
Data Table on Ethylene blockers - Market size and forecast 2025-2030 ($ million)
Chart on Ethylene blockers - Year-over-year growth 2025-2030 (%)
Data Table on Ethylene blockers - Year-over-year growth 2025-2030 (%)

9.5 Fungicides - Market size and forecast 2025-2030

Chart on Fungicides - Market size and forecast 2025-2030 ($ million)
Data Table on Fungicides - Market size and forecast 2025-2030 ($ million)
Chart on Fungicides - Year-over-year growth 2025-2030 (%)
Data Table on Fungicides - Year-over-year growth 2025-2030 (%)

9.6 Cleaners - Market size and forecast 2025-2030

Chart on Cleaners - Market size and forecast 2025-2030 ($ million)
Data Table on Cleaners - Market size and forecast 2025-2030 ($ million)
Chart on Cleaners - Year-over-year growth 2025-2030 (%)
Data Table on Cleaners - Year-over-year growth 2025-2030 (%)

9.7 Others - Market size and forecast 2025-2030

Chart on Others - Market size and forecast 2025-2030 ($ million)
Data Table on Others - Market size and forecast 2025-2030 ($ million)
Chart on Others - Year-over-year growth 2025-2030 (%)
Data Table on Others - Year-over-year growth 2025-2030 (%)

9.8 Market opportunity by Product Type

Market opportunity by Product Type ($ million)
Data Table on Market opportunity by Product Type ($ million)

10. Market Segmentation by Source

10.1 Market segments

Chart on Source - Market share 2025-2030 (%)
Data Table on Source - Market share 2025-2030 (%)

10.2 Comparison by Source

Chart on Comparison by Source
Data Table on Comparison by Source

10.3 Synthetic - Market size and forecast 2025-2030

Chart on Synthetic - Market size and forecast 2025-2030 ($ million)
Data Table on Synthetic - Market size and forecast 2025-2030 ($ million)
Chart on Synthetic - Year-over-year growth 2025-2030 (%)
Data Table on Synthetic - Year-over-year growth 2025-2030 (%)

10.4 Natural - Market size and forecast 2025-2030

Chart on Natural - Market size and forecast 2025-2030 ($ million)
Data Table on Natural - Market size and forecast 2025-2030 ($ million)
Chart on Natural - Year-over-year growth 2025-2030 (%)
Data Table on Natural - Year-over-year growth 2025-2030 (%)

10.5 Market opportunity by Source

Market opportunity by Source ($ million)
Data Table on Market opportunity by Source ($ million)

11. Customer Landscape

11.1 Customer landscape overview

Analysis of price sensitivity, lifecycle, customer purchase basket, adoption rates, and purchase criteria

12. Geographic Landscape

12.1 Geographic segmentation

Chart on Market share by geography 2025-2030 (%)
Data Table on Market share by geography 2025-2030 (%)

12.2 Geographic comparison

Chart on Geographic comparison
Data Table on Geographic comparison

12.3 APAC - Market size and forecast 2025-2030

Chart on APAC - Market size and forecast 2025-2030 ($ million)
Data Table on APAC - Market size and forecast 2025-2030 ($ million)
Chart on APAC - Year-over-year growth 2025-2030 (%)
Data Table on APAC - Year-over-year growth 2025-2030 (%)
Chart on Regional Comparison - APAC
Data Table on Regional Comparison - APAC

12.3.1 China - Market size and forecast 2025-2030

Chart on China - Market size and forecast 2025-2030 ($ million)
Data Table on China - Market size and forecast 2025-2030 ($ million)
Chart on China - Year-over-year growth 2025-2030 (%)
Data Table on China - Year-over-year growth 2025-2030 (%)

12.3.2 Japan - Market size and forecast 2025-2030

Chart on Japan - Market size and forecast 2025-2030 ($ million)
Data Table on Japan - Market size and forecast 2025-2030 ($ million)
Chart on Japan - Year-over-year growth 2025-2030 (%)
Data Table on Japan - Year-over-year growth 2025-2030 (%)

12.3.3 India - Market size and forecast 2025-2030

Chart on India - Market size and forecast 2025-2030 ($ million)
Data Table on India - Market size and forecast 2025-2030 ($ million)
Chart on India - Year-over-year growth 2025-2030 (%)
Data Table on India - Year-over-year growth 2025-2030 (%)

12.3.4 South Korea - Market size and forecast 2025-2030

Chart on South Korea - Market size and forecast 2025-2030 ($ million)
Data Table on South Korea - Market size and forecast 2025-2030 ($ million)
Chart on South Korea - Year-over-year growth 2025-2030 (%)
Data Table on South Korea - Year-over-year growth 2025-2030 (%)

12.3.5 Australia - Market size and forecast 2025-2030

Chart on Australia - Market size and forecast 2025-2030 ($ million)
Data Table on Australia - Market size and forecast 2025-2030 ($ million)
Chart on Australia - Year-over-year growth 2025-2030 (%)
Data Table on Australia - Year-over-year growth 2025-2030 (%)

12.3.6 Indonesia - Market size and forecast 2025-2030

Chart on Indonesia - Market size and forecast 2025-2030 ($ million)
Data Table on Indonesia - Market size and forecast 2025-2030 ($ million)
Chart on Indonesia - Year-over-year growth 2025-2030 (%)
Data Table on Indonesia - Year-over-year growth 2025-2030 (%)

12.4 Europe - Market size and forecast 2025-2030

Chart on Europe - Market size and forecast 2025-2030 ($ million)
Data Table on Europe - Market size and forecast 2025-2030 ($ million)
Chart on Europe - Year-over-year growth 2025-2030 (%)
Data Table on Europe - Year-over-year growth 2025-2030 (%)
Chart on Regional Comparison - Europe
Data Table on Regional Comparison - Europe

12.4.1 Germany - Market size and forecast 2025-2030

Chart on Germany - Market size and forecast 2025-2030 ($ million)
Data Table on Germany - Market size and forecast 2025-2030 ($ million)
Chart on Germany - Year-over-year growth 2025-2030 (%)
Data Table on Germany - Year-over-year growth 2025-2030 (%)

12.4.2 UK - Market size and forecast 2025-2030

Chart on UK - Market size and forecast 2025-2030 ($ million)
Data Table on UK - Market size and forecast 2025-2030 ($ million)
Chart on UK - Year-over-year growth 2025-2030 (%)
Data Table on UK - Year-over-year growth 2025-2030 (%)

12.4.3 France - Market size and forecast 2025-2030

Chart on France - Market size and forecast 2025-2030 ($ million)
Data Table on France - Market size and forecast 2025-2030 ($ million)
Chart on France - Year-over-year growth 2025-2030 (%)
Data Table on France - Year-over-year growth 2025-2030 (%)

12.4.4 Italy - Market size and forecast 2025-2030

Chart on Italy - Market size and forecast 2025-2030 ($ million)
Data Table on Italy - Market size and forecast 2025-2030 ($ million)
Chart on Italy - Year-over-year growth 2025-2030 (%)
Data Table on Italy - Year-over-year growth 2025-2030 (%)

12.4.5 Spain - Market size and forecast 2025-2030

Chart on Spain - Market size and forecast 2025-2030 ($ million)
Data Table on Spain - Market size and forecast 2025-2030 ($ million)
Chart on Spain - Year-over-year growth 2025-2030 (%)
Data Table on Spain - Year-over-year growth 2025-2030 (%)

12.4.6 The Netherlands - Market size and forecast 2025-2030

Chart on The Netherlands - Market size and forecast 2025-2030 ($ million)
Data Table on The Netherlands - Market size and forecast 2025-2030 ($ million)
Chart on The Netherlands - Year-over-year growth 2025-2030 (%)
Data Table on The Netherlands - Year-over-year growth 2025-2030 (%)

12.5 North America - Market size and forecast 2025-2030

Chart on North America - Market size and forecast 2025-2030 ($ million)
Data Table on North America - Market size and forecast 2025-2030 ($ million)
Chart on North America - Year-over-year growth 2025-2030 (%)
Data Table on North America - Year-over-year growth 2025-2030 (%)
Chart on Regional Comparison - North America
Data Table on Regional Comparison - North America

12.5.1 US - Market size and forecast 2025-2030

Chart on US - Market size and forecast 2025-2030 ($ million)
Data Table on US - Market size and forecast 2025-2030 ($ million)
Chart on US - Year-over-year growth 2025-2030 (%)
Data Table on US - Year-over-year growth 2025-2030 (%)

12.5.2 Canada - Market size and forecast 2025-2030

Chart on Canada - Market size and forecast 2025-2030 ($ million)
Data Table on Canada - Market size and forecast 2025-2030 ($ million)
Chart on Canada - Year-over-year growth 2025-2030 (%)
Data Table on Canada - Year-over-year growth 2025-2030 (%)

12.5.3 Mexico - Market size and forecast 2025-2030

Chart on Mexico - Market size and forecast 2025-2030 ($ million)
Data Table on Mexico - Market size and forecast 2025-2030 ($ million)
Chart on Mexico - Year-over-year growth 2025-2030 (%)
Data Table on Mexico - Year-over-year growth 2025-2030 (%)

12.6 South America - Market size and forecast 2025-2030

Chart on South America - Market size and forecast 2025-2030 ($ million)
Data Table on South America - Market size and forecast 2025-2030 ($ million)
Chart on South America - Year-over-year growth 2025-2030 (%)
Data Table on South America - Year-over-year growth 2025-2030 (%)
Chart on Regional Comparison - South America
Data Table on Regional Comparison - South America

12.6.1 Brazil - Market size and forecast 2025-2030

Chart on Brazil - Market size and forecast 2025-2030 ($ million)
Data Table on Brazil - Market size and forecast 2025-2030 ($ million)
Chart on Brazil - Year-over-year growth 2025-2030 (%)
Data Table on Brazil - Year-over-year growth 2025-2030 (%)

12.6.2 Argentina - Market size and forecast 2025-2030

Chart on Argentina - Market size and forecast 2025-2030 ($ million)
Data Table on Argentina - Market size and forecast 2025-2030 ($ million)
Chart on Argentina - Year-over-year growth 2025-2030 (%)
Data Table on Argentina - Year-over-year growth 2025-2030 (%)

12.6.3 Chile - Market size and forecast 2025-2030

Chart on Chile - Market size and forecast 2025-2030 ($ million)
Data Table on Chile - Market size and forecast 2025-2030 ($ million)
Chart on Chile - Year-over-year growth 2025-2030 (%)
Data Table on Chile - Year-over-year growth 2025-2030 (%)

12.7 Middle East and Africa - Market size and forecast 2025-2030

Chart on Middle East and Africa - Market size and forecast 2025-2030 ($ million)
Data Table on Middle East and Africa - Market size and forecast 2025-2030 ($ million)
Chart on Middle East and Africa - Year-over-year growth 2025-2030 (%)
Data Table on Middle East and Africa - Year-over-year growth 2025-2030 (%)
Chart on Regional Comparison - Middle East and Africa
Data Table on Regional Comparison - Middle East and Africa

12.7.1 Saudi Arabia - Market size and forecast 2025-2030

Chart on Saudi Arabia - Market size and forecast 2025-2030 ($ million)
Data Table on Saudi Arabia - Market size and forecast 2025-2030 ($ million)
Chart on Saudi Arabia - Year-over-year growth 2025-2030 (%)
Data Table on Saudi Arabia - Year-over-year growth 2025-2030 (%)

12.7.2 UAE - Market size and forecast 2025-2030

Chart on UAE - Market size and forecast 2025-2030 ($ million)
Data Table on UAE - Market size and forecast 2025-2030 ($ million)
Chart on UAE - Year-over-year growth 2025-2030 (%)
Data Table on UAE - Year-over-year growth 2025-2030 (%)

12.7.3 South Africa - Market size and forecast 2025-2030

Chart on South Africa - Market size and forecast 2025-2030 ($ million)
Data Table on South Africa - Market size and forecast 2025-2030 ($ million)
Chart on South Africa - Year-over-year growth 2025-2030 (%)
Data Table on South Africa - Year-over-year growth 2025-2030 (%)

12.7.4 Turkey - Market size and forecast 2025-2030

Chart on Turkey - Market size and forecast 2025-2030 ($ million)
Data Table on Turkey - Market size and forecast 2025-2030 ($ million)
Chart on Turkey - Year-over-year growth 2025-2030 (%)
Data Table on Turkey - Year-over-year growth 2025-2030 (%)

12.7.5 Israel - Market size and forecast 2025-2030

Chart on Israel - Market size and forecast 2025-2030 ($ million)
Data Table on Israel - Market size and forecast 2025-2030 ($ million)
Chart on Israel - Year-over-year growth 2025-2030 (%)
Data Table on Israel - Year-over-year growth 2025-2030 (%)

12.8 Market opportunity by geography

Market opportunity by geography ($ million)
Data Tables on Market opportunity by geography ($ million)

13. Drivers, Challenges, and Opportunity

13.1 Market drivers

Growing demand for reduction of post harvest food losses across agricultural value chains
Increasing international trade of fresh fruits and vegetables requiring shelf-life extension
Expanding adoption of high-value horticultural crop production

13.2 Market challenges

High compliance burden associated with maximum residue limits and post harvest treatment regulations
Limited effectiveness of post harvest treatments against evolving pathogen resistance
Storage and cold-chain infrastructure gaps across developing agricultural regions

13.3 Impact of drivers and challenges

Impact of drivers and challenges in 2025 and 2030

13.4 Market opportunities

Increasing adoption of biological and residue-free post harvest treatment solutions
Advancing integration of digital monitoring and smart storage management systems
Growing shift toward integrated treatment programs combining multiple preservation technologies

14. Competitive Landscape

14.1 Overview

14.2

Overview on criticality of inputs and factors of differentiation

14.3 Landscape disruption

Overview on factors of disruption

14.4 Industry risks

Impact of key risks on business

15. Competitive Analysis

15.1 Companies profiled

Companies covered

15.2 Company ranking index

15.3 Market positioning of companies

Matrix on companies position and classification

15.4 AgroFresh Solutions Inc.

AgroFresh Solutions Inc. - Overview
AgroFresh Solutions Inc. - Product / Service
AgroFresh Solutions Inc. - Key offerings
SWOT

15.5 Apeel Technology Inc.

Apeel Technology Inc. - Overview
Apeel Technology Inc. - Product / Service
Apeel Technology Inc. - Key offerings
SWOT

15.6 Bayer AG

Bayer AG - Overview
Bayer AG - Business segments
Bayer AG - Key news
Bayer AG - Key offerings
Bayer AG - Segment focus
SWOT

15.7 Bioconservacion S.A.U.

Bioconservacion S.A.U. - Overview
Bioconservacion S.A.U. - Product / Service
Bioconservacion S.A.U. - Key offerings
SWOT

15.8 China Post Harvest Technology

China Post Harvest Technology - Overview
China Post Harvest Technology - Product / Service
China Post Harvest Technology - Key offerings
SWOT

15.9 Corteva Inc.

Corteva Inc. - Overview
Corteva Inc. - Business segments
Corteva Inc. - Key offerings
Corteva Inc. - Segment focus
SWOT

15.10 Eastman Chemical Co.

Eastman Chemical Co. - Overview
Eastman Chemical Co. - Business segments
Eastman Chemical Co. - Key offerings
Eastman Chemical Co. - Segment focus
SWOT

15.11 Ecoplants Co. Ltd.

Ecoplants Co. Ltd. - Overview
Ecoplants Co. Ltd. - Product / Service
Ecoplants Co. Ltd. - Key offerings
SWOT

15.12 Fomesa Hellas S.A.

Fomesa Hellas S.A. - Overview
Fomesa Hellas S.A. - Product / Service
Fomesa Hellas S.A. - Key offerings
SWOT

15.13 JBT Corp.

JBT Corp. - Overview
JBT Corp. - Product / Service
JBT Corp. - Key offerings
SWOT

15.14 Molecular Products Ltd.

Molecular Products Ltd. - Overview
Molecular Products Ltd. - Product / Service
Molecular Products Ltd. - Key offerings
SWOT

15.15 Nufarm Ltd.

Nufarm Ltd. - Overview
Nufarm Ltd. - Business segments
Nufarm Ltd. - Key offerings
Nufarm Ltd. - Segment focus
SWOT

15.16 Purafil Inc.

Purafil Inc. - Overview
Purafil Inc. - Product / Service
Purafil Inc. - Key offerings
SWOT

15.17 SPM Biosciences Beijing Inc.

SPM Biosciences Beijing Inc. - Overview
SPM Biosciences Beijing Inc. - Product / Service
SPM Biosciences Beijing Inc. - Key offerings
SWOT

15.18 Syngenta AG

Syngenta AG - Overview
Syngenta AG - Product / Service
Syngenta AG - Key offerings
SWOT

16. Appendix

16.1 Scope of the report

Market definition
Objectives
Notes and caveats

16.2 Inclusions and exclusions checklist

Inclusions checklist
Exclusions checklist

16.3 Currency conversion rates for US$

16.4 Research methodology

16.5 Data procurement

Information sources

16.6 Data validation

16.7 Validation techniques employed for market sizing

16.8 Data synthesis

16.9 360 degree market analysis

16.10 List of abbreviations

Research Methodology

Technavio presents a detailed picture of the market by way of study, synthesis, and summation of data from multiple sources. The analysts have presented the various facets of the market with a particular focus on identifying the key industry influencers. The data thus presented is comprehensive, reliable, and the result of extensive research, both primary and secondary.

INFORMATION SOURCES

Primary sources

  • Manufacturers and suppliers
  • Channel partners
  • Industry experts
  • Strategic decision makers

Secondary sources

  • Industry journals and periodicals
  • Government data
  • Financial reports of key industry players
  • Historical data
  • Press releases

DATA ANALYSIS

Data Synthesis

  • Collation of data
  • Estimation of key figures
  • Analysis of derived insights

Data Validation

  • Triangulation with data models
  • Reference against proprietary databases
  • Corroboration with industry experts

REPORT WRITING

Qualitative

  • Market drivers
  • Market challenges
  • Market trends
  • Five forces analysis

Quantitative

  • Market size and forecast
  • Market segmentation
  • Geographical insights
  • Competitive landscape

Interested in this report?

Get your sample now to see our research methodology and insights!

Download Now

Frequently Asked Questions

Post Harvest Treatment market growth will increase by USD 1727.9 million during 2026-2030.

The Post Harvest Treatment market is expected to grow at a CAGR of 9% during 2026-2030.

Post Harvest Treatment market is segmented by Application (Fruits, Vegetables) Product type (Coating, Ethylene blockers, Fungicides, Cleaners, Others) Source (Synthetic, Natural)

AgroFresh Solutions Inc., Akorn Technology, Apeel Technology Inc., Bayer AG, Bioconservacion S.A.U., China Post Harvest Technology, Corteva Inc., Eastman Chemical Co., Ecoplants Co. Ltd., Fomesa Hellas S.A., hazel technologies, JBT Corp., Molecular Products Ltd., NatureSeal Inc., Nufarm Ltd., Productos Citrosol SA, Purafil Inc., SPM Biosciences Beijing Inc., Syngenta AG, Valent U.S.A. LLC are a few of the key vendors in the Post Harvest Treatment market.

APAC will register the highest growth rate of 54.8% among the other regions. Therefore, the Post Harvest Treatment market in APAC is expected to garner significant business opportunities for the vendors during the forecast period.

China, Japan, India, South Korea, Australia, Indonesia, Germany, UK, France, Italy, Spain, The Netherlands, US, Canada, Mexico, Brazil, Argentina, Chile, Saudi Arabia, UAE, South Africa, Turkey, Israel

  • Growing demand for reduction of post harvest food losses across agricultural value chains is the driving factor this market.

The Post Harvest Treatment market vendors should focus on grabbing business opportunities from the Application segment as it accounted for the largest market share in the base year.
RIA - Research AI Assistant
Ask RIA
