
Botanical Extracts Market Size 2026-2030
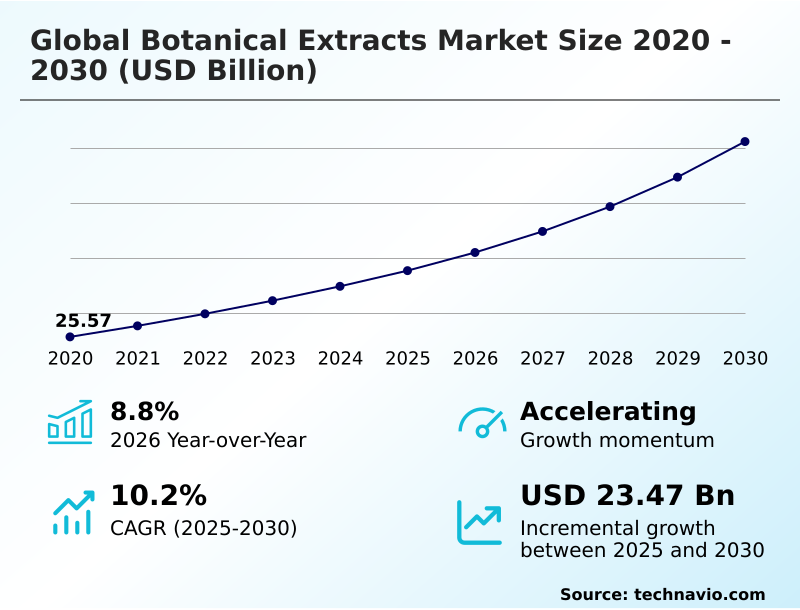
The botanical extracts market size is valued to increase by USD 23.47 billion, at a CAGR of 10.2% from 2025 to 2030. Rising demand for natural ingredients in food, cosmetics, and pharmaceuticals will drive the botanical extracts market.
Major Market Trends & Insights
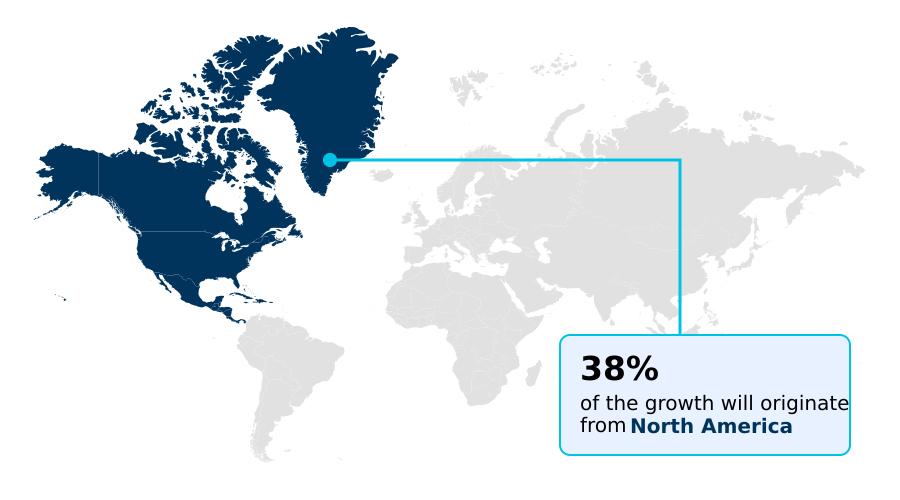
- North America dominated the market and accounted for a 37.6% growth during the forecast period.
- By Application - Food and beverages segment was valued at USD 16.67 billion in 2024
- By Type - Powder segment accounted for the largest market revenue share in 2024
Market Size & Forecast
- Market Opportunities: USD 35.51 billion
- Market Future Opportunities: USD 23.47 billion
- CAGR from 2025 to 2030 : 10.2%
Market Summary
- The botanical extracts market is characterized by a strong consumer-led shift toward natural, clean-label products across the food, pharmaceutical, and cosmetic industries. This demand is fundamentally driven by increasing health consciousness and a growing preference for transparency in ingredient sourcing. Consequently, manufacturers are reformulating products to replace synthetic additives with plant-derived alternatives.
- For instance, a global consumer packaged goods company might transition its entire beverage line to use botanical extracts for flavor and preservation, a complex process involving sourcing high-purity raw materials, validating extraction methods for consistent potency, and ensuring compliance with disparate international food safety regulations. This scenario highlights the operational and strategic recalibration required to compete.
- The industry's trajectory is also shaped by technological advancements in extraction that enhance the purity and bioavailability of active compounds. However, challenges such as raw material price volatility and fragmented regulatory landscapes persist, requiring companies to build resilient and agile supply chains to maintain market position.
What will be the Size of the Botanical Extracts Market during the forecast period?
Get Key Insights on Market Forecast (PDF) Get Free Sample
How is the Botanical Extracts Market Segmented?
The botanical extracts industry research report provides comprehensive data (region-wise segment analysis), with forecasts and estimates in "USD million" for the period 2026-2030, as well as historical data from 2020-2024 for the following segments.
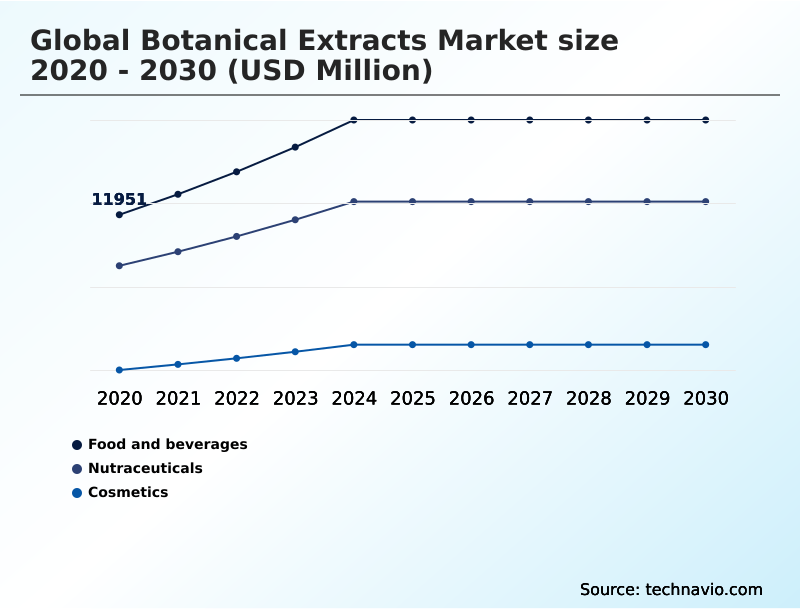
- Application
- Food and beverages
- Nutraceuticals
- Cosmetics
- Type
- Powder
- Liquid
- Distribution channel
- Direct sales
- Distributors
- Online retail
- Geography
- North America
- US
- Canada
- Mexico
- Europe
- Germany
- UK
- France
- APAC
- China
- Japan
- India
- South America
- Brazil
- Argentina
- Colombia
- Middle East and Africa
- Saudi Arabia
- UAE
- South Africa
- Rest of World (ROW)
- North America
By Application Insights
The food and beverages segment is estimated to witness significant growth during the forecast period.
The food and beverages segment reflects a fundamental shift toward natural ingredients, driven by demand for clean label ingredients. Manufacturers utilize plant-based phytonutrients to replace synthetic additives, using standardized extracts as natural preservatives to extend shelf life.
These extracts deliver concentrated bioactive compounds, polyphenols, and essential oils. The market for functional beverages shows significant expansion, with an estimated 60% of urban consumers actively seeking products with targeted health benefits.
Formulations increasingly leverage plant-based flavors to enhance sensory appeal, creating a new generation of functional foods that align with modern wellness trends and consumer preferences for wholesome dietary options.
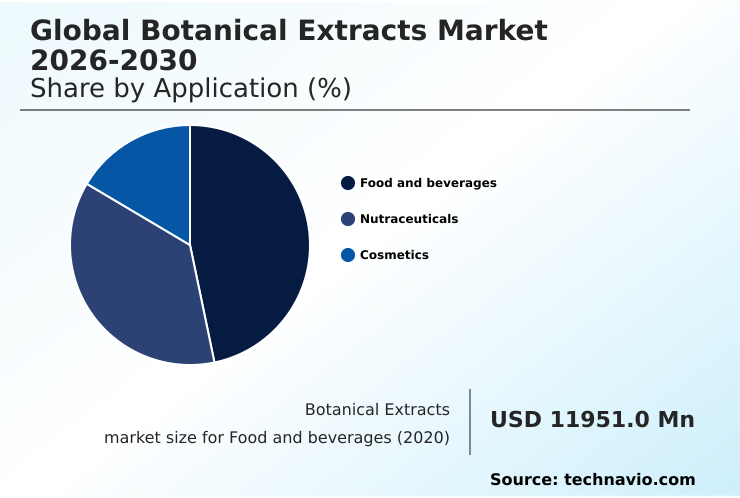
The Food and beverages segment was valued at USD 16.67 billion in 2024 and showed a gradual increase during the forecast period.
Regional Analysis
North America is estimated to contribute 37.6% to the growth of the global market during the forecast period.Technavio’s analysts have elaborately explained the regional trends and drivers that shape the market during the forecast period.
See How Botanical Extracts Market Demand is Rising in North America Get Free Sample
The market's geographic landscape is diverse, with North America poised to contribute over 37% of the total growth. This region leverages advanced technology, including ultrasound assisted extraction and molecular distillation, to produce high-quality standardized extracts.
European markets, leaders in green chemistry, focus on ingredients for anti-aging compounds and skin brightening agents. In APAC, traditional medicine drives demand for alkaloids used as cognitive enhancers and metabolic support ingredients.
Across all regions, the adoption of advanced techniques has been shown to improve extraction efficiency by up to 30%, while demand for functional ingredients like natural colorants continues to expand, reshaping regional production priorities and trade flows.
Market Dynamics
Our researchers analyzed the data with 2025 as the base year, along with the key drivers, trends, and challenges. A holistic analysis of drivers will help companies refine their marketing strategies to gain a competitive advantage.
- Strategic focus is increasingly shifting toward specialized applications and advanced processing methodologies. The development of personalized botanical nutrition platforms represents a significant leap, merging consumer data with product formulation. This requires advanced green extraction methods to ensure ingredient purity and potency.
- Companies are focused on improving bioavailability of botanical extracts and understanding the synergistic effects of different botanicals to create more effective products. For skincare formulated with botanical stem cells and other high-value compounds, high precision phytochemical mapping is essential.
- The industry push for using botanical extracts as natural antioxidants and replacing dyes with spice extracts in food applications continues to gain traction. Key to this is the role of adaptogens stress management and the integration of phytochemicals in preventative health. Sourcing remains a critical consideration, with an emphasis on ethically sourced botanical ingredients and sustainable sourcing of botanical ingredients.
- This includes high throughput screening for plants to find novel compounds and repurposing food industry byproducts. However, supply chain resilience is paramount, as disruptions can increase transit times by over 15%, affecting the availability of ingredients needed for managing chronic lifestyle stressors and maintaining standardized potency of active ingredients.
What are the key market drivers leading to the rise in the adoption of Botanical Extracts Industry?
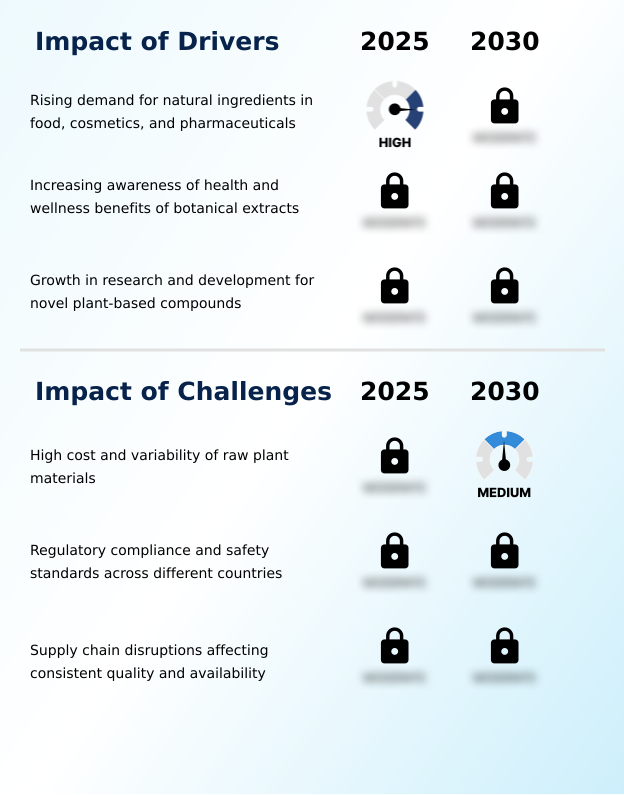
- The primary market driver is the rising demand for natural ingredients across the food, cosmetics, and pharmaceutical sectors.
- Rising consumer awareness of health benefits is a primary market driver. Modern consumers are increasingly informed about the physiological impacts of phytochemicals, propelling demand for dietary supplements and nutraceutical ingredients targeting specific wellness goals like stress reduction botanicals.
- This trend sees traditional herbal remedies and the principles of phytotherapy validated by contemporary science, making herbal ingredients a mainstream choice. The focus is on standardized active ingredients, with techniques like phytochemical mapping ensuring the potency of immunity boosting substances.
- Consequently, the nutraceuticals segment has outpaced cosmetics in year-over-year growth, highlighting the market’s shift toward proactive health management strategies that bridge the gap between nutrition and medicine.
What are the market trends shaping the Botanical Extracts Industry?
- A prominent market trend is the rising adoption of organic and sustainably sourced botanical extracts, driven by consumer demand for environmental responsibility.
- Key market trends are centered on advanced technology and sustainable sourcing. There is a profound shift toward organic certified extracts, reflecting consumer prioritization of ethical harvesting and regenerative agriculture. Advanced green extraction methods, including supercritical CO2 extraction, are becoming industry standard, improving efficiency by up to 30%. In personal care, plant stem cells are used as high-performance cosmetic actives.
- The demand for personalized nutrition is driving innovation in functional products, where ingredients like adaptogens are used. Techniques such as nanoencapsulation are also being employed to improve the stability and bioavailability of these potent botanical substances, meeting evolving consumer needs for targeted and effective wellness solutions.
What challenges does the Botanical Extracts Industry face during its growth?
- A key challenge affecting industry growth is the high cost and inherent variability of raw plant materials.
- Navigating supply chain complexities and regulatory hurdles presents significant challenges. High costs and variability of raw materials, which are often processed via solvent extraction or steam distillation, require robust quality control standards. Geopolitical instability can disrupt traceable supply chains, with recent events causing a 15% increase in transit times for key botanicals.
- This impacts the availability of materials processed through methods like cold pressing, spray drying, and freeze drying. Furthermore, fragmented regulatory compliance frameworks across different countries, particularly around food safety regulations, create administrative burdens. To mitigate these risks, firms are exploring vertical integration and long-term contracts, as well as developing circular economy byproducts to create more resilient sourcing strategies.
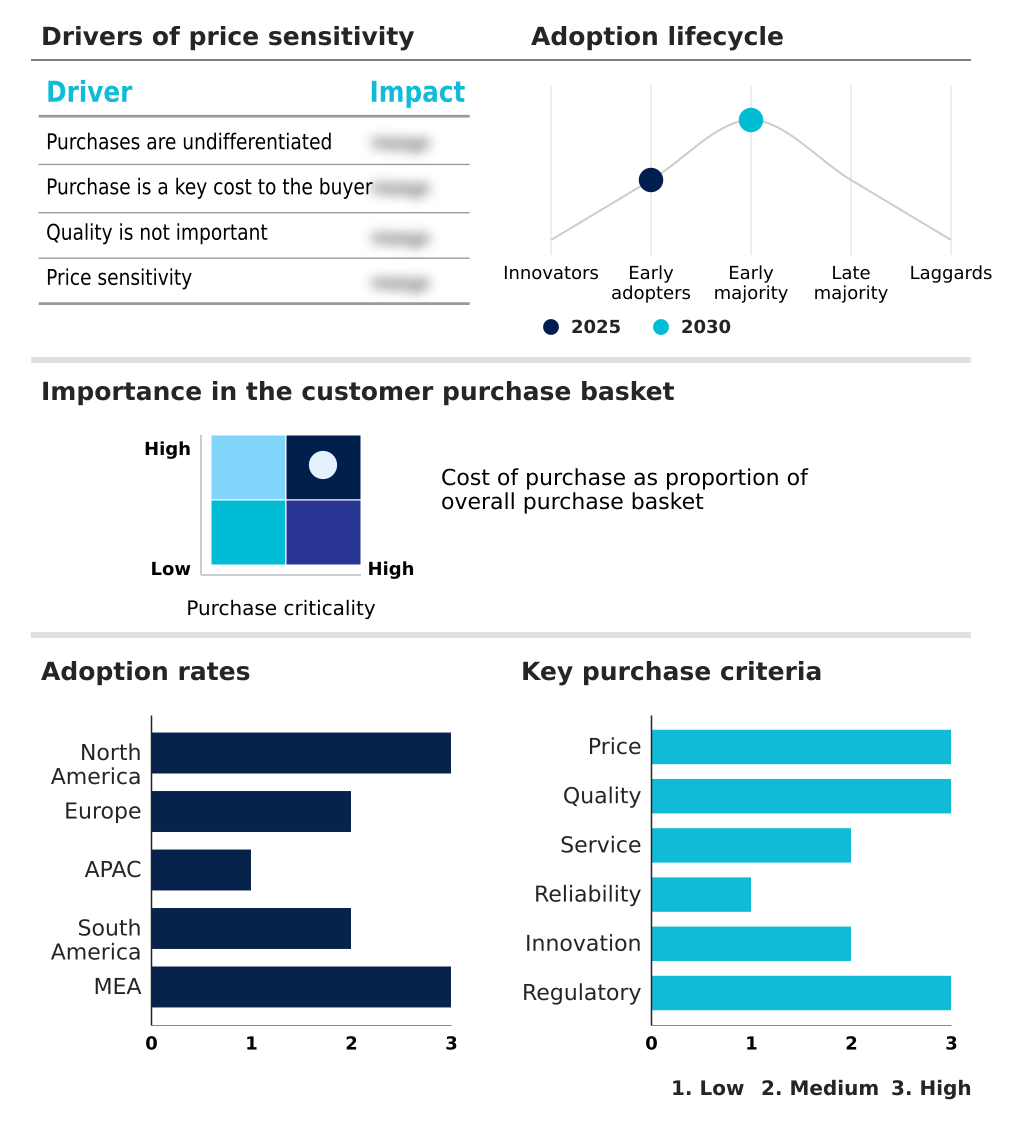
Exclusive Technavio Analysis on Customer Landscape
The botanical extracts market forecasting report includes the adoption lifecycle of the market, covering from the innovator’s stage to the laggard’s stage. It focuses on adoption rates in different regions based on penetration. Furthermore, the botanical extracts market report also includes key purchase criteria and drivers of price sensitivity to help companies evaluate and develop their market growth analysis strategies.
Customer Landscape of Botanical Extracts Industry
Competitive Landscape
Companies are implementing various strategies, such as strategic alliances, botanical extracts market forecast, partnerships, mergers and acquisitions, geographical expansion, and product/service launches, to enhance their presence in the industry.
Advanced Bio Extracts - Delivering clinically validated, standardized botanical extracts and nutraceutical ingredients designed to meet the rigorous demands of the health and wellness sector.
The industry research and growth report includes detailed analyses of the competitive landscape of the market and information about key companies, including:
- Advanced Bio Extracts
- All Season Herbs Pvt. Ltd.
- Archer Daniels Midland Co.
- Arjuna Natural Pvt. Ltd.
- Bell Flavors and Fragrances
- Bio Botanica Inc.
- Carrubba Inc.
- Dohler GmbH
- Givaudan SA
- Indesso
- International Flavors Inc.
- Jairamdass Khushiram
- Kalsec Inc.
- Kerry Group Plc
- Martin Bauer Group
- Nexira
- Ransom Naturals Ltd.
- Synergy Flavors Inc.
- Synthite Industries Pvt. Ltd.
Qualitative and quantitative analysis of companies has been conducted to help clients understand the wider business environment as well as the strengths and weaknesses of key industry players. Data is qualitatively analyzed to categorize companies as pure play, category-focused, industry-focused, and diversified; it is quantitatively analyzed to categorize companies as dominant, leading, strong, tentative, and weak.
Recent Development and News in Botanical extracts market
- In May 2025, Givaudan SA opened a state-of-the-art Botanical Innovation Center in Zurich dedicated to the high-throughput screening of rare plant species for the fragrance and nutraceutical industries.
- In April 2025, Nestlé Health Science launched a Personalized Botanical Nutrition Platform that utilizes an AI algorithm to recommend specific botanical extracts based on user activity and sleep data.
- In February 2025, International Flavors Inc. announced a new line of plant-based specialty food ingredients derived from sustainably sourced herbs to enhance texturizing solutions in the food industry.
- In December 2024, Archer Daniels Midland Co. expanded its portfolio with a new range of vanilla and plant-based flavor extracts aimed at the clean-label food and beverage market.
Dive into Technavio’s robust research methodology, blending expert interviews, extensive data synthesis, and validated models for unparalleled Botanical Extracts Market insights. See full methodology.
| Market Scope | |
|---|---|
| Page number | 292 |
| Base year | 2025 |
| Historic period | 2020-2024 |
| Forecast period | 2026-2030 |
| Growth momentum & CAGR | Accelerate at a CAGR of 10.2% |
| Market growth 2026-2030 | USD 23468.3 million |
| Market structure | Fragmented |
| YoY growth 2025-2026(%) | 8.8% |
| Key countries | US, Canada, Mexico, Germany, UK, France, Italy, Spain, The Netherlands, China, Japan, India, South Korea, Australia, Indonesia, Brazil, Argentina, Colombia, Saudi Arabia, UAE, South Africa, Israel and Turkey |
| Competitive landscape | Leading Companies, Market Positioning of Companies, Competitive Strategies, and Industry Risks |
Research Analyst Overview
- The botanical extracts market is undergoing significant technological evolution, driven by the demand for higher purity, potency, and sustainability. Advanced processing methods like supercritical CO2 extraction, ultrasound assisted extraction, and molecular distillation are becoming industry standards, moving beyond traditional solvent extraction and steam distillation.
- This innovation enables the creation of highly standardized extracts rich in specific bioactive compounds, such as polyphenols and alkaloids. The adoption of these technologies has enabled some operators to achieve a 30% reduction in processing time. The focus is now on precision, with techniques like phytochemical mapping and nanoencapsulation ensuring the efficacy of active ingredients.
- This technical sophistication supports the growth of phytotherapy and the principles of green chemistry. From cold pressing delicate essential oils to using spray drying and freeze drying for stable powders, every step is optimized.
- The market is also seeing a rise in organic certified extracts, plant stem cells, and adaptogens, which are key herbal ingredients in functional foods and nutraceuticals containing plant-based phytonutrients.
What are the Key Data Covered in this Botanical Extracts Market Research and Growth Report?
-
What is the expected growth of the Botanical Extracts Market between 2026 and 2030?
-
USD 23.47 billion, at a CAGR of 10.2%
-
-
What segmentation does the market report cover?
-
The report is segmented by Application (Food and beverages, Nutraceuticals, and Cosmetics), Type (Powder, and Liquid), Distribution Channel (Direct sales, Distributors, and Online retail) and Geography (North America, Europe, APAC, South America, Middle East and Africa)
-
-
Which regions are analyzed in the report?
-
North America, Europe, APAC, South America and Middle East and Africa
-
-
What are the key growth drivers and market challenges?
-
Rising demand for natural ingredients in food, cosmetics, and pharmaceuticals, High cost and variability of raw plant materials
-
-
Who are the major players in the Botanical Extracts Market?
-
Advanced Bio Extracts, All Season Herbs Pvt. Ltd., Archer Daniels Midland Co., Arjuna Natural Pvt. Ltd., Bell Flavors and Fragrances, Bio Botanica Inc., Carrubba Inc., Dohler GmbH, Givaudan SA, Indesso, International Flavors Inc., Jairamdass Khushiram, Kalsec Inc., Kerry Group Plc, Martin Bauer Group, Nexira, Ransom Naturals Ltd., Synergy Flavors Inc. and Synthite Industries Pvt. Ltd.
-
Market Research Insights
- The market is shaped by a dynamic interplay of consumer demand and supply chain realities. An estimated 60% of urban consumers now actively seek out functional foods and dietary supplements containing botanical extracts, driving the need for sophisticated nutraceutical ingredients and personalized nutrition solutions.
- This trend has spurred investment in advanced extraction technologies, which can improve the efficiency of obtaining cosmetic actives by up to 30%. However, this momentum is tempered by logistical hurdles; disruptions in traceable supply chains have recently led to a 15% increase in transit times for key raw materials.
- This volatility challenges firms to balance the pursuit of sustainable sourcing and ethical harvesting with the need for consistent quality control standards and predictable delivery schedules, impacting overall operational strategy.
We can help! Our analysts can customize this botanical extracts market research report to meet your requirements.
 RIA -
RIA - 
