Potash Market Analysis APAC, North America, Europe, South America, Middle East and Africa - US, China, India, Lao Peoples Democratic Republic, Japan, Canada, Russia, South Korea, Germany, Brazil - Size and Forecast 2025-2029

Potash Market Analysis APAC, North America, Europe, South America, Middle East and Africa - US, China, India, Lao Peoples Democratic Republic, Japan, Canada, Russia, South Korea, Germany, Brazil - Size and Forecast 2025-2029

Published: Jan 2025 204 Pages SKU: IRTNTR72843

Market Overview at a Glance

$16.82 B
Market Opportunity
4.9%
CAGR
4.7
YoY growth 2024-2025(%)

Potash Market Size 2025-2029

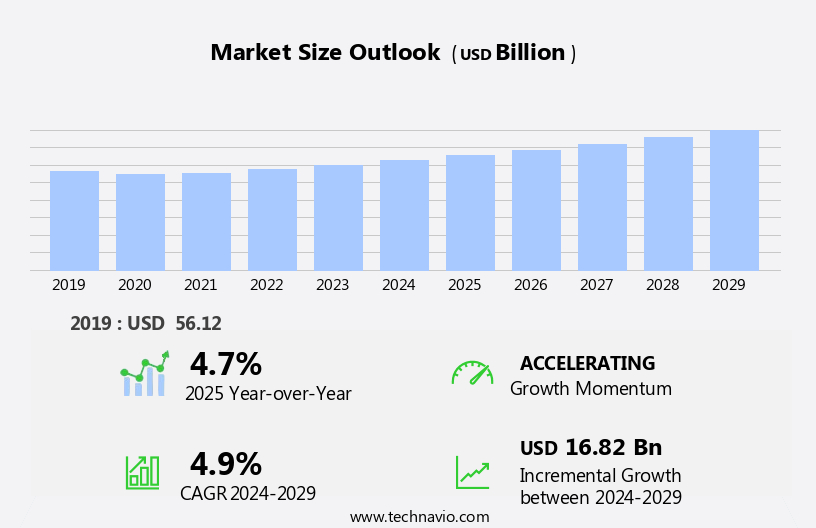
The potash market size is forecast to increase by USD 16.82 billion, at a CAGR of 4.9% between 2024 and 2029.

  • The market is experiencing significant growth due to the increasing demand for fertilizers, driven by the expanding agricultural sector, particularly in developing countries. Simultaneously, global potash production capacity is expanding to meet this rising demand. However, the market faces a notable challenge with the high price of SOP (Sulfate of Potash) fertilizers, which may hinder the affordability and accessibility for some farmers. This dynamic market landscape requires strategic planning for companies seeking to capitalize on the growing demand while navigating the challenges posed by the high SOP prices.
  • Effective cost management, innovation, and strategic partnerships will be crucial for market success. Companies that can address these challenges and meet the growing demand for potash fertilizers will have a competitive edge in this expanding market.

What will be the Size of the Potash Market during the forecast period?

Potash Market Size

Explore in-depth regional segment analysis with market size data - historical 2019-2023 and forecasts 2025-2029 - in the full report.  
Request Free Sample

The market continues to evolve, driven by the dynamic interplay of various sectors and market activities. Crop nutrition remains a primary application, with potash fertilizers playing a crucial role in yield enhancement and soil fertility management. Precision farming and nutrient management strategies have gained prominence, leading to increased demand for granular fertilizers and sulphate of potash. Bulk storage and blending are essential components of the supply chain, ensuring energy efficiency and water usage in the production process. Mining safety and environmental regulations are paramount in potash mining operations, with ongoing efforts to improve mining techniques and reduce the carbon footprint.

Muriate of potash and other potassium-based fertilizers are in high demand, with export markets playing a significant role in price fluctuations. Commodity trading and futures markets help mitigate price volatility, providing stability for farmers and fertilizer distributors. The ongoing evolution of mining techniques and ore processing methods contributes to the continuous improvement of particle size and moisture content in potash products. Quality control and analytical testing are essential to ensure the physical properties and chemical analysis of potash fertilizers meet sustainability standards. Fertilizer application techniques continue to advance, with a focus on optimizing agricultural productivity and reducing waste.

Liquid fertilizers and potassium chloride are gaining popularity due to their ease of application and nutrient efficiency. Waste management and environmental considerations are increasingly important in the production and distribution of potash fertilizers. In summary, the market is characterized by continuous evolution, with various sectors and market activities shaping its dynamics. From crop nutrition and mining operations to supply chain management and commodity trading, the potash industry remains a vital component of sustainable agriculture and global food production.

How is this Potash Industry segmented?

The potash industry research report provides comprehensive data (region-wise segment analysis), with forecasts and estimates in "USD billion" for the period 2025-2029, as well as historical data from 2019-2023 for the following segments.

  • End-user
    • Fertilizers
    • General industrial
    • Others
  • Product
    • Muriate of potash
    • Sulfate of potash
    • Potassium nitrate
    • Others
  • Geography
    • North America
      • US
      • Canada
    • Europe
      • Germany
      • Russia
    • APAC
      • China
      • India
      • Japan
      • South Korea
    • South America
      • Brazil
    • Rest of World (ROW)

    By End-user Insights

    The fertilizers segment is estimated to witness significant growth during the forecast period.

    The market is primarily driven by the agricultural sector, where potash is extensively used as a fertilizer. This trend is anticipated to continue due to the numerous benefits potash provides to plants. Potash enhances crop nutrition by promoting proper plant maturation, improving root strength, increasing resistance to diseases, and boosting yield rates. Additionally, it contributes to enhancing the color, texture, taste, and overall quality of produce. Potash, a group of minerals containing potassium, is essential for various plant processes, including photosynthesis, water and nutrient uptake, and overall crop quality. The mining and processing of potash involve various techniques, such as extraction, bulk storage, and analytical testing, to ensure energy efficiency and water usage.

    Wholesale markets, bulk blending, and fertilizer distribution channels facilitate the availability of potash fertilizers to farmers and retailers. Mining operations adhere to sustainability standards, focusing on nutrient management, land reclamation, and mining safety. The futures market plays a crucial role in managing price volatility, enabling farmers to hedge against potential market fluctuations. Potash comes in various forms, including sulphate of potash, muriate of potash, granular fertilizers, and liquid fertilizers, catering to diverse agricultural requirements. The physical properties of potash, such as particle size and moisture content, influence its application methods and efficiency. Environmental regulations govern the ore processing, waste management, and chemical analysis to minimize the carbon footprint and promote sustainable agriculture.

    Potash Market Size

    Request Free Sample

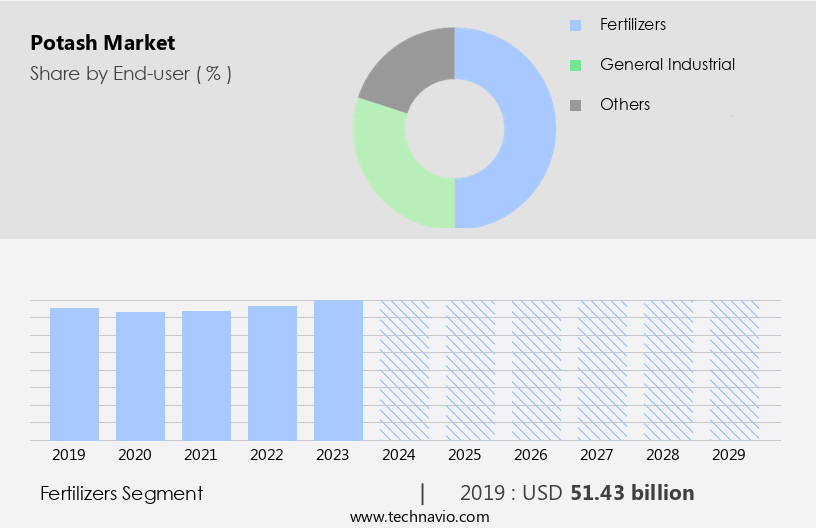
    The Fertilizers segment was valued at USD 51.43 billion in 2019 and showed a gradual increase during the forecast period.
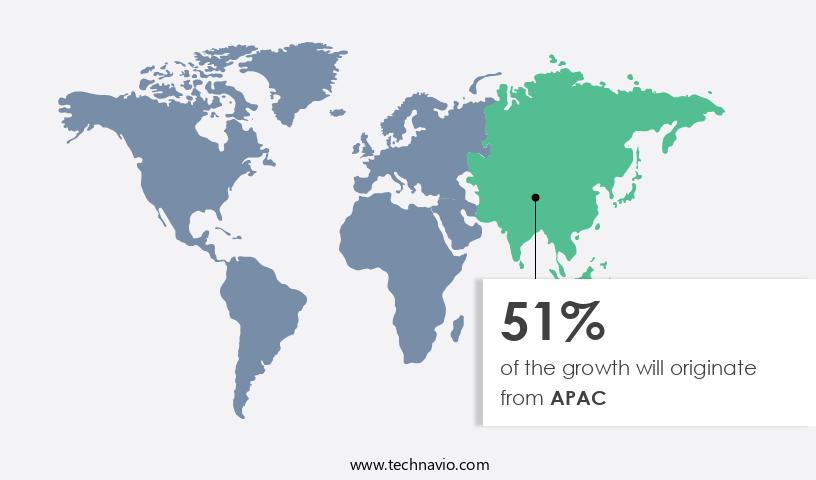
    Regional Analysis

    APAC is estimated to contribute 51% to the growth of the global market during the forecast period.Technavio’s analysts have elaborately explained the regional trends and drivers that shape the market during the forecast period.

    Potash Market Share by Geography

     Request Free Sample

    The market is characterized by the integration of various entities, including supply chain management, bulk storage, analytical testing, extraction techniques, wholesale markets, bulk blending, energy efficiency, water usage, potash fertilizers, yield enhancement, land reclamation, sustainability standards, nutrient management, fertilizer distribution, retail sales, quality control, potash mining, mining operations, futures market, moisture content, market fluctuations, crop nutrition, precision farming, commodity trading, muriate of potash, export markets, granular fertilizers, soil fertility, mining safety, price volatility, fertilizer application, agricultural productivity, potassium sulphate, particle size, ore processing, environmental regulations, liquid fertilizers, physical properties, waste management, and chemical analysis. During the forecast period, the Asia Pacific (APAC) region is anticipated to dominate the market due to the significant consumption of potash fertilizers in the agriculture sector.

    The population growth and increasing per capita income in APAC have led to a rise in the demand for food products, thereby driving the consumption of potash. Moreover, the depletion of arable lands due to urbanization and industrialization has necessitated the use of fertilizers to enhance crop yields. Countries like India and China are expected to be the major contributors to the demand for potash in APAC. The market is also influenced by factors such as energy efficiency and water usage in the mining and production processes. Companies are focusing on implementing sustainable practices to reduce their carbon footprint and adhere to environmental regulations.

    Additionally, the development of advanced extraction techniques and the use of liquid and granular fertilizers have improved the efficiency of potash application in agriculture. Furthermore, the futures market plays a crucial role in managing price volatility and ensuring a stable supply of potash to the market. Mining safety and ore processing techniques have also evolved to minimize waste and optimize the use of resources. Overall, the market is expected to continue its growth trajectory, driven by the increasing demand for fertilizers in the agriculture sector and the adoption of sustainable practices in mining and production.

    Market Dynamics

    Our researchers analyzed the data with 2024 as the base year, along with the key drivers, trends, and challenges. A holistic analysis of drivers will help companies refine their marketing strategies to gain a competitive advantage.

    What are the key market drivers leading to the rise in the adoption of Potash Industry?

    • The significant surge in demand for fertilizers serves as the primary catalyst for market growth. 

    • The market is driven by the escalating demand for potassium-based fertilizers due to their crucial role in enhancing crop yields and improving plant health. Potassium is an essential nutrient for plants, and its deficiency can lead to reduced yields, poor crop quality, and increased susceptibility to pests and diseases. The burgeoning agricultural sector, fueled by population growth and the need to increase food production, is a significant factor driving the demand for potash fertilizers. The scarcity of arable land and the rising trend towards sustainable farming practices, including energy efficiency and water usage, further boost the market.
    • In the supply chain, bulk storage, analytical testing, and bulk blending play vital roles in ensuring the quality and consistency of potash products. Extraction techniques and land reclamation are also key considerations for market participants. Overall, the market is expected to experience steady growth due to these market dynamics.

    What are the market trends shaping the Potash Industry?

    • The trend in the global market is toward expanding potash production capacity. It is an essential requirement for professional and knowledgeable industry observers to keep abreast of this development.

    • The market is experiencing a notable expansion, with an estimated production of 39 million metric tons in 2023. This figure is projected to reach 67.6 million metric tons by 2026, fueled by new projects and expansions in countries such as Laos and Russia. The increasing production capacity is a direct response to the growing demand for potash, a vital nutrient for plant growth and a significant component in fertilizers. One of the major manufacturers, Belaruskali, intends to boost its potash fertilizer production capacity to 15.9 million tons by the end of 2025. This expansion is part of a broader industry trend to enhance operational scale and meet the escalating global demand.
    • In the realm of sustainability standards, nutrient management, and quality control, the potash industry is focusing on efficient fertilizer distribution and retail sales. Market dynamics, including moisture content and market fluctuations, continue to impact the market. Despite these challenges, the industry remains committed to ensuring a steady supply of high-quality potash to meet the demands of agriculture and food production.

    What challenges does the Potash Industry face during its growth?

    • The escalating cost of SOP (Sulfate of Potash) fertilizers poses a significant challenge to the industry's growth trajectory. 

    • The market is driven by the demand for crop nutrition in precision farming, as potash is an essential component of granular fertilizers used to improve soil fertility and enhance agricultural productivity. The production of sulfuric acid potash (SOP), a primary type of potash, involves a complex manufacturing process that contributes to its high price. The Mannheim process, a common method for SOP production, is expensive due to the use of potassium chloride as the main raw material, which represents 75% of the overall cost. Manufacturers employing this process cannot sell hydrochloric acid, a byproduct, and must recover production costs through SOP sales.
    • Price volatility is a significant challenge for commodity trading in the market, making it crucial for businesses to closely monitor market trends and optimize fertilizer application to minimize costs and maximize yields. Mining safety regulations also impact the potash industry, requiring manufacturers to prioritize safety measures to ensure a sustainable and efficient supply chain.

    Exclusive Customer Landscape

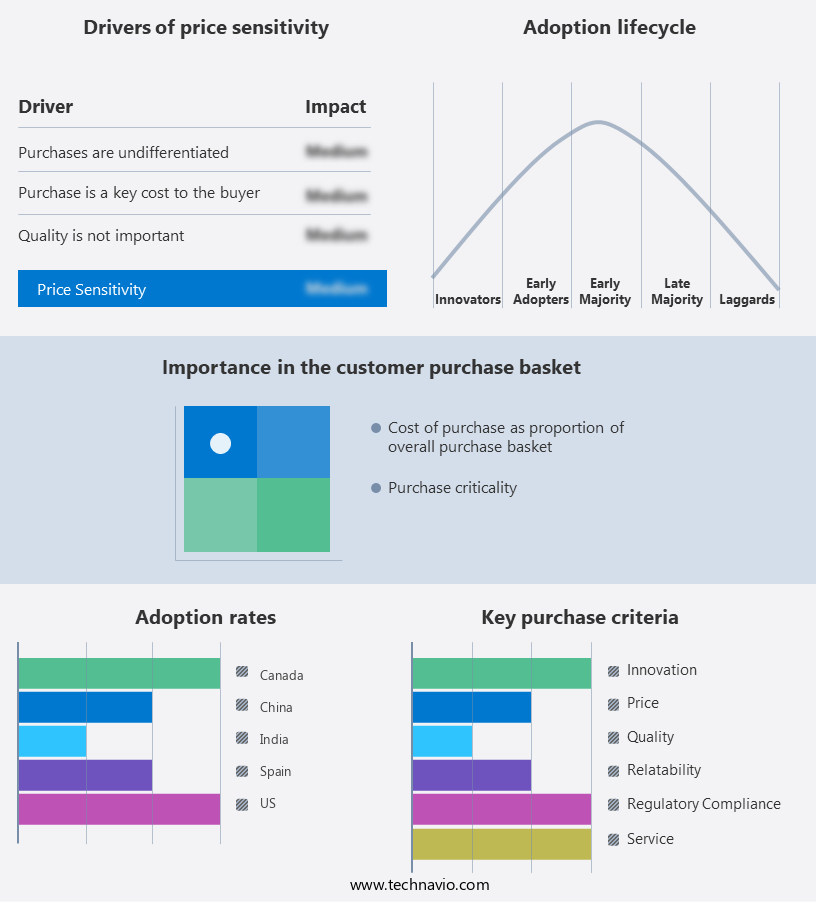
    The potash market forecasting report includes the adoption lifecycle of the market, covering from the innovator’s stage to the laggard’s stage. It focuses on adoption rates in different regions based on penetration. Furthermore, the potash market report also includes key purchase criteria and drivers of price sensitivity to help companies evaluate and develop their market growth analysis strategies.

    Potash Market Share by Geography

     Customer Landscape

    Key Companies & Market Insights

    Companies are implementing various strategies, such as strategic alliances, potash market forecast, partnerships, mergers and acquisitions, geographical expansion, and product/service launches, to enhance their presence in the industry.

    Agrimin Ltd. - The company specializes in providing a range of potash products to meet diverse agricultural needs. Our offerings include Sulphate of Potash in standard, granular, and soluble forms. These potassium-rich products enhance soil fertility, promote plant growth, and contribute to increased crop yields. Our commitment to innovation and quality ensures that our customers receive superior solutions for their agricultural requirements.

    The industry research and growth report includes detailed analyses of the competitive landscape of the market and information about key companies, including:

    • Agrimin Ltd.
    • Arab Potash Co. Plc
    • Compass Minerals International Inc.
    • EuroChem Group AG
    • Evergrow
    • GUJARAT AKSHA FERTILIZER CO.
    • Haifa Negev technologies Ltd.
    • HELM AG
    • Indian Potash Ltd.
    • Intrepid Potash Inc.
    • Israel Chemicals Ltd.
    • JSC Belarusian Potash Co.
    • Kalium Lakes Ltd.
    • Kiran Chemicals
    • KS Aktiengesellschaft
    • Nutrien Ltd.
    • PJSC Uralkali
    • Tessenderlo Group NV
    • The Mosaic Co.
    • Yara International ASA

    Qualitative and quantitative analysis of companies has been conducted to help clients understand the wider business environment as well as the strengths and weaknesses of key industry players. Data is qualitatively analyzed to categorize companies as pure play, category-focused, industry-focused, and diversified; it is quantitatively analyzed to categorize companies as dominant, leading, strong, tentative, and weak.

    Recent Development and News in Potash Market

    • In February 2023, Nutrien, the world's largest potash producer, announced a strategic partnership with Yara International to collaborate on the development and production of low-carbon ammonia and potash in Saskatchewan, Canada (Nutrien press release). This collaboration aims to reduce greenhouse gas emissions and strengthen their market position in the sustainable agriculture sector.
    • In July 2024, Saskatchewan's PotashCorp and BHP Group's Jansen potash project received a significant investment of USD4.5 billion from the Canadian and Saskatchewan governments, marking the largest single investment in the province's history (Government of Saskatchewan press release). This investment will contribute to the expansion of the Jansen mine, increasing Canada's potash production capacity and securing its position as a leading global supplier.
    • In October 2024, Israeli company ICL Fertilizers launched a new potassium chloride product, K-Max Granular, designed for high-efficiency and low-emission applications (ICL press release). This innovative product offers farmers improved crop yields and reduced environmental impact, making it a significant advancement in the potash industry.
    • In March 2025, the Indian government announced a policy initiative to encourage domestic potash production and reduce reliance on imports (Ministry of Chemicals and Fertilizers press release). This policy includes incentives for new potash projects and investments in research and development, potentially leading to increased market competition and growth opportunities for domestic producers.

    Research Analyst Overview

    • The market is experiencing significant activity and trends, driven by the agricultural sector's increasing focus on sustainability and resource efficiency. Community engagement and environmental impact assessments are crucial components of corporate social responsibility, shaping mining practices to minimize environmental footprints. Life cycle analysis, precision nutrient placement, and variable rate application are key agricultural technologies, reducing fertilizer use and enhancing crop quality. Nitrogen fertilizers, phosphate fertilizers, organic fertilizers, and mixed fertilizers are all under scrutiny for their environmental impact. The adoption of precision agriculture, crop rotation, and soil testing is gaining momentum, promoting sustainable farming practices. Green chemistry, water conservation, and bio-based products are integral to the circular economy, optimizing fertilizer application and improving food security.
    • Renewable energy, GIS mapping, data analytics, and carbon sequestration are essential for resource efficiency and crop yield. Sustainable mining practices, root development, plant uptake, and nutrient availability are critical factors in the potash industry's future. Remote sensing and responsible sourcing are also essential, ensuring the industry's long-term viability and meeting global food demand.

    Dive into Technavio’s robust research methodology, blending expert interviews, extensive data synthesis, and validated models for unparalleled Potash Market insights. See full methodology.

    Market Scope

    Report Coverage

    Details

    Page number

    204

    Base year

    2024

    Historic period

    2019-2023

    Forecast period

    2025-2029

    Growth momentum & CAGR

    Accelerate at a CAGR of 4.9%

    Market growth 2025-2029

    USD 16.82 billion

    Market structure

    Fragmented

    YoY growth 2024-2025(%)

    4.7

    Key countries

    US, China, India, Lao Peoples Democratic Republic, Japan, Canada, Russia, South Korea, Germany, and Brazil

    Competitive landscape

    Leading Companies, Market Positioning of Companies, Competitive Strategies, and Industry Risks

    Request Free Sample

    What are the Key Data Covered in this Potash Market Research and Growth Report?

    • CAGR of the Potash industry during the forecast period
    • Detailed information on factors that will drive the growth and forecasting between 2025 and 2029
    • Precise estimation of the size of the market and its contribution of the industry in focus to the parent market
    • Accurate predictions about upcoming growth and trends and changes in consumer behaviour
    • Growth of the market across APAC, North America, Europe, South America, and Middle East and Africa
    • Thorough analysis of the market’s competitive landscape and detailed information about companies
    • Comprehensive analysis of factors that will challenge the potash market growth of industry companies

    We can help! Our analysts can customize this potash market research report to meet your requirements.

    Get in touch


    1 Executive Summary

    • 1.1 Market overview
      • Executive Summary - Chart on Market Overview
      • Executive Summary - Data Table on Market Overview
      • Executive Summary - Chart on Global Market Characteristics
      • Executive Summary - Chart on Market by Geography
      • Executive Summary - Chart on Market Segmentation by End-user
      • Executive Summary - Chart on Market Segmentation by Product
      • Executive Summary - Chart on Incremental Growth
      • Executive Summary - Data Table on Incremental Growth
      • Executive Summary - Chart on Company Market Positioning

    2 Technavio Analysis

    • 2.1 Analysis of price sensitivity, lifecycle, customer purchase basket, adoption rates, and purchase criteria
      • Analysis of price sensitivity, lifecycle, customer purchase basket, adoption rates, and purchase criteria
    • 2.2 Criticality of inputs and Factors of differentiation
      • Overview on criticality of inputs and factors of differentiation
    • 2.3 Factors of disruption
      • Overview on factors of disruption
    • 2.4 Impact of drivers and challenges
      • Impact of drivers and challenges in 2024 and 2029

    3 Market Landscape

    • 3.1 Market ecosystem
      • Parent Market
      • Data Table on - Parent Market
    • 3.2 Market characteristics
      • Market characteristics analysis
    • 3.3 Value chain analysis
      • Value chain analysis

    4 Market Sizing

    • 4.1 Market definition
      • Offerings of companies included in the market definition
    • 4.2 Market segment analysis
      • Market segments
    • 4.3 Market size 2024
      • 4.4 Market outlook: Forecast for 2024-2029
        • Chart on Global - Market size and forecast 2024-2029 ($ million)
        • Data Table on Global - Market size and forecast 2024-2029 ($ million)
        • Chart on Global Market: Year-over-year growth 2024-2029 (%)
        • Data Table on Global Market: Year-over-year growth 2024-2029 (%)

      5 Historic Market Size

      • 5.1 Global Potash Market 2019 - 2023
        • Historic Market Size - Data Table on Global Potash Market 2019 - 2023 ($ million)
      • 5.2 End-user segment analysis 2019 - 2023
        • Historic Market Size - End-user Segment 2019 - 2023 ($ million)
      • 5.3 Product segment analysis 2019 - 2023
        • Historic Market Size - Product Segment 2019 - 2023 ($ million)
      • 5.4 Geography segment analysis 2019 - 2023
        • Historic Market Size - Geography Segment 2019 - 2023 ($ million)
      • 5.5 Country segment analysis 2019 - 2023
        • Historic Market Size - Country Segment 2019 - 2023 ($ million)

      6 Qualitative Analysis

      • 6.1 Impact of AI on Global Potash Market

        7 Five Forces Analysis

        • 7.1 Five forces summary
          • Five forces analysis - Comparison between 2024 and 2029
        • 7.2 Bargaining power of buyers
          • Bargaining power of buyers - Impact of key factors 2024 and 2029
        • 7.3 Bargaining power of suppliers
          • Bargaining power of suppliers - Impact of key factors in 2024 and 2029
        • 7.4 Threat of new entrants
          • Threat of new entrants - Impact of key factors in 2024 and 2029
        • 7.5 Threat of substitutes
          • Threat of substitutes - Impact of key factors in 2024 and 2029
        • 7.6 Threat of rivalry
          • Threat of rivalry - Impact of key factors in 2024 and 2029
        • 7.7 Market condition
          • Chart on Market condition - Five forces 2024 and 2029

        8 Market Segmentation by End-user

        • 8.1 Market segments
          • Chart on End-user - Market share 2024-2029 (%)
          • Data Table on End-user - Market share 2024-2029 (%)
        • 8.2 Comparison by End-user
          • Chart on Comparison by End-user
          • Data Table on Comparison by End-user
        • 8.3 Fertilizers - Market size and forecast 2024-2029
          • Chart on Fertilizers - Market size and forecast 2024-2029 ($ million)
          • Data Table on Fertilizers - Market size and forecast 2024-2029 ($ million)
          • Chart on Fertilizers - Year-over-year growth 2024-2029 (%)
          • Data Table on Fertilizers - Year-over-year growth 2024-2029 (%)
        • 8.4 General industrial - Market size and forecast 2024-2029
          • Chart on General industrial - Market size and forecast 2024-2029 ($ million)
          • Data Table on General industrial - Market size and forecast 2024-2029 ($ million)
          • Chart on General industrial - Year-over-year growth 2024-2029 (%)
          • Data Table on General industrial - Year-over-year growth 2024-2029 (%)
        • 8.5 Others - Market size and forecast 2024-2029
          • Chart on Others - Market size and forecast 2024-2029 ($ million)
          • Data Table on Others - Market size and forecast 2024-2029 ($ million)
          • Chart on Others - Year-over-year growth 2024-2029 (%)
          • Data Table on Others - Year-over-year growth 2024-2029 (%)
        • 8.6 Market opportunity by End-user
          • Market opportunity by End-user ($ million)
          • Data Table on Market opportunity by End-user ($ million)

        9 Market Segmentation by Product

        • 9.1 Market segments
          • Chart on Product - Market share 2024-2029 (%)
          • Data Table on Product - Market share 2024-2029 (%)
        • 9.2 Comparison by Product
          • Chart on Comparison by Product
          • Data Table on Comparison by Product
        • 9.3 Muriate of potash - Market size and forecast 2024-2029
          • Chart on Muriate of potash - Market size and forecast 2024-2029 ($ million)
          • Data Table on Muriate of potash - Market size and forecast 2024-2029 ($ million)
          • Chart on Muriate of potash - Year-over-year growth 2024-2029 (%)
          • Data Table on Muriate of potash - Year-over-year growth 2024-2029 (%)
        • 9.4 Sulfate of potash - Market size and forecast 2024-2029
          • Chart on Sulfate of potash - Market size and forecast 2024-2029 ($ million)
          • Data Table on Sulfate of potash - Market size and forecast 2024-2029 ($ million)
          • Chart on Sulfate of potash - Year-over-year growth 2024-2029 (%)
          • Data Table on Sulfate of potash - Year-over-year growth 2024-2029 (%)
        • 9.5 Potassium nitrate - Market size and forecast 2024-2029
          • Chart on Potassium nitrate - Market size and forecast 2024-2029 ($ million)
          • Data Table on Potassium nitrate - Market size and forecast 2024-2029 ($ million)
          • Chart on Potassium nitrate - Year-over-year growth 2024-2029 (%)
          • Data Table on Potassium nitrate - Year-over-year growth 2024-2029 (%)
        • 9.6 Others - Market size and forecast 2024-2029
          • Chart on Others - Market size and forecast 2024-2029 ($ million)
          • Data Table on Others - Market size and forecast 2024-2029 ($ million)
          • Chart on Others - Year-over-year growth 2024-2029 (%)
          • Data Table on Others - Year-over-year growth 2024-2029 (%)
        • 9.7 Market opportunity by Product
          • Market opportunity by Product ($ million)
          • Data Table on Market opportunity by Product ($ million)

        10 Customer Landscape

        • 10.1 Customer landscape overview
          • Analysis of price sensitivity, lifecycle, customer purchase basket, adoption rates, and purchase criteria

        11 Geographic Landscape

        • 11.1 Geographic segmentation
          • Chart on Market share by geography 2024-2029 (%)
          • Data Table on Market share by geography 2024-2029 (%)
        • 11.2 Geographic comparison
          • Chart on Geographic comparison
          • Data Table on Geographic comparison
        • 11.3 APAC - Market size and forecast 2024-2029
          • Chart on APAC - Market size and forecast 2024-2029 ($ million)
          • Data Table on APAC - Market size and forecast 2024-2029 ($ million)
          • Chart on APAC - Year-over-year growth 2024-2029 (%)
          • Data Table on APAC - Year-over-year growth 2024-2029 (%)
        • 11.4 North America - Market size and forecast 2024-2029
          • Chart on North America - Market size and forecast 2024-2029 ($ million)
          • Data Table on North America - Market size and forecast 2024-2029 ($ million)
          • Chart on North America - Year-over-year growth 2024-2029 (%)
          • Data Table on North America - Year-over-year growth 2024-2029 (%)
        • 11.5 Europe - Market size and forecast 2024-2029
          • Chart on Europe - Market size and forecast 2024-2029 ($ million)
          • Data Table on Europe - Market size and forecast 2024-2029 ($ million)
          • Chart on Europe - Year-over-year growth 2024-2029 (%)
          • Data Table on Europe - Year-over-year growth 2024-2029 (%)
        • 11.6 South America - Market size and forecast 2024-2029
          • Chart on South America - Market size and forecast 2024-2029 ($ million)
          • Data Table on South America - Market size and forecast 2024-2029 ($ million)
          • Chart on South America - Year-over-year growth 2024-2029 (%)
          • Data Table on South America - Year-over-year growth 2024-2029 (%)
        • 11.7 Middle East and Africa - Market size and forecast 2024-2029
          • Chart on Middle East and Africa - Market size and forecast 2024-2029 ($ million)
          • Data Table on Middle East and Africa - Market size and forecast 2024-2029 ($ million)
          • Chart on Middle East and Africa - Year-over-year growth 2024-2029 (%)
          • Data Table on Middle East and Africa - Year-over-year growth 2024-2029 (%)
        • 11.8 US - Market size and forecast 2024-2029
          • Chart on US - Market size and forecast 2024-2029 ($ million)
          • Data Table on US - Market size and forecast 2024-2029 ($ million)
          • Chart on US - Year-over-year growth 2024-2029 (%)
          • Data Table on US - Year-over-year growth 2024-2029 (%)
        • 11.9 China - Market size and forecast 2024-2029
          • Chart on China - Market size and forecast 2024-2029 ($ million)
          • Data Table on China - Market size and forecast 2024-2029 ($ million)
          • Chart on China - Year-over-year growth 2024-2029 (%)
          • Data Table on China - Year-over-year growth 2024-2029 (%)
        • 11.10 India - Market size and forecast 2024-2029
          • Chart on India - Market size and forecast 2024-2029 ($ million)
          • Data Table on India - Market size and forecast 2024-2029 ($ million)
          • Chart on India - Year-over-year growth 2024-2029 (%)
          • Data Table on India - Year-over-year growth 2024-2029 (%)
        • 11.11 Lao Peoples Democratic Republic - Market size and forecast 2024-2029
          • Chart on Lao Peoples Democratic Republic - Market size and forecast 2024-2029 ($ million)
          • Data Table on Lao Peoples Democratic Republic - Market size and forecast 2024-2029 ($ million)
          • Chart on Lao Peoples Democratic Republic - Year-over-year growth 2024-2029 (%)
          • Data Table on Lao Peoples Democratic Republic - Year-over-year growth 2024-2029 (%)
        • 11.12 Japan - Market size and forecast 2024-2029
          • Chart on Japan - Market size and forecast 2024-2029 ($ million)
          • Data Table on Japan - Market size and forecast 2024-2029 ($ million)
          • Chart on Japan - Year-over-year growth 2024-2029 (%)
          • Data Table on Japan - Year-over-year growth 2024-2029 (%)
        • 11.13 Canada - Market size and forecast 2024-2029
          • Chart on Canada - Market size and forecast 2024-2029 ($ million)
          • Data Table on Canada - Market size and forecast 2024-2029 ($ million)
          • Chart on Canada - Year-over-year growth 2024-2029 (%)
          • Data Table on Canada - Year-over-year growth 2024-2029 (%)
        • 11.14 Russia - Market size and forecast 2024-2029
          • Chart on Russia - Market size and forecast 2024-2029 ($ million)
          • Data Table on Russia - Market size and forecast 2024-2029 ($ million)
          • Chart on Russia - Year-over-year growth 2024-2029 (%)
          • Data Table on Russia - Year-over-year growth 2024-2029 (%)
        • 11.15 South Korea - Market size and forecast 2024-2029
          • Chart on South Korea - Market size and forecast 2024-2029 ($ million)
          • Data Table on South Korea - Market size and forecast 2024-2029 ($ million)
          • Chart on South Korea - Year-over-year growth 2024-2029 (%)
          • Data Table on South Korea - Year-over-year growth 2024-2029 (%)
        • 11.16 Brazil - Market size and forecast 2024-2029
          • Chart on Brazil - Market size and forecast 2024-2029 ($ million)
          • Data Table on Brazil - Market size and forecast 2024-2029 ($ million)
          • Chart on Brazil - Year-over-year growth 2024-2029 (%)
          • Data Table on Brazil - Year-over-year growth 2024-2029 (%)
        • 11.17 Germany - Market size and forecast 2024-2029
          • Chart on Germany - Market size and forecast 2024-2029 ($ million)
          • Data Table on Germany - Market size and forecast 2024-2029 ($ million)
          • Chart on Germany - Year-over-year growth 2024-2029 (%)
          • Data Table on Germany - Year-over-year growth 2024-2029 (%)
        • 11.18 Market opportunity by geography
          • Market opportunity by geography ($ million)
          • Data Tables on Market opportunity by geography ($ million)

        12 Drivers, Challenges, and Opportunity/Restraints

        • 12.1 Market drivers
          • 12.2 Market challenges
            • 12.3 Impact of drivers and challenges
              • Impact of drivers and challenges in 2024 and 2029
            • 12.4 Market opportunities/restraints

              13 Competitive Landscape

              • 13.1 Overview
                • 13.2 Competitive Landscape
                  • Overview on criticality of inputs and factors of differentiation
                • 13.3 Landscape disruption
                  • Overview on factors of disruption
                • 13.4 Industry risks
                  • Impact of key risks on business

                14 Competitive Analysis

                • 14.1 Companies profiled
                  • Companies covered
                • 14.2 Company ranking index
                  • Company ranking index
                • 14.3 Market positioning of companies
                  • Matrix on companies position and classification
                • 14.4 Agrimin Ltd.
                  • Agrimin Ltd. - Overview
                  • Agrimin Ltd. - Product / Service
                  • Agrimin Ltd. - Key offerings
                  • SWOT
                • 14.5 Arab Potash Co. Plc
                  • Arab Potash Co. Plc - Overview
                  • Arab Potash Co. Plc - Product / Service
                  • Arab Potash Co. Plc - Key offerings
                  • SWOT
                • 14.6 EuroChem Group AG
                  • EuroChem Group AG - Overview
                  • EuroChem Group AG - Product / Service
                  • EuroChem Group AG - Key offerings
                  • SWOT
                • 14.7 Evergrow
                  • Evergrow - Overview
                  • Evergrow - Product / Service
                  • Evergrow - Key offerings
                  • SWOT
                • 14.8 Haifa Negev technologies Ltd.
                  • Haifa Negev technologies Ltd. - Overview
                  • Haifa Negev technologies Ltd. - Product / Service
                  • Haifa Negev technologies Ltd. - Key offerings
                  • SWOT
                • 14.9 HELM AG
                  • HELM AG - Overview
                  • HELM AG - Product / Service
                  • HELM AG - Key news
                  • HELM AG - Key offerings
                  • SWOT
                • 14.10 Indian Potash Ltd.
                  • Indian Potash Ltd. - Overview
                  • Indian Potash Ltd. - Product / Service
                  • Indian Potash Ltd. - Key offerings
                  • SWOT
                • 14.11 Intrepid Potash Inc.
                  • Intrepid Potash Inc. - Overview
                  • Intrepid Potash Inc. - Product / Service
                  • Intrepid Potash Inc. - Key offerings
                  • SWOT
                • 14.12 Israel Chemicals Ltd.
                  • Israel Chemicals Ltd. - Overview
                  • Israel Chemicals Ltd. - Business segments
                  • Israel Chemicals Ltd. - Key offerings
                  • Israel Chemicals Ltd. - Segment focus
                  • SWOT
                • 14.13 JSC Belarusian Potash Co.
                  • JSC Belarusian Potash Co. - Overview
                  • JSC Belarusian Potash Co. - Product / Service
                  • JSC Belarusian Potash Co. - Key offerings
                  • SWOT
                • 14.14 Kalium Lakes Ltd.
                  • Kalium Lakes Ltd. - Overview
                  • Kalium Lakes Ltd. - Product / Service
                  • Kalium Lakes Ltd. - Key offerings
                  • SWOT
                • 14.15 KS Aktiengesellschaft
                  • KS Aktiengesellschaft - Overview
                  • KS Aktiengesellschaft - Product / Service
                  • KS Aktiengesellschaft - Key offerings
                  • SWOT
                • 14.16 Nutrien Ltd.
                  • Nutrien Ltd. - Overview
                  • Nutrien Ltd. - Business segments
                  • Nutrien Ltd. - Key offerings
                  • Nutrien Ltd. - Segment focus
                  • SWOT
                • 14.17 PJSC Uralkali
                  • PJSC Uralkali - Overview
                  • PJSC Uralkali - Product / Service
                  • PJSC Uralkali - Key offerings
                  • SWOT
                • 14.18 The Mosaic Co.
                  • The Mosaic Co. - Overview
                  • The Mosaic Co. - Business segments
                  • The Mosaic Co. - Key offerings
                  • The Mosaic Co. - Segment focus
                  • SWOT

                15 Appendix

                • 15.1 Scope of the report
                  • 15.2 Inclusions and exclusions checklist
                    • Inclusions checklist
                    • Exclusions checklist
                  • 15.3 Currency conversion rates for US$
                    • Currency conversion rates for US$
                  • 15.4 Research methodology
                    • Research methodology
                  • 15.5 Data procurement
                    • Information sources
                  • 15.6 Data validation
                    • Data validation
                  • 15.7 Validation techniques employed for market sizing
                    • Validation techniques employed for market sizing
                  • 15.8 Data synthesis
                    • Data synthesis
                  • 15.9 360 degree market analysis
                    • 360 degree market analysis
                  • 15.10 List of abbreviations
                    • List of abbreviations

                  Research Methodology

                  Technavio presents a detailed picture of the market by way of study, synthesis, and summation of data from multiple sources. The analysts have presented the various facets of the market with a particular focus on identifying the key industry influencers. The data thus presented is comprehensive, reliable, and the result of extensive research, both primary and secondary.

                  INFORMATION SOURCES

                  Primary sources

                  • Manufacturers and suppliers
                  • Channel partners
                  • Industry experts
                  • Strategic decision makers

                  Secondary sources

                  • Industry journals and periodicals
                  • Government data
                  • Financial reports of key industry players
                  • Historical data
                  • Press releases

                  DATA ANALYSIS

                  Data Synthesis

                  • Collation of data
                  • Estimation of key figures
                  • Analysis of derived insights

                  Data Validation

                  • Triangulation with data models
                  • Reference against proprietary databases
                  • Corroboration with industry experts

                  REPORT WRITING

                  Qualitative

                  • Market drivers
                  • Market challenges
                  • Market trends
                  • Five forces analysis

                  Quantitative

                  • Market size and forecast
                  • Market segmentation
                  • Geographical insights
                  • Competitive landscape

                  Interested in this report?

                  Get your sample now to see our research methodology and insights!

                  Download Now

                  Frequently Asked Questions

                  Potash market growth will increase by $ 16.82 bn during 2025-2029 .

                  The Potash market is expected to grow at a CAGR of 4.9% during 2025-2029 .

                  Potash market is segmented by End-user( Fertilizers, General industrial, Others, Others) Product( Muriate of potash, Sulfate of potash, Potassium nitrate, Others)

                  Agrimin Ltd., Arab Potash Co. Plc, Compass Minerals International Inc., EuroChem Group AG, Evergrow, GUJARAT AKSHA FERTILIZER CO., Haifa Negev technologies Ltd., HELM AG, Indian Potash Ltd., Intrepid Potash Inc., Israel Chemicals Ltd., JSC Belarusian Potash Co., Kalium Lakes Ltd., Kiran Chemicals, KS Aktiengesellschaft, Nutrien Ltd., PJSC Uralkali, Tessenderlo Group NV, The Mosaic Co., Yara International ASA are a few of the key vendors in the Potash market.

                  APAC will register the highest growth rate of 51% among the other regions. Therefore, the Potash market in APAC is expected to garner significant business opportunities for the vendors during the forecast period.

                  US, China, India, Lao Peoples Democratic Republic, Japan, Canada, Russia, South Korea, Germany, Brazil

                  • Growing demand for fertilizersOne of the major drivers for the global potash market is the increasing demand for fertilizers across the globe. Potassium is the driving factor this market.
                  • in the appropriate amount in the soil is the driving factor this market.
                  • is essential for plant health. The deficiency of potassium results in reduced crop yields is the driving factor this market.
                  • poor crop quality and poor utilization of water is the driving factor this market.
                  • and plants become more susceptible to pest and disease damage.The rising number of agricultural activities is attributable to the rapid increase in population is the driving factor this market.
                  • which is expected to increase the consumption of fertilizers during the forecast period. The upswing in population growth has accelerated the demand for food globally. Also is the driving factor this market.
                  • the shrinking availability of arable land due to the increasing rate of urbanization and industrialization has created a growth opportunity for agricultural fertilizers to enhance the yield per hectare. According to the Food and Agriculture Organization (FAO) of the United Nations is the driving factor this market.
                  • the demand for food worldwide is increasing at a considerable rate. These trends are expected to contribute significantly to accelerating the demand for agricultural fertilizers to increase the yield per hectare of the currently cultivated land. Thus is the driving factor this market.
                  • with the growing demand for fertilizers is the driving factor this market.
                  • the global potash market is expected to grow during the forecast period. is the driving factor this market.

                  The Potash market vendors should focus on grabbing business opportunities from the Fertilizers segment as it accounted for the largest market share in the base year.