Hydrochloric Acid Market Size 2026-2030
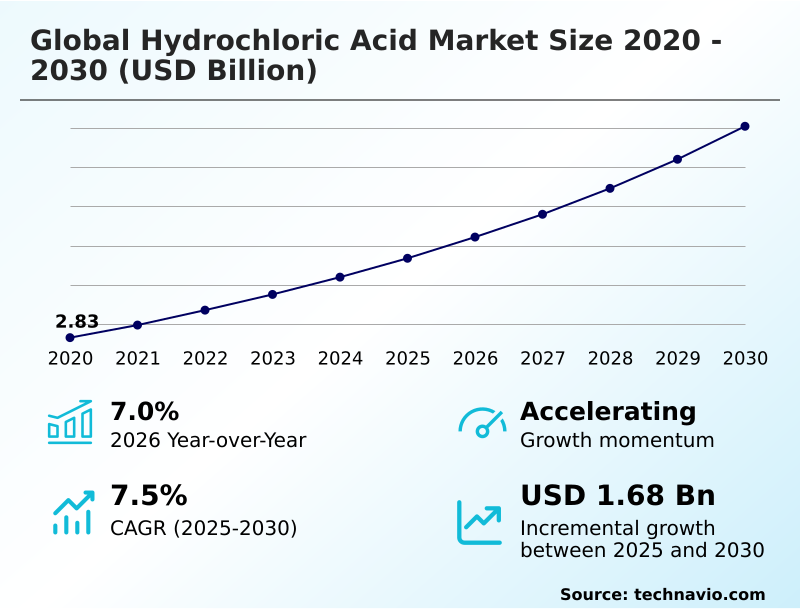
The hydrochloric acid market size is valued to increase by USD 1.68 billion, at a CAGR of 7.5% from 2025 to 2030. Surging demand within global steel pickling and metal processing industry will drive the hydrochloric acid market.
Major Market Trends & Insights
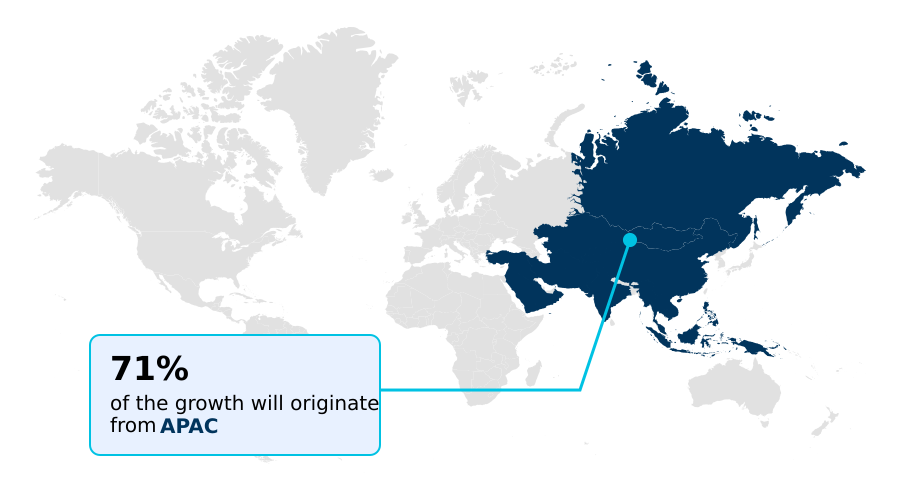
- APAC dominated the market and accounted for a 71.3% growth during the forecast period.
- By End-user - Food segment was valued at USD 1.16 billion in 2024
- By Grade Type - By-product grade segment accounted for the largest market revenue share in 2024
Market Size & Forecast
- Market Opportunities: USD 2.68 billion
- Market Future Opportunities: USD 1.68 billion
- CAGR from 2025 to 2030 : 7.5%
Market Summary
- The hydrochloric acid market functions as a foundational pillar of global industry, where its role as a powerful mineral acid is indispensable. The market's trajectory is heavily influenced by demand from heavy manufacturing sectors, where it is used as a primary steel pickling agent and for metal surface treatment.
- Concurrently, its application in oil well acidizing is crucial for enhancing energy extraction from mature reserves. A key trend shaping the landscape is the rising demand for ultra-high purity semiconductor-grade acid, which necessitates significant investment in advanced purification infrastructure.
- However, producers face the persistent challenge of managing byproduct supply volatility, as availability is often tied to the production cycles of chlorinated hydrocarbon and polyvinyl chloride, creating regional supply-demand imbalances.
- For instance, a chemical intermediate producer might implement a closed-loop recycling system using hcl electrolysis technology to convert surplus by-product hydrochloric acid back into high-purity chlorine, reducing waste disposal costs and creating a more resilient, circular supply chain model that mitigates dependency on the merchant chlorine market.
What will be the Size of the Hydrochloric Acid Market during the forecast period?
Get Key Insights on Market Forecast (PDF) Get Free Sample
How is the Hydrochloric Acid Market Segmented?
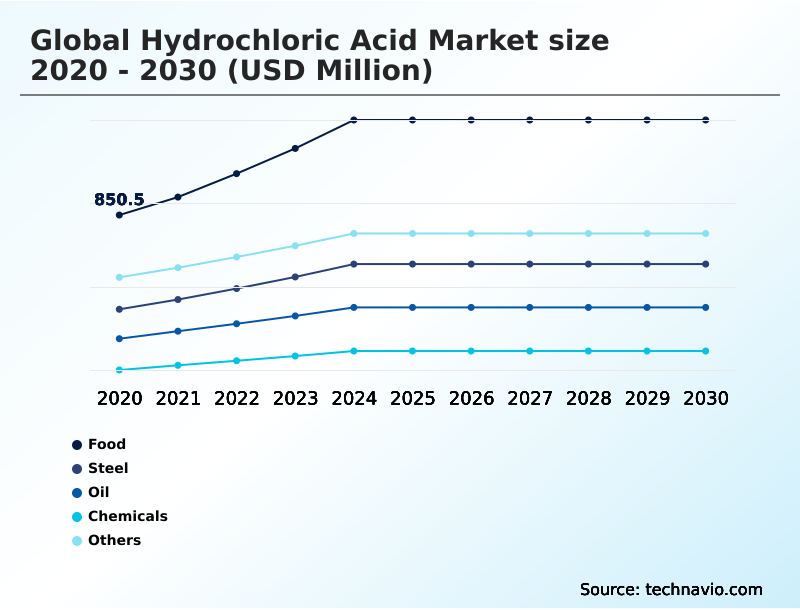
The hydrochloric acid industry research report provides comprehensive data (region-wise segment analysis), with forecasts and estimates in "USD million" for the period 2026-2030, as well as historical data from 2020-2024 for the following segments.
- End-user
- Food
- Steel
- Oil
- Chemicals
- Others
- Grade type
- By-product grade
- Synthetic grade
- Application
- Chemicals and pharmaceuticals
- Food and beverage
- Steel and metal processing
- Water and wastewater treatment
- Others
- Geography
- APAC
- China
- India
- Japan
- North America
- US
- Canada
- Mexico
- Europe
- Germany
- UK
- France
- Middle East and Africa
- Saudi Arabia
- UAE
- South Africa
- South America
- Brazil
- Argentina
- Rest of World (ROW)
- APAC
By End-user Insights
The food segment is estimated to witness significant growth during the forecast period.
The food segment represents a specialized and regulated application for hydrochloric acid, where high-purity grades are essential. In this sector, the chemical functions as a vital food-grade acid additive and processing aid, primarily for precise food processing ph control.
It is critical in the production of ingredients like high-fructose corn syrup and in protein hydrolysis to create flavor enhancers.
The use of this mineral acid is governed by stringent safety standards, necessitating a robust industrial chemical supply chain to prevent contamination.
By effectively inhibiting microbial growth, the application of reagent-grade hcl can improve finished product shelf life by over 15%, ensuring both safety and stability in the expanding processed food sector, where specialized chemical logistics are paramount to operational success.
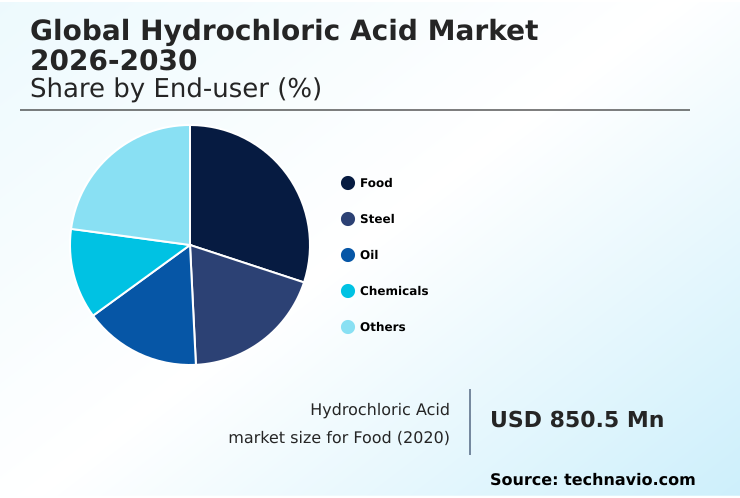
The Food segment was valued at USD 1.16 billion in 2024 and showed a gradual increase during the forecast period.
Regional Analysis
APAC is estimated to contribute 71.3% to the growth of the global market during the forecast period.Technavio’s analysts have elaborately explained the regional trends and drivers that shape the market during the forecast period.
See How Hydrochloric Acid Market Demand is Rising in APAC Get Free Sample
The market's geographic landscape is characterized by a distinct divergence between regions.
APAC, contributing over 71% of the market's incremental growth, is driven by high-volume demand for by-product hydrochloric acid used in steel and chemical manufacturing, particularly in China and India.
In contrast, North America and Europe, with respective market growth rates of 5.8% and 6.6%, are increasingly focused on high-value applications. These mature markets emphasize the production and use of synthetic hydrochloric acid for pharmaceuticals and electronics.
This regional supply-demand imbalance is a key feature, as logistical challenges in corrosive liquid transportation limit inter-regional trade. The need for a stable supply of hydrogen chloride gas and a reliable raw material feedstock underpins operations globally.
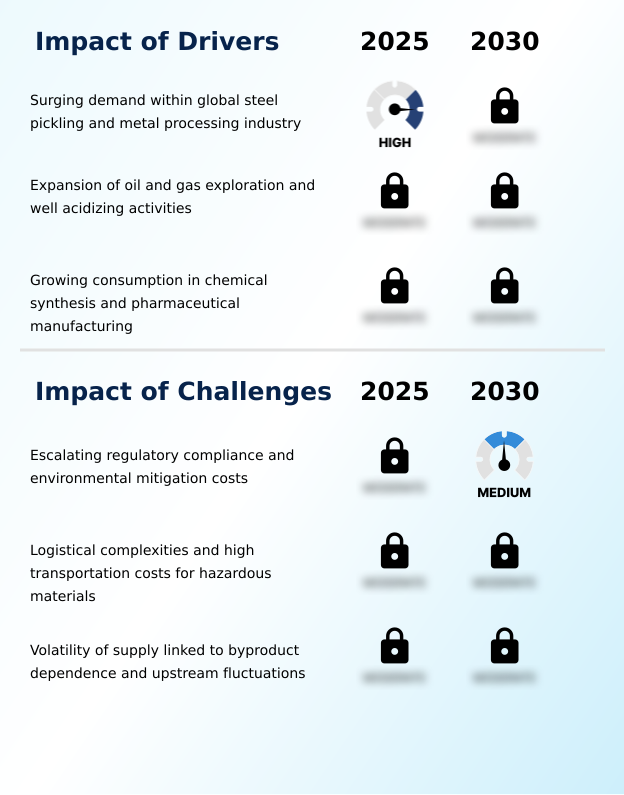
Market Dynamics
Our researchers analyzed the data with 2025 as the base year, along with the key drivers, trends, and challenges. A holistic analysis of drivers will help companies refine their marketing strategies to gain a competitive advantage.
- Strategic decision-making in the hydrochloric acid market requires a nuanced understanding of its multifaceted nature, from analyzing by-product vs synthetic hcl cost structures to managing the complexities of its supply chain. The role of hcl in water treatment and as a chemical catalyst provides stable, non-cyclical demand, balancing the volatility seen in other sectors.
- In heavy industry, optimizing hcl use in metal processing and understanding the benefits of hcl acid regeneration technology are critical for cost control. For example, steel mills that invest in on-site regeneration can see a significant reduction in virgin acid procurement.
- Concurrently, the need for high purity hcl for semiconductors is creating a premium market segment, demanding advanced synthetic hcl production methods and purity standards. This is contrasted with the challenge of managing hcl byproduct from pvc manufacturing, which is governed by strict environmental regulations for acid disposal.
- Across all applications, from hcl in steel pickling process to its use in food manufacturing, reducing hcl transportation and logistics costs remains a primary operational focus.
- Firms that implement robust safe handling protocols for hydrochloric acid and invest in modern hcl neutralization units often report a 20% greater success rate in meeting compliance standards, underscoring the importance of addressing both economic and regulatory pressures.
What are the key market drivers leading to the rise in the adoption of Hydrochloric Acid Industry?
- Surging demand from the global steel pickling and metal processing industry is a key driver for the market's growth.
- Market growth is fundamentally driven by its indispensable role as a heavy manufacturing reagent. In the steel industry, its function as a scale removal agent in pickling lines can increase processing throughput by over 10% compared to alternatives.
- In the energy sector, oilfield stimulation fluid formulations rely on this acid to enhance hydrocarbon recovery, with well acidizing techniques boosting initial output from mature wells by as much as 30%.
- Demand for it as a chemical synthesis catalyst in inorganic chemical synthesis and polyurethane manufacturing remains robust.
- Furthermore, its use as a water treatment coagulant and for ph regulation chemical processes provides a stable, non-cyclical demand base, underscoring its importance across diverse industrial applications from metal surface treatment to food processing ph control.
What are the market trends shaping the Hydrochloric Acid Industry?
- The increasing adoption of advanced hydrochloric acid electrolysis for chlorine recovery is a significant upcoming trend. This shift is reshaping supply dynamics by enabling a circular economy for chemical producers.
- Key market trends are centered on enhancing efficiency and sustainability through technological adoption. The integration of hcl electrolysis technology is gaining traction, with some advanced diaphragm electrolysis systems improving chlorine recovery from spent pickle liquor by over 15%. This creates a more circular supply chain model for this critical chemical intermediate.
- Simultaneously, the push for digitalization in hazardous material logistics is optimizing corrosive liquid transportation. AI-driven platforms have demonstrated an ability to reduce transit-related safety incidents by up to 20%.
- This focus on a closed-loop recycling system for by-product hydrochloric acid, often generated during caustic soda production, addresses both environmental compliance costs and operational efficiency, reflecting a strategic shift in asset portfolio rationalization across the industry.
What challenges does the Hydrochloric Acid Industry face during its growth?
- Escalating regulatory compliance requirements and environmental mitigation costs present a key challenge affecting industry growth.
- The market grapples with significant structural challenges that impact profitability and operational stability. The primary issue is byproduct supply volatility, as the availability of industrial-grade hcl is directly linked to upstream production fluctuations in the chlor-alkali and vinyl sectors, which can cause price swings of up to 25% in a single quarter.
- Additionally, escalating environmental mitigation costs, including investment in advanced fume scrubbing systems and acid neutralization units, can increase operational expenditures by 12% or more for producers. These factors, compounded by the high costs of specialized logistics using fiberglass-reinforced plastic containers, create persistent pressure on supply chain resilience and necessitate sophisticated operational cost management strategies.
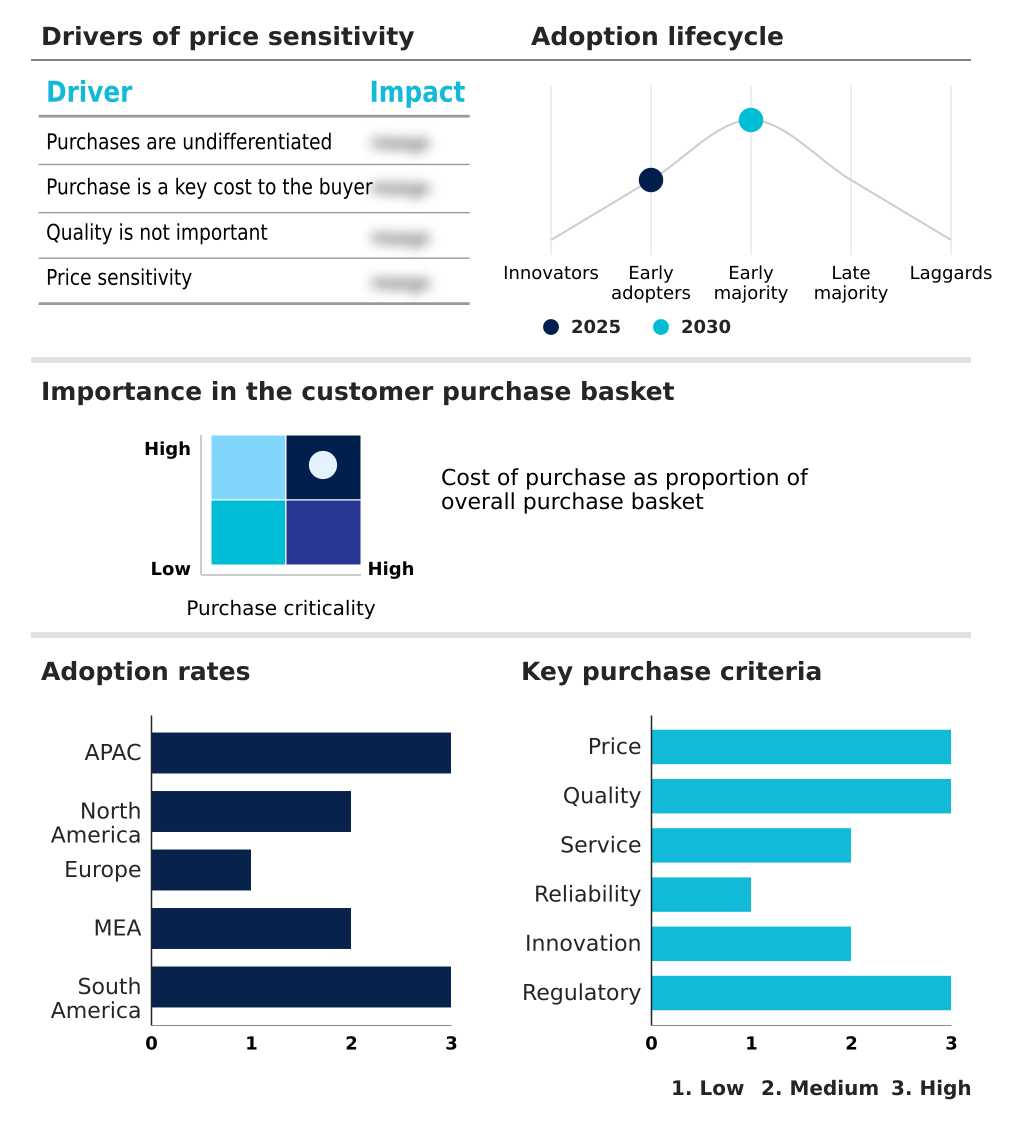
Exclusive Technavio Analysis on Customer Landscape
The hydrochloric acid market forecasting report includes the adoption lifecycle of the market, covering from the innovator’s stage to the laggard’s stage. It focuses on adoption rates in different regions based on penetration. Furthermore, the hydrochloric acid market report also includes key purchase criteria and drivers of price sensitivity to help companies evaluate and develop their market growth analysis strategies.
Customer Landscape of Hydrochloric Acid Industry
Competitive Landscape
Companies are implementing various strategies, such as strategic alliances, hydrochloric acid market forecast, partnerships, mergers and acquisitions, geographical expansion, and product/service launches, to enhance their presence in the industry.
AGC Inc. - Offerings are centered on industrial-grade hydrochloric acid, chlor-alkali chemicals, and specialized additives, addressing a wide range of industrial process requirements and applications.
The industry research and growth report includes detailed analyses of the competitive landscape of the market and information about key companies, including:
- AGC Inc.
- Akzo Nobel NV
- BASF SE
- BRENNTAG SE
- Covestro AG
- DCW Ltd.
- Dow Chemical Co.
- Ercros SA
- Formosa Plastics Corp.
- Grasim Industries Ltd.
- Hanwha Solutions Corp.
- Hawkins Inc.
- Kemira Oyj
- Occidental Petroleum Corp.
- Olin Corp.
- Shin Etsu Chemical Co. Ltd.
- Solvay SA
- Tata Chemicals Ltd.
- Tosoh Corp.
- Westlake Corp.
Qualitative and quantitative analysis of companies has been conducted to help clients understand the wider business environment as well as the strengths and weaknesses of key industry players. Data is qualitatively analyzed to categorize companies as pure play, category-focused, industry-focused, and diversified; it is quantitatively analyzed to categorize companies as dominant, leading, strong, tentative, and weak.
Recent Development and News in Hydrochloric acid market
- In May, 2025, Chlorum Solutions USA entered a definitive agreement to acquire the Eddyville Chlor-Alkali facility from Cargill, a move designed to reinforce its proximity-based business model and enhance the regional availability of hydrochloric acid and other essential derivatives across the Midwest.
- In February, 2025, AGC Vinythai commenced commercial operations at its expanded chlor-alkali plant in Map Ta Phut, Thailand, deploying advanced bipolar ion-exchange membrane technology to significantly boost the output of chlorine derivatives and meet rising manufacturing demand in Southeast Asia.
- In December, 2024, Westlake Corp. revealed plans to cease operations at its diaphragm chlor-alkali plant in Lake Charles, Louisiana, as part of a significant rationalization strategy to streamline its asset portfolio and tighten byproduct availability in the North American supply network.
- In August, 2024, Unipar Carbocloro entered preliminary negotiations for the potential acquisition of certain United States-based chemical assets from Braskem, a strategic maneuver aimed at expanding its operational footprint beyond domestic borders and stabilizing regional pricing dynamics.
Dive into Technavio’s robust research methodology, blending expert interviews, extensive data synthesis, and validated models for unparalleled Hydrochloric Acid Market insights. See full methodology.
| Market Scope | |
|---|---|
| Page number | 318 |
| Base year | 2025 |
| Historic period | 2020-2024 |
| Forecast period | 2026-2030 |
| Growth momentum & CAGR | Accelerate at a CAGR of 7.5% |
| Market growth 2026-2030 | USD 1675.8 million |
| Market structure | Fragmented |
| YoY growth 2025-2026(%) | 7.0% |
| Key countries | China, India, Japan, South Korea, Australia, Indonesia, US, Canada, Mexico, Germany, UK, France, Italy, Russia, The Netherlands, Saudi Arabia, UAE, South Africa, Egypt, Nigeria, Brazil, Argentina and Chile |
| Competitive landscape | Leading Companies, Market Positioning of Companies, Competitive Strategies, and Industry Risks |
Research Analyst Overview
- The hydrochloric acid market operates on a dual-axis of being a high-volume industrial commodity and a high-value specialty chemical. Its primary role as a steel pickling agent and its use in oil well acidizing and wastewater neutralization drive large-scale consumption of industrial-grade hcl. However, a significant trend compelling boardroom-level strategic decisions is the escalating demand for ultra-high purity semiconductor-grade acid.
- This creates a critical inflection point regarding capital expenditure, forcing producers to evaluate the ROI of investing in sophisticated purification technologies against the high margins of the electronics sector. Producers of this specialized aqueous hcl solution can achieve profit margins over 50% higher than those supplying standard grades.
- The supply is predominantly by-product hydrochloric acid from the chlor-alkali process, where it is generated alongside caustic soda production during the synthesis of materials like vinyl chloride monomer and polyurethane manufacturing. Managing the logistics of this mineral acid, a hazardous material requiring specialized rubber-lined steel tanks, remains a core operational challenge tied to its function as a vital chemical intermediate.
What are the Key Data Covered in this Hydrochloric Acid Market Research and Growth Report?
-
What is the expected growth of the Hydrochloric Acid Market between 2026 and 2030?
-
USD 1.68 billion, at a CAGR of 7.5%
-
-
What segmentation does the market report cover?
-
The report is segmented by End-user (Food, Steel, Oil, Chemicals, and Others), Grade Type (By-product grade, and Synthetic grade), Application (Chemicals and pharmaceuticals, Food and beverage, Steel and metal processing, Water and wastewater treatment, and Others) and Geography (APAC, North America, Europe, Middle East and Africa, South America)
-
-
Which regions are analyzed in the report?
-
APAC, North America, Europe, Middle East and Africa and South America
-
-
What are the key growth drivers and market challenges?
-
Surging demand within global steel pickling and metal processing industry, Escalating regulatory compliance and environmental mitigation costs
-
-
Who are the major players in the Hydrochloric Acid Market?
-
AGC Inc., Akzo Nobel NV, BASF SE, BRENNTAG SE, Covestro AG, DCW Ltd., Dow Chemical Co., Ercros SA, Formosa Plastics Corp., Grasim Industries Ltd., Hanwha Solutions Corp., Hawkins Inc., Kemira Oyj, Occidental Petroleum Corp., Olin Corp., Shin Etsu Chemical Co. Ltd., Solvay SA, Tata Chemicals Ltd., Tosoh Corp. and Westlake Corp.
-
Market Research Insights
- Market dynamics are defined by the interplay between byproduct supply from the chlor-alkali process and demand from core industrial sectors. This creates a complex environment where upstream production fluctuations directly impact downstream consumers. The strategic management of captive chemical consumption versus reliance on the merchant market is a key differentiator.
- Advanced purification infrastructure allows producers to serve high-value segments, with some achieving a 40% margin improvement on electronic-grade products over industrial grades. Furthermore, the adoption of digital monitoring for corrosive liquid transportation has been shown to reduce safety incidents by over 25%, enhancing supply chain resilience.
- This focus on operational cost management and industrial safety protocols is critical in navigating the market's inherent volatility.
We can help! Our analysts can customize this hydrochloric acid market research report to meet your requirements.
 RIA -
RIA - 
