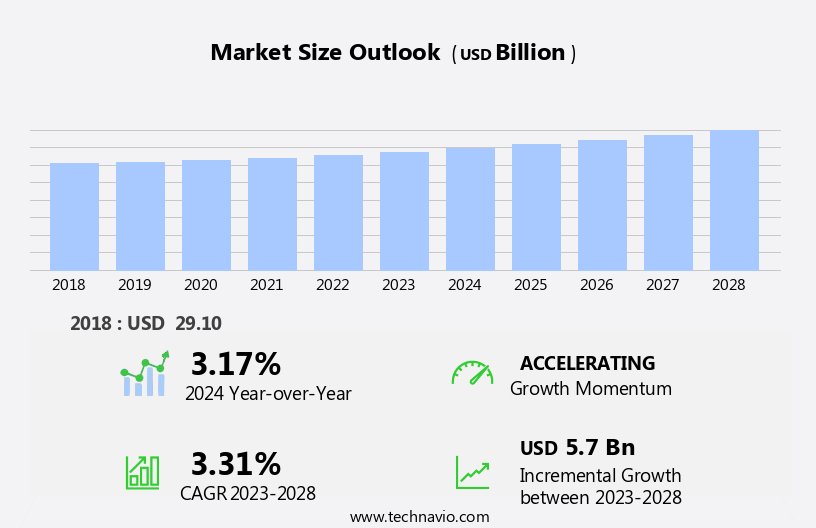
Sulfuric Acid Market Size 2024-2028
The sulfuric acid market size is forecast to increase by USD 5.7 billion, at a CAGR of 3.31% between 2023 and 2028.
- The market is experiencing significant growth, driven primarily by the increasing demand from the electronics industry. This sector's expansion is fueled by the continuous advancements in technology, leading to a higher consumption of sulfuric acid in battery production. Simultaneously, industry players are responding to this demand surge by undertaking capacity expansions and adding new plants. However, the market landscape is not without challenges. Fluctuations in raw material prices pose a significant obstacle, as the cost of sulfur and oil, key inputs in sulfuric acid production, can significantly impact the overall production costs. Companies must navigate these price volatilities to maintain profitability and competitiveness.
- In summary, the market is characterized by robust growth in the electronics sector, capacity expansions, and new plant additions, while grappling with the challenges of raw material price fluctuations. Companies seeking to capitalize on market opportunities and navigate challenges effectively must closely monitor these trends and adapt their strategies accordingly.
What will be the Size of the Sulfuric Acid Market during the forecast period?
Explore in-depth regional segment analysis with market size data - historical 2018-2022 and forecasts 2024-2028 - in the full report.
Request Free Sample
Sulfuric acid, a versatile and essential inorganic compound, continues to play a pivotal role in various industries due to its unique properties. The market dynamics of sulfuric acid are characterized by constant evolution and adaptation to emerging applications and regulatory requirements. Sulfur mining and processing remain the primary sources of raw materials for sulfuric acid production. The compound's corrosion resistance makes it an indispensable component in various sectors, including dye manufacturing, water treatment, and chemical synthesis. In the realm of water treatment, sulfuric acid functions as a dehydrating agent and pH control agent. Sulfuric acid's role extends to the production of vanadium pentoxide, a critical component in catalysts used in petroleum refining and other industrial processes.
Furthermore, it serves as a crucial reagent in the contact process for sulfur dioxide conversion and in the lead-chamber process for battery production. Environmental regulations and safety standards continue to shape the market, driving the development of more efficient and eco-friendly production methods. The compound's use as a pickling agent in metal processing and its role in emission control further underscore its significance. The global distribution of sulfuric acid is extensive, with various modes of transport, including rail and tank trucks, ensuring its availability to diverse industries. The ongoing demand for sulfuric acid in fertilizer production, detergent manufacturing, and hydrogen peroxide and phosphoric acid production further underscores its market relevance.
Production capacity expansion and technological advancements continue to shape the market, with ongoing research and development efforts aimed at enhancing the compound's purity and concentration. Sulfuric acid's role as an oxidizing agent and its applications in various industries make it a continuously evolving market with significant potential for growth.
How is this Sulfuric Acid Industry segmented?
The sulfuric acid industry research report provides comprehensive data (region-wise segment analysis), with forecasts and estimates in "USD billion" for the period 2024-2028, as well as historical data from 2018-2022 for the following segments.
- Raw Material
- Base metal smelters
- Elemental sulfur
- Pyrite ore
- Application
- Phosphate fertilizer
- Metal processing
- Chemical production
- Others
- Geography
- North America
- US
- Europe
- Russia
- APAC
- China
- India
- Rest of World (ROW)
- North America
By Raw Material Insights
The base metal smelters segment is estimated to witness significant growth during the forecast period.
The market is a significant global industry, with key contributors including base metal smelters, rail transport, and the contact process. Sulfuric acid is primarily produced from sulfur dioxide gas generated during base metal smelting. The contact process transforms this gas into sulfuric acid, making it an essential byproduct of base metal production. The availability of sulfur dioxide gas for sulfuric acid manufacturing is influenced by base metal demand and smelting processes. Environmental regulations play a crucial role in the market, as sulfuric acid is an oxidizing agent used in various applications, including fertilizer production, water treatment, and emission control.
Sulfuric acid grades, such as industrial, reagent, and battery, cater to diverse industries, including petroleum refining, chemical synthesis, and metal processing. Raw materials, including sulfur trioxide and elemental sulfur, are essential for sulfuric acid production. The supply chain involves the transportation of these raw materials via tank trucks and rail, ensuring global distribution. Production capacity is influenced by various factors, including safety regulations, sulfuric acid concentration, and corrosion resistance. Sulfuric acid is used as a dehydrating agent, a ph control agent, and a pickling agent in various industries. Its applications include the production of hydrogen peroxide, phosphoric acid, vanadium pentoxide, and sulfuric anhydride.
In metal processing, it serves as a critical component in the lead-chamber process and battery grade production. In the context of environmental regulations, sulfuric acid is used in the production of sulfur dioxide, which is a primary pollutant in industries. Proper management of sulfuric acid waste is essential to minimize environmental impact. The market is expected to continue evolving, with ongoing research and development in areas such as production efficiency, environmental sustainability, and safety regulations.
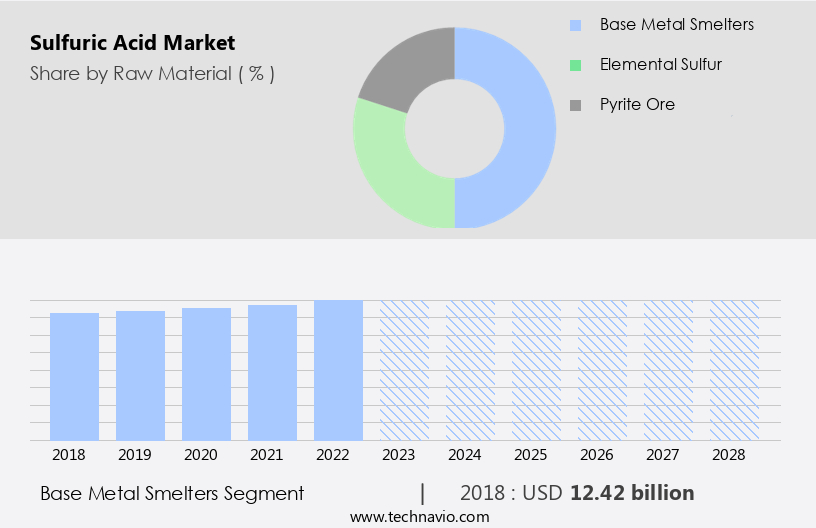
The Base metal smelters segment was valued at USD 12.42 billion in 2018 and showed a gradual increase during the forecast period.
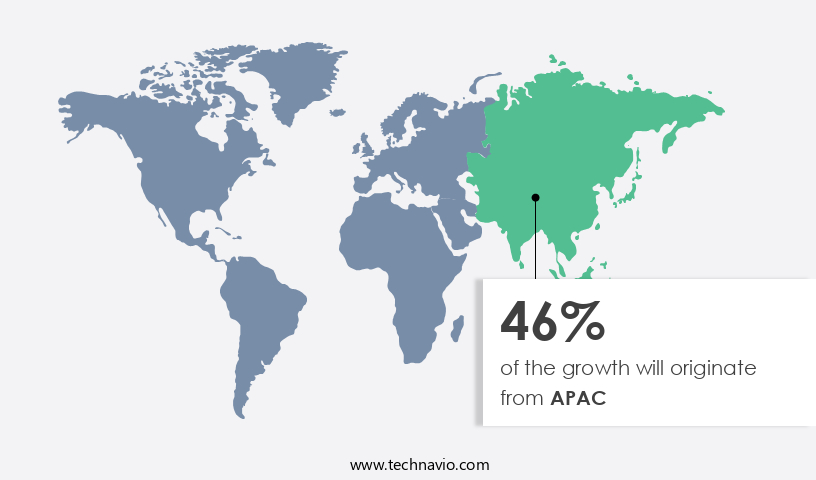
Regional Analysis
APAC is estimated to contribute 46% to the growth of the global market during the forecast period. Technavio's analysts have elaborately explained the regional trends and drivers that shape the market during the forecast period.
The market in APAC is driven by the significant demand from the agricultural and chemical industries. China, India, Indonesia, Vietnam, and Japan are the major contributors to the market's revenue due to the high consumption of phosphate fertilizers. The agricultural sector's growth, particularly in China, India, and Japan, is a primary factor fueling the demand for sulfuric acid. Additionally, the chemical industry's continuous expansion, easy accessibility to raw materials, a large consumer base, and strategic production facility setup are key growth drivers. Sulfuric acid is an essential oxidizing agent used in various industries, including fertilizer production, hydrogen peroxide and phosphoric acid production, petroleum refining, and water treatment.
In the production process, sulfur trioxide is converted into sulfuric acid through the contact process, which involves the absorption tower's utilization. Sulfur mining and the supply chain's efficiency are crucial factors influencing the market's dynamics. Safety regulations and environmental concerns have led to the development of various sulfuric acid grades, such as industrial grade, reagent grade, and battery grade, to cater to diverse industry requirements. The market's demand is further influenced by its applications in chemical synthesis, ph control, pickling agent, dehydrating agent, and emission control. Tank trucks and rail transport are crucial for the market's global distribution, ensuring the timely delivery of sulfuric acid to various industries.
The market's production capacity is expanding, with companies investing in vanadium pentoxide and elemental sulfur to meet the increasing demand. Sulfuric acid's versatility as a key ingredient in various industries, including metal processing, detergent manufacturing, and battery production, further enhances its market potential.
Market Dynamics
Our researchers analyzed the data with 2023 as the base year, along with the key drivers, trends, and challenges. A holistic analysis of drivers will help companies refine their marketing strategies to gain a competitive advantage.
What are the key market drivers leading to the rise in the adoption of Sulfuric Acid Industry?
- The electronics industry's increasing requirement for sulfuric acid serves as the primary market driver.
- Sulfuric acid, a critical oxidizing agent, plays a significant role in various industries, including waste management and fertilizer production. In the waste management sector, it is used in the contact process for the production of phosphoric acid, which is essential in the manufacturing of fertilizers. The global distribution of sulfuric acid is widespread due to its extensive applications. Environmental regulations have been a driving force in the market demand for high-purity sulfuric acid in wastewater treatment. This grade of sulfuric acid is used in the absorption tower during the purification process to remove impurities, making it an indispensable component in wastewater treatment.
- Moreover, sulfuric acid is also used in the production of hydrogen peroxide, an essential industrial chemical used in various applications, including water treatment and bleaching. The rail transport sector also relies on sulfuric acid as a raw material for the production of phosphoric acid, which is used in the manufacturing of fertilizers. The semiconductor industry is another significant consumer of high-purity sulfuric acid. It is used in the fabrication of silicon wafers to meet the stringent quality demands of the industry. The steady growth of the semiconductor industry, driven by the increasing global use of electrical and electronic appliances and rapid economic growth in developing countries, is expected to fuel the demand for high-purity sulfuric acid.
What are the market trends shaping the Sulfuric Acid Industry?
- The market trend involves expanding capacity and adding new plants. This is achieved through capacity expansions and the construction of new facilities.
- The market has experienced significant growth in recent years due to the increasing demand from various industries. Notably, the fertilizer industry's expansion in China, South America, and the Middle East has driven the need for more sulfuric acid production facilities. Sulfuric acid is a crucial raw material in phosphoric acid production, making it an essential component in fertilizer manufacturing. Additionally, the industrial and reagent-grade sulfuric acid's demand continues to surge due to its extensive use in petroleum refining and other industries. Producers are responding to this demand by expanding their production capacities to meet the increasing market requirements.
- Sulfur trioxide, a key component in sulfuric acid production, is derived from the combustion of sulfur or other sulfur-containing feedstocks. Safety regulations are stringent in the production and handling of sulfuric acid due to its corrosive nature and potential hazards. Producers must ensure the highest sulfuric acid concentration and purity levels to meet the varying industry requirements. Overall, the market is expected to continue its growth trajectory in the coming decade, driven by the expanding demand from various industries.
What challenges does the Sulfuric Acid Industry face during its growth?
- The volatile pricing of raw materials poses a significant challenge to the industry's growth trajectory.
- The market has experienced price fluctuations due to various factors. In April 2022, the average imported sulfuric acid price per ton was USD 146, representing an 8.3% increase from March 2022. This price increase occurred at an average monthly rate of +8.5% from January 2022 to March 2022. These price fluctuations are attributed to the shutdown of several sulfur refineries in the US and demand and supply chain disruptions in China. Sulfuric acid is a vital industrial chemical used in various applications, including corrosion resistance, dye manufacturing, water treatment, chemical synthesis, and pH control.
- As a dehydrating agent and pickling agent, it is essential in numerous industries. Despite its widespread usage, the market growth may be hindered by these price fluctuations during the forecast period.
Exclusive Customer Landscape
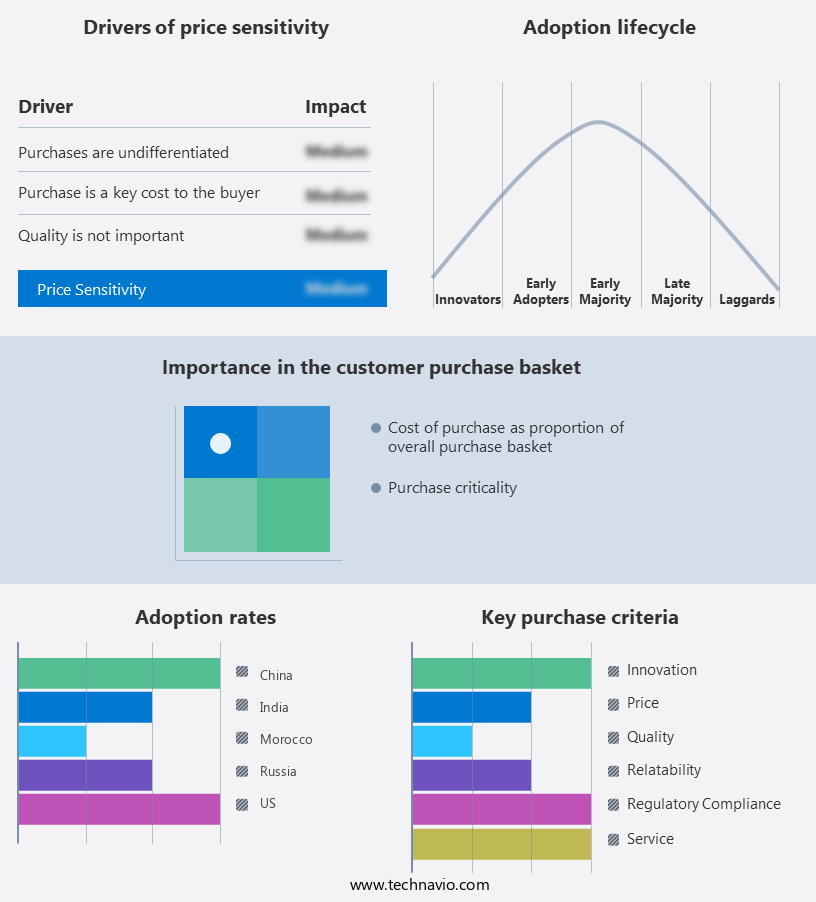
The sulfuric acid market forecasting report includes the adoption lifecycle of the market, covering from the innovator's stage to the laggard's stage. It focuses on adoption rates in different regions based on penetration. Furthermore, the sulfuric acid market report also includes key purchase criteria and drivers of price sensitivity to help companies evaluate and develop their market growth analysis strategies.
Customer Landscape
Key Companies & Market Insights
Companies are implementing various strategies, such as strategic alliances, sulfuric acid market forecast, partnerships, mergers and acquisitions, geographical expansion, and product/service launches, to enhance their presence in the industry.
Aurubis AG - The company specializes in producing high-quality sulfuric acid, including Aurubis sulfuric acid, for various industries.
The industry research and growth report includes detailed analyses of the competitive landscape of the market and information about key companies, including:
- Aurubis AG
- BASF SE
- Boliden AB
- Chemtrade Logistics Income Fund
- China National Chemical Corp.
- Cornerstone Chemical Co.
- DuPont de Nemours Inc.
- Ecovyst Inc.
- Glencore Plc
- Gulf Fluor
- Hindustan Zinc Ltd.
- Honeywell International Inc.
- Jubilant Industries Ltd.
- Korea Zinc Co. Ltd
- Lanxess AG
- Nouryon
- Sumitomo Chemical Co. Ltd.
- Thermo Fisher Scientific Inc.
- Trident Ltd.
- WeylChem International GmbH
Qualitative and quantitative analysis of companies has been conducted to help clients understand the wider business environment as well as the strengths and weaknesses of key industry players. Data is qualitatively analyzed to categorize companies as pure play, category-focused, industry-focused, and diversified; it is quantitatively analyzed to categorize companies as dominant, leading, strong, tentative, and weak.
Recent Development and News in Sulfuric Acid Market
- In January 2024, Dow Inc. announced the expansion of its European sulfuric acid production capacity by 300,000 metric tons per year at its site in Terneuzen, Netherlands (Dow Inc. Press release, 2024). This strategic move aimed to strengthen Dow's position in the European market and meet the growing demand for sulfuric acid in various industries, including phosphate fertilizers, oil refining, and water treatment.
- In March 2024, CF Industries Holdings, Inc. completed the acquisition of INEOS Fertilizers' European nitrogen and phosphate business, which included sulfuric acid production assets in the UK and Belgium (CF Industries Holdings, Inc. Press release, 2024). This acquisition significantly expanded CF Industries' European footprint and enhanced its ability to produce and distribute sulfuric acid to a broader customer base.
- In May 2024, China National Chemical Corporation (ChemChina) and Qatar Chemical Company signed a strategic cooperation agreement to jointly build a sulfuric acid plant in Qatar (Xinhua News Agency, 2024). The new plant, with an annual capacity of 1.5 million metric tons, was expected to be operational by 2026 and would cater to the growing demand for sulfuric acid in the Middle East and North Africa region.
- In April 2025, SABIC and Saudi Arabian Mining Company (Ma'aden) announced the successful commissioning of their joint venture sulfuric acid plant in Saudi Arabia (SABIC press release, 2025). The plant, with a capacity of 1.2 million metric tons per year, was built to meet the increasing demand for sulfuric acid in the local market and contribute to the growth of the Saudi Arabian petrochemicals industry.
Research Analyst Overview
- The market encompasses a range of sulfate salts and their derivatives, including aluminum sulfate, sulfurous acid, dithionic acid, potassium sulfate, zinc sulfate, sodium sulfate, barium sulfate, calcium sulfate, copper sulfate, lead sulfate, iron sulfate, titanium sulfate, ammonium sulfate, and sulfamic acid. Spent acid regeneration is a critical process in the production of sulfuric acid, ensuring energy efficiency and reducing environmental impact. Health and safety considerations are paramount in the handling and use of these chemicals, with risk assessment and quality control measures essential for business operations. Analytical techniques and chemical analysis play a crucial role in ensuring product specifications are met, while concentration methods and acid purification processes optimize production and improve efficiency.
- Sulfuric acid and its derivatives have various applications, from water treatment to the production of other chemicals such as sulfate salts. Environmental concerns, including the production and disposal of sulfuric acid, are a significant market trend, driving innovation in process optimization and the development of more sustainable production methods. Sulfurous acid, thiosulfuric acid, and other sulfur-containing compounds are also gaining attention due to their potential applications in various industries. In the market, sustainability, safety, and efficiency are key drivers, with companies focusing on improving production processes, reducing waste, and meeting stringent regulatory requirements. The market for sulfuric acid and its derivatives is diverse and dynamic, with ongoing research and development efforts aimed at expanding their applications and optimizing their production.
Dive into Technavio's robust research methodology, blending expert interviews, extensive data synthesis, and validated models for unparalleled Sulfuric Acid Market insights. See full methodology.
|
Market Scope |
|
|
Report Coverage |
Details |
|
Page number |
185 |
|
Base year |
2023 |
|
Historic period |
2018-2022 |
|
Forecast period |
2024-2028 |
|
Growth momentum & CAGR |
Accelerate at a CAGR of 3.31% |
|
Market growth 2024-2028 |
USD 5.7 billion |
|
Market structure |
Fragmented |
|
YoY growth 2023-2024(%) |
3.17 |
|
Key countries |
China, US, India, Morocco, and Russia |
|
Competitive landscape |
Leading Companies, Market Positioning of Companies, Competitive Strategies, and Industry Risks |
What are the Key Data Covered in this Sulfuric Acid Market Research and Growth Report?
- CAGR of the Sulfuric Acid industry during the forecast period
- Detailed information on factors that will drive the growth and forecasting between 2024 and 2028
- Precise estimation of the size of the market and its contribution of the industry in focus to the parent market
- Accurate predictions about upcoming growth and trends and changes in consumer behaviour
- Growth of the market across APAC, Middle East and Africa, North America, Europe, and South America
- Thorough analysis of the market's competitive landscape and detailed information about companies
- Comprehensive analysis of factors that will challenge the sulfuric acid market growth of industry companies
We can help! Our analysts can customize this sulfuric acid market research report to meet your requirements.
 RIA -
RIA - 
