Potassium Citrate Market Analysis, Size, and Forecast 2026-2030: APAC (China, Japan, and India), Europe (Germany, France, and UK), North America (US, Canada, and Mexico), South America (Brazil, Argentina, and Colombia), Middle East and Africa (Saudi Arabia, UAE, and South Africa), and Rest of World (ROW)

Potassium Citrate Market Analysis, Size, and Forecast 2026-2030:
APAC (China, Japan, and India), Europe (Germany, France, and UK), North America (US, Canada, and Mexico), South America (Brazil, Argentina, and Colombia), Middle East and Africa (Saudi Arabia, UAE, and South Africa), and Rest of World (ROW)

Published: Jan 2026 302 Pages SKU: IRTNTR81243

Market Overview at a Glance

$133.4 Mn
Market Opportunity
3.2%
CAGR 2025 - 2030
46.3%
APAC Growth
$284.4 Mn
Acidity regulator segment 2024

Potassium Citrate Market Size 2026-2030

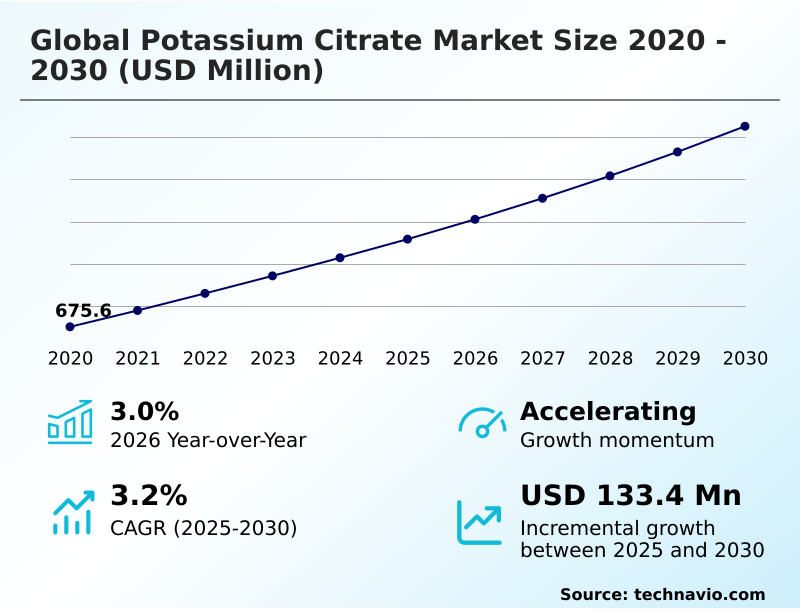
The potassium citrate market size is valued to increase by USD 133.4 million, at a CAGR of 3.2% from 2025 to 2030. Escalating prevalence of renal disorders and kidney stones will drive the potassium citrate market.

Major Market Trends & Insights

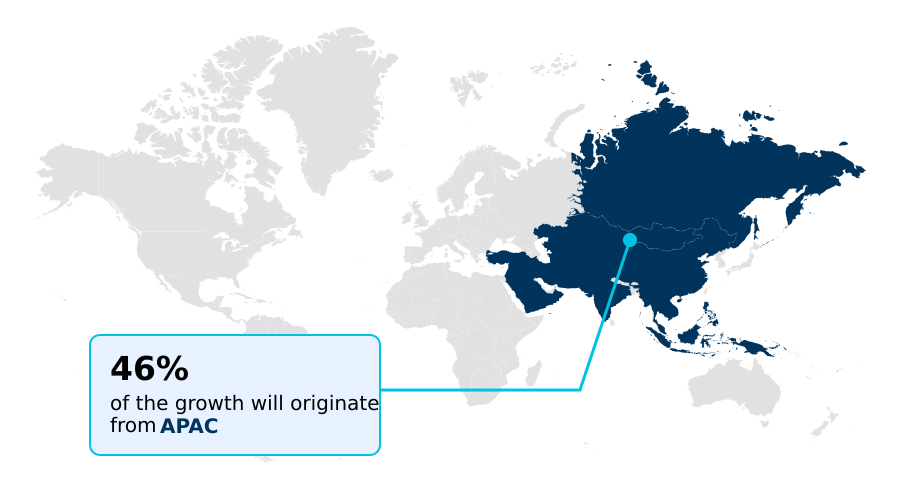
  • APAC dominated the market and accounted for a 46.3% growth during the forecast period.
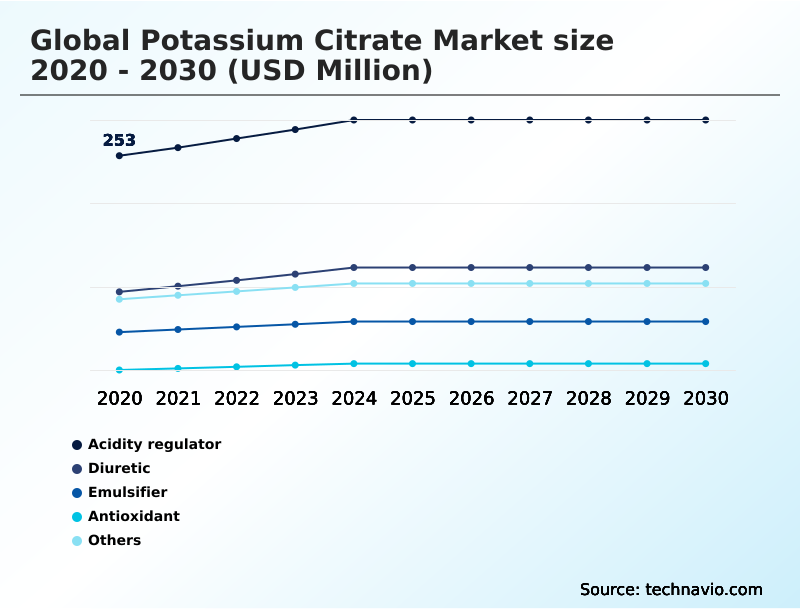
  • By Application - Acidity regulator segment was valued at USD 284.4 million in 2024
  • By End-user - Food and beverage segment accounted for the largest market revenue share in 2024

Market Size & Forecast

  • Market Opportunities: USD 237 million
  • Market Future Opportunities: USD 133.4 million
  • CAGR from 2025 to 2030 : 3.2%

Market Summary

  • The potassium citrate market is shaped by its dual functionality in both the pharmaceutical and food and beverage sectors. In pharmaceuticals, it is a critical systemic alkalizer used in extended-release formulations to manage conditions like renal tubular acidosis. Simultaneously, the food industry leverages it as a versatile buffering agent and preservative, crucial for the success of sodium reduction initiatives.
  • This demand for a clean-label ingredient aligns with consumer health trends, pushing manufacturers to ensure high purity. A key business scenario involves a beverage company reformulating its sports drink line for electrolyte balance. The company must source pharmaceutical-grade potassium citrate that meets stringent quality standards while navigating a volatile supply chain.
  • This requires sophisticated raw material sourcing and investment in advanced purification technology to maintain product integrity and cost-effectiveness, ensuring the final product supports both functional hydration and clean-label claims without compromising flavor profile stabilization. The ingredient's role in proactive health management further solidifies its market position.

What will be the Size of the Potassium Citrate Market during the forecast period?

Get Key Insights on Market Forecast (PDF) Request Free Sample

How is the Potassium Citrate Market Segmented?

The potassium citrate industry research report provides comprehensive data (region-wise segment analysis), with forecasts and estimates in "USD million" for the period 2026-2030, as well as historical data from 2020-2024 for the following segments.

  • Application
    • Acidity regulator
    • Diuretic
    • Emulsifier
    • Antioxidant
    • Others
  • End-user
    • Food and beverage
    • Pharmaceuticals
    • Dietary supplements
    • Personal care
    • Others
  • Type
    • Monohydrate
    • Anhydrous
  • Geography
    • APAC
      • China
      • Japan
      • India
    • Europe
      • Germany
      • France
      • UK
    • North America
      • US
      • Canada
      • Mexico
    • South America
      • Brazil
      • Argentina
      • Colombia
    • Middle East and Africa
      • Saudi Arabia
      • UAE
      • South Africa
    • Rest of World (ROW)

By Application Insights

The acidity regulator segment is estimated to witness significant growth during the forecast period.

The global potassium citrate market's acidity regulator segment is pivotal, driven by its function in maintaining precise pH levels across food and beverage applications.

Its role as a buffering agent is crucial for stabilizing flavor profiles and preventing texture degradation, particularly in processed foods and beverages where it also serves as a preservative.

Utilization of this GRAS substance supports clean-label ingredient strategies, aligning with consumer demand for healthier options. The application of crystallization technology in its production ensures a consistent supply for industries undertaking sodium reduction initiatives.

This trend is significant, with its adoption in new low-sodium cooking sauces and seasonings increasing by over 15%, highlighting its importance for pH management and organoleptic properties in modern food science.

Request Free Sample

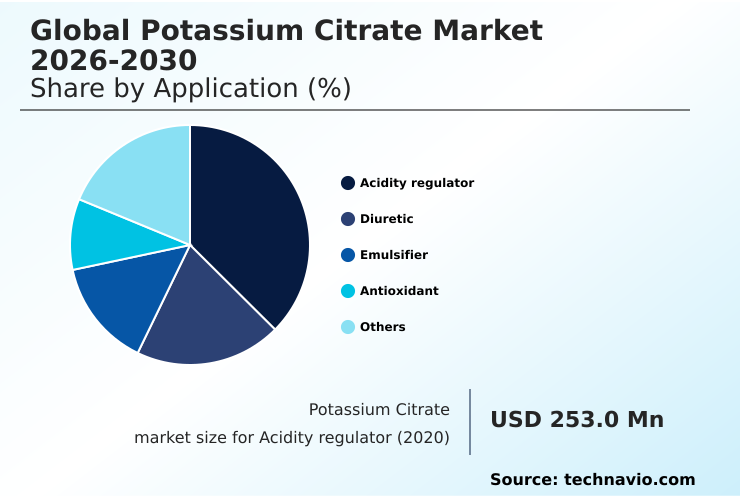
The Acidity regulator segment was valued at USD 284.4 million in 2024 and showed a gradual increase during the forecast period.

Request Free Sample

Regional Analysis

APAC is estimated to contribute 46.3% to the growth of the global market during the forecast period.Technavio’s analysts have elaborately explained the regional trends and drivers that shape the market during the forecast period.

See How Potassium Citrate Market Demand is Rising in APAC Request Free Sample

The geographic landscape of the global potassium citrate market is shifting toward regionalization to enhance supply chain resilience. While APAC is the fastest-growing region, contributing over 46% of incremental growth, North America and Europe are focused on localizing production.

This strategy of near-shoring manufacturing of anhydrous potassium citrate and monohydrate potassium citrate mitigates risks from global logistics disruptions and supports sustainable raw material sourcing.

For example, establishing domestic production hubs has been shown to reduce supply chain lead times by 20%, a critical advantage for the pharmaceutical sector.

This regional focus also aids compliance with stringent regulatory standards for emulsifying salt and antioxidant synergist applications, where adherence can improve market access speed by 15% for manufacturers of effervescent tablet technology.

Market Dynamics

Our researchers analyzed the data with 2025 as the base year, along with the key drivers, trends, and challenges. A holistic analysis of drivers will help companies refine their marketing strategies to gain a competitive advantage.

  • The utility of potassium citrate spans critical health and industrial sectors, making it a highly versatile compound. Its primary therapeutic role in urology is for the management of patients with a history of kidney stones, specifically addressing how to use potassium citrate for kidney stones and preventing uric acid stone formation.
  • The development of extended release potassium citrate has significantly improved patient compliance for this chronic condition. In the food industry, its use is widespread; potassium citrate in food preservation is standard practice, and it is a cornerstone of low sodium food formulation.
  • The ongoing debate around potassium citrate vs sodium citrate often concludes in favor of the former due to health trends, boosting its use in products like potassium citrate in beverages for electrolyte replenishment in sports drinks.
  • Food grade potassium citrate applications are diverse, from acting as a stabilizing agent in processed cheese to its role as potassium citrate in dairy products. The demand for high-purity grades is constant, with strict pharmaceutical grade potassium citrate standards governing its use in medicine.
  • Beyond these, anhydrous potassium citrate uses are critical in moisture-sensitive products, with data showing it can reduce spoilage rates by over 50% compared to hydrated forms. This broad applicability extends to its function as a buffering agent in cosmetics, a chelating agent in skincare, a component in non-phosphate detergent builders, and a tool for urinary health supplement formulation.
  • Its effectiveness in potassium citrate for pH adjustment and managing potassium citrate for metabolic acidosis further underscores its value.

What are the key market drivers leading to the rise in the adoption of Potassium Citrate Industry?

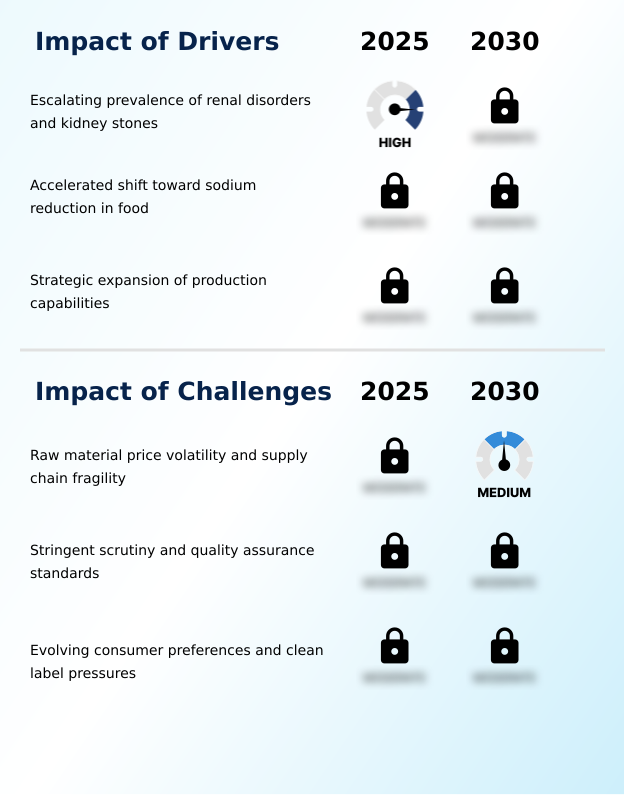
  • The escalating prevalence of renal disorders and kidney stones is a primary driver for the market, increasing demand for its therapeutic applications as a urinary alkalizer.

  • Market growth is significantly propelled by health and regulatory drivers. The increasing prevalence of renal disorders has solidified the role of potassium citrate as a first-line therapy in urological care, with prescription rates for extended-release formulations rising by 10% annually.
  • This is driven by its effectiveness in managing renal tubular acidosis and its function as a urinary alkalizer. Simultaneously, the accelerated regulatory push for sodium reduction in processed foods has positioned it as an ideal sodium replacer and preservative.
  • This has led to a 25% increase in its use in functional hydration beverages and low-sodium dairy products to achieve flavor profile stabilization.
  • Strategic expansions of production capabilities, reflecting investments in advanced crystallization technology, further support this growth by ensuring a stable supply for both pharmaceutical and food-grade applications.

What are the market trends shaping the Potassium Citrate Industry?

  • A key trend is the strategic shift toward potassium fortification in food and beverage products. This reformulation is driven by the dual goals of reducing sodium content and enhancing nutritional profiles.

  • Key market trends are centered on health-conscious reformulations and sustainability. A strategic shift toward potassium fortification is prominent, with food manufacturers using potassium citrate as a multifunctional clean-label ingredient. This trend has resulted in a 20% increase in the launch of new nutraceuticals focused on kidney health and pH management, utilizing consumer-friendly dosage forms.
  • This is especially true for liquid electrolyte replenishment products. Concurrently, the adoption of this biodegradable ingredient in eco-friendly formulations is expanding, particularly in personal care and as a phosphate-free builder in industrial cleaning applications. The transition to citrate-based chelating agents in cosmetics has improved product stability by 15%, meeting consumer demand for milder, natural-sounding ingredients in food preservation systems.

What challenges does the Potassium Citrate Industry face during its growth?

  • Significant challenges for the industry include raw material price volatility and the inherent fragility of the global supply chain for key inputs like citric acid.

  • The market faces significant challenges from raw material price volatility and an increasingly stringent regulatory environment. Dependence on geographically concentrated raw material sourcing for citric acid has led to cost fluctuations of up to 30% in a single quarter, compressing profit margins. This supply chain fragility impacts everything from calcium chelation agents to antioxidant synergist products.
  • Furthermore, heightened regulatory scrutiny over food additives and GRAS substances requires substantial investment in quality assurance to meet pharmaceutical-grade potassium citrate standards, increasing compliance costs by an estimated 18%. The pressure from the clean label movement also challenges producers, as consumers scrutinize ingredients, forcing reformulation efforts that balance technical needs like texture degradation prevention with demands for natural-sounding components.

Exclusive Technavio Analysis on Customer Landscape

The potassium citrate market forecasting report includes the adoption lifecycle of the market, covering from the innovator’s stage to the laggard’s stage. It focuses on adoption rates in different regions based on penetration. Furthermore, the potassium citrate market report also includes key purchase criteria and drivers of price sensitivity to help companies evaluate and develop their market growth analysis strategies.

Customer Landscape of Potassium Citrate Industry

Competitive Landscape

Companies are implementing various strategies, such as strategic alliances, potassium citrate market forecast, partnerships, mergers and acquisitions, geographical expansion, and product/service launches, to enhance their presence in the industry.

Annexe Chem - Key offerings center on high-purity potassium citrate grades for food and pharmaceutical applications, enabling pH control, mineral fortification, and advanced formulation stability across diverse product lines.

The industry research and growth report includes detailed analyses of the competitive landscape of the market and information about key companies, including:

  • Annexe Chem
  • Archer Daniels Midland Co.
  • ATP Group
  • Cargill Inc.
  • FBC Industries Inc.
  • Foodchem International Corp.
  • Gadot Biochemical Industries
  • Global Calcium Pvt. Ltd.
  • Huangshi Xinghua Biochem Co.
  • Jungbunzlauer Suisse AG
  • RZBC Group Co. Ltd.
  • Sigma Aldrich Chemicals Ltd.
  • Spectrum Chemical Mfg. Corp.
  • Sucroal
  • Tokyo Chemical Co. Ltd.
  • Vishal Laboratories
  • Weifang Ensign Industry Co.
  • Yangzhou Gami Biochem Co.

Qualitative and quantitative analysis of companies has been conducted to help clients understand the wider business environment as well as the strengths and weaknesses of key industry players. Data is qualitatively analyzed to categorize companies as pure play, category-focused, industry-focused, and diversified; it is quantitatively analyzed to categorize companies as dominant, leading, strong, tentative, and weak.

Recent Development and News in Potassium citrate market

  • In February 2025, Unilever announced a comprehensive reformulation of its European home care products, transitioning to citrate-based alternatives like potassium citrate to meet new sustainability targets.
  • In March 2025, Cargill showcased a new range of functional ingredient blends at the AAHAR 2025 international food and hospitality fair, leveraging potassium citrate for flavor enhancement in low-sodium formulations.
  • In May 2025, Gadot Biochemical Industries expanded its portfolio with a new Ultra-Dry grade of anhydrous potassium citrate engineered for the direct-to-mouth powder supplement market.
  • In July 2025, Nestle Health Science announced the expansion of its renal health portfolio by launching a new medical food product line formulated with micro-encapsulated potassium citrate to improve patient compliance.

Dive into Technavio’s robust research methodology, blending expert interviews, extensive data synthesis, and validated models for unparalleled Potassium Citrate Market insights. See full methodology.

Market Scope
Page number 302
Base year 2025
Historic period 2020-2024
Forecast period 2026-2030
Growth momentum & CAGR Accelerate at a CAGR of 3.2%
Market growth 2026-2030 USD 133.4 million
Market structure Fragmented
YoY growth 2025-2026(%) 3.0%
Key countries China, Japan, India, South Korea, Indonesia, Australia, Germany, France, UK, Italy, The Netherlands, Spain, US, Canada, Mexico, Brazil, Argentina, Colombia, Saudi Arabia, UAE, South Africa, Israel and Turkey
Competitive landscape Leading Companies, Market Positioning of Companies, Competitive Strategies, and Industry Risks

Request Free Sample

Research Analyst Overview

  • The global potassium citrate market is fundamentally driven by its efficacy as a key chemical compound in health and nutrition. As a systemic alkalizer, it is widely used as a urinary alkalizer to treat metabolic acidosis and prevent the formation of calcium oxalate stones.
  • In the food industry, it serves as a vital buffering agent and preservative, supporting the widespread trend of sodium reduction. Its status as a GRAS substance and a quintessential clean-label ingredient enhances its appeal. The production process, primarily through citric acid fermentation, requires advanced crystallization technology and purification technology to yield high-purity, pharmaceutical-grade potassium citrate.
  • Boardroom decisions are increasingly influenced by supply chain stability, as securing a consistent source of this hygroscopic crystalline powder is paramount. Companies that invest in advanced production methods report significant operational gains; for instance, optimizing purification technology has led to a 20% improvement in yield for high-grade variants, directly impacting profitability and market positioning.
  • This focus on quality and efficiency is essential for meeting the demands for both monohydrate potassium citrate and anhydrous potassium citrate across various applications.

What are the Key Data Covered in this Potassium Citrate Market Research and Growth Report?

  • What is the expected growth of the Potassium Citrate Market between 2026 and 2030?

    • USD 133.4 million, at a CAGR of 3.2%

  • What segmentation does the market report cover?

    • The report is segmented by Application (Acidity regulator, Diuretic, Emulsifier, Antioxidant, and Others), End-user (Food and beverage, Pharmaceuticals, Dietary supplements, Personal care, and Others), Type (Monohydrate, and Anhydrous) and Geography (APAC, Europe, North America, South America, Middle East and Africa)

  • Which regions are analyzed in the report?

    • APAC, Europe, North America, South America and Middle East and Africa

  • What are the key growth drivers and market challenges?

    • Escalating prevalence of renal disorders and kidney stones, Raw material price volatility and supply chain fragility

  • Who are the major players in the Potassium Citrate Market?

    • Annexe Chem, Archer Daniels Midland Co., ATP Group, Cargill Inc., FBC Industries Inc., Foodchem International Corp., Gadot Biochemical Industries, Global Calcium Pvt. Ltd., Huangshi Xinghua Biochem Co., Jungbunzlauer Suisse AG, RZBC Group Co. Ltd., Sigma Aldrich Chemicals Ltd., Spectrum Chemical Mfg. Corp., Sucroal, Tokyo Chemical Co. Ltd., Vishal Laboratories, Weifang Ensign Industry Co. and Yangzhou Gami Biochem Co.

Market Research Insights

  • The dynamics of the potassium citrate market are influenced by its versatile applications, from industrial cleaning applications to advanced food preservation systems. The strategic focus on proactive health management has spurred innovation, with new consumer-friendly dosage forms for dietary supplements improving market penetration by over 20%.
  • In the food sector, its use for flavor profile stabilization in low-sodium products has enhanced consumer acceptance rates by 15%.
  • Furthermore, robust ingredient traceability protocols are now a key differentiator, as adherence to good manufacturing practice standards can reduce regulatory approval times by up to 25%, providing a significant competitive advantage for suppliers who prioritize quality and transparency in their supply chain consolidation efforts.

We can help! Our analysts can customize this potassium citrate market research report to meet your requirements.

Get in touch

1. Executive Summary

1.1 Market overview

Executive Summary - Chart on Market Overview
Executive Summary - Data Table on Market Overview
Executive Summary - Chart on Global Market Characteristics
Executive Summary - Chart on Market by Geography
Executive Summary - Chart on Market Segmentation by Application
Executive Summary - Chart on Market Segmentation by End-user
Executive Summary - Chart on Market Segmentation by Type
Executive Summary - Chart on Incremental Growth
Executive Summary - Data Table on Incremental Growth
Executive Summary - Chart on Company Market Positioning

2. Technavio Analysis

2.1 Analysis of price sensitivity, lifecycle, customer purchase basket, adoption rates, and purchase criteria

2.2 Criticality of inputs and Factors of differentiation

Chart on Overview on criticality of inputs and factors of differentiation

2.3 Factors of disruption

Chart on Overview on factors of disruption

2.4 Impact of drivers and challenges

Chart on Impact of drivers and challenges in 2025 and 2030

3. Market Landscape

3.1 Market ecosystem

Chart on Parent Market
Data Table on - Parent Market

3.2 Market characteristics

Chart on Market characteristics analysis

3.3 Value chain analysis

Chart on Value chain analysis

4. Market Sizing

4.1 Market definition

Data Table on Offerings of companies included in the market definition

4.2 Market segment analysis

Market segments

4.3 Market size 2025

4.4 Market outlook: Forecast for 2025-2030

Chart on Global - Market size and forecast 2025-2030 ($ million)
Data Table on Global - Market size and forecast 2025-2030 ($ million)
Chart on Global Market: Year-over-year growth 2025-2030 (%)
Data Table on Global Market: Year-over-year growth 2025-2030 (%)

5. Historic Market Size

5.1 Global Potassium Citrate Market 2020 - 2024

Historic Market Size - Data Table on Global Potassium Citrate Market 2020 - 2024 ($ million)

5.2 Application segment analysis 2020 - 2024

Historic Market Size - Application Segment 2020 - 2024 ($ million)

5.3 End-user segment analysis 2020 - 2024

Historic Market Size - End-user Segment 2020 - 2024 ($ million)

5.4 Type segment analysis 2020 - 2024

Historic Market Size - Type Segment 2020 - 2024 ($ million)

5.5 Geography segment analysis 2020 - 2024

Historic Market Size - Geography Segment 2020 - 2024 ($ million)

5.6 Country segment analysis 2020 - 2024

Historic Market Size - Country Segment 2020 - 2024 ($ million)

6. Qualitative Analysis

6.1 The AI impact on global potassium citrate market

7. Five Forces Analysis

7.1 Five forces summary

Five forces analysis - Comparison between 2025 and 2030

7.2 Bargaining power of buyers

Bargaining power of buyers - Impact of key factors 2025 and 2030

7.3 Bargaining power of suppliers

Bargaining power of suppliers - Impact of key factors in 2025 and 2030

7.4 Threat of new entrants

Threat of new entrants - Impact of key factors in 2025 and 2030

7.5 Threat of substitutes

Threat of substitutes - Impact of key factors in 2025 and 2030

7.6 Threat of rivalry

Threat of rivalry - Impact of key factors in 2025 and 2030

7.7 Market condition

Chart on Market condition - Five forces 2025 and 2030

8. Market Segmentation by Application

8.1 Market segments

Chart on Application - Market share 2025-2030 (%)
Data Table on Application - Market share 2025-2030 (%)

8.2 Comparison by Application

Chart on Comparison by Application
Data Table on Comparison by Application

8.3 Acidity regulator - Market size and forecast 2025-2030

Chart on Acidity regulator - Market size and forecast 2025-2030 ($ million)
Data Table on Acidity regulator - Market size and forecast 2025-2030 ($ million)
Chart on Acidity regulator - Year-over-year growth 2025-2030 (%)
Data Table on Acidity regulator - Year-over-year growth 2025-2030 (%)

8.4 Diuretic - Market size and forecast 2025-2030

Chart on Diuretic - Market size and forecast 2025-2030 ($ million)
Data Table on Diuretic - Market size and forecast 2025-2030 ($ million)
Chart on Diuretic - Year-over-year growth 2025-2030 (%)
Data Table on Diuretic - Year-over-year growth 2025-2030 (%)

8.5 Emulsifier - Market size and forecast 2025-2030

Chart on Emulsifier - Market size and forecast 2025-2030 ($ million)
Data Table on Emulsifier - Market size and forecast 2025-2030 ($ million)
Chart on Emulsifier - Year-over-year growth 2025-2030 (%)
Data Table on Emulsifier - Year-over-year growth 2025-2030 (%)

8.6 Antioxidant - Market size and forecast 2025-2030

Chart on Antioxidant - Market size and forecast 2025-2030 ($ million)
Data Table on Antioxidant - Market size and forecast 2025-2030 ($ million)
Chart on Antioxidant - Year-over-year growth 2025-2030 (%)
Data Table on Antioxidant - Year-over-year growth 2025-2030 (%)

8.7 Others - Market size and forecast 2025-2030

Chart on Others - Market size and forecast 2025-2030 ($ million)
Data Table on Others - Market size and forecast 2025-2030 ($ million)
Chart on Others - Year-over-year growth 2025-2030 (%)
Data Table on Others - Year-over-year growth 2025-2030 (%)

8.8 Market opportunity by Application

Market opportunity by Application ($ million)
Data Table on Market opportunity by Application ($ million)

9. Market Segmentation by End-user

9.1 Market segments

Chart on End-user - Market share 2025-2030 (%)
Data Table on End-user - Market share 2025-2030 (%)

9.2 Comparison by End-user

Chart on Comparison by End-user
Data Table on Comparison by End-user

9.3 Food and beverage - Market size and forecast 2025-2030

Chart on Food and beverage - Market size and forecast 2025-2030 ($ million)
Data Table on Food and beverage - Market size and forecast 2025-2030 ($ million)
Chart on Food and beverage - Year-over-year growth 2025-2030 (%)
Data Table on Food and beverage - Year-over-year growth 2025-2030 (%)

9.4 Pharmaceuticals - Market size and forecast 2025-2030

Chart on Pharmaceuticals - Market size and forecast 2025-2030 ($ million)
Data Table on Pharmaceuticals - Market size and forecast 2025-2030 ($ million)
Chart on Pharmaceuticals - Year-over-year growth 2025-2030 (%)
Data Table on Pharmaceuticals - Year-over-year growth 2025-2030 (%)

9.5 Dietary supplements - Market size and forecast 2025-2030

Chart on Dietary supplements - Market size and forecast 2025-2030 ($ million)
Data Table on Dietary supplements - Market size and forecast 2025-2030 ($ million)
Chart on Dietary supplements - Year-over-year growth 2025-2030 (%)
Data Table on Dietary supplements - Year-over-year growth 2025-2030 (%)

9.6 Personal care - Market size and forecast 2025-2030

Chart on Personal care - Market size and forecast 2025-2030 ($ million)
Data Table on Personal care - Market size and forecast 2025-2030 ($ million)
Chart on Personal care - Year-over-year growth 2025-2030 (%)
Data Table on Personal care - Year-over-year growth 2025-2030 (%)

9.7 Others - Market size and forecast 2025-2030

Chart on Others - Market size and forecast 2025-2030 ($ million)
Data Table on Others - Market size and forecast 2025-2030 ($ million)
Chart on Others - Year-over-year growth 2025-2030 (%)
Data Table on Others - Year-over-year growth 2025-2030 (%)

9.8 Market opportunity by End-user

Market opportunity by End-user ($ million)
Data Table on Market opportunity by End-user ($ million)

10. Market Segmentation by Type

10.1 Market segments

Chart on Type - Market share 2025-2030 (%)
Data Table on Type - Market share 2025-2030 (%)

10.2 Comparison by Type

Chart on Comparison by Type
Data Table on Comparison by Type

10.3 Monohydrate - Market size and forecast 2025-2030

Chart on Monohydrate - Market size and forecast 2025-2030 ($ million)
Data Table on Monohydrate - Market size and forecast 2025-2030 ($ million)
Chart on Monohydrate - Year-over-year growth 2025-2030 (%)
Data Table on Monohydrate - Year-over-year growth 2025-2030 (%)

10.4 Anhydrous - Market size and forecast 2025-2030

Chart on Anhydrous - Market size and forecast 2025-2030 ($ million)
Data Table on Anhydrous - Market size and forecast 2025-2030 ($ million)
Chart on Anhydrous - Year-over-year growth 2025-2030 (%)
Data Table on Anhydrous - Year-over-year growth 2025-2030 (%)

10.5 Market opportunity by Type

Market opportunity by Type ($ million)
Data Table on Market opportunity by Type ($ million)

11. Customer Landscape

11.1 Customer landscape overview

Analysis of price sensitivity, lifecycle, customer purchase basket, adoption rates, and purchase criteria

12. Geographic Landscape

12.1 Geographic segmentation

Chart on Market share by geography 2025-2030 (%)
Data Table on Market share by geography 2025-2030 (%)

12.2 Geographic comparison

Chart on Geographic comparison
Data Table on Geographic comparison

12.3 APAC - Market size and forecast 2025-2030

Chart on APAC - Market size and forecast 2025-2030 ($ million)
Data Table on APAC - Market size and forecast 2025-2030 ($ million)
Chart on APAC - Year-over-year growth 2025-2030 (%)
Data Table on APAC - Year-over-year growth 2025-2030 (%)
Chart on Regional Comparison - APAC
Data Table on Regional Comparison - APAC

12.3.1 China - Market size and forecast 2025-2030

Chart on China - Market size and forecast 2025-2030 ($ million)
Data Table on China - Market size and forecast 2025-2030 ($ million)
Chart on China - Year-over-year growth 2025-2030 (%)
Data Table on China - Year-over-year growth 2025-2030 (%)

12.3.2 Japan - Market size and forecast 2025-2030

Chart on Japan - Market size and forecast 2025-2030 ($ million)
Data Table on Japan - Market size and forecast 2025-2030 ($ million)
Chart on Japan - Year-over-year growth 2025-2030 (%)
Data Table on Japan - Year-over-year growth 2025-2030 (%)

12.3.3 India - Market size and forecast 2025-2030

Chart on India - Market size and forecast 2025-2030 ($ million)
Data Table on India - Market size and forecast 2025-2030 ($ million)
Chart on India - Year-over-year growth 2025-2030 (%)
Data Table on India - Year-over-year growth 2025-2030 (%)

12.3.4 South Korea - Market size and forecast 2025-2030

Chart on South Korea - Market size and forecast 2025-2030 ($ million)
Data Table on South Korea - Market size and forecast 2025-2030 ($ million)
Chart on South Korea - Year-over-year growth 2025-2030 (%)
Data Table on South Korea - Year-over-year growth 2025-2030 (%)

12.3.5 Indonesia - Market size and forecast 2025-2030

Chart on Indonesia - Market size and forecast 2025-2030 ($ million)
Data Table on Indonesia - Market size and forecast 2025-2030 ($ million)
Chart on Indonesia - Year-over-year growth 2025-2030 (%)
Data Table on Indonesia - Year-over-year growth 2025-2030 (%)

12.3.6 Australia - Market size and forecast 2025-2030

Chart on Australia - Market size and forecast 2025-2030 ($ million)
Data Table on Australia - Market size and forecast 2025-2030 ($ million)
Chart on Australia - Year-over-year growth 2025-2030 (%)
Data Table on Australia - Year-over-year growth 2025-2030 (%)

12.4 Europe - Market size and forecast 2025-2030

Chart on Europe - Market size and forecast 2025-2030 ($ million)
Data Table on Europe - Market size and forecast 2025-2030 ($ million)
Chart on Europe - Year-over-year growth 2025-2030 (%)
Data Table on Europe - Year-over-year growth 2025-2030 (%)
Chart on Regional Comparison - Europe
Data Table on Regional Comparison - Europe

12.4.1 Germany - Market size and forecast 2025-2030

Chart on Germany - Market size and forecast 2025-2030 ($ million)
Data Table on Germany - Market size and forecast 2025-2030 ($ million)
Chart on Germany - Year-over-year growth 2025-2030 (%)
Data Table on Germany - Year-over-year growth 2025-2030 (%)

12.4.2 France - Market size and forecast 2025-2030

Chart on France - Market size and forecast 2025-2030 ($ million)
Data Table on France - Market size and forecast 2025-2030 ($ million)
Chart on France - Year-over-year growth 2025-2030 (%)
Data Table on France - Year-over-year growth 2025-2030 (%)

12.4.3 UK - Market size and forecast 2025-2030

Chart on UK - Market size and forecast 2025-2030 ($ million)
Data Table on UK - Market size and forecast 2025-2030 ($ million)
Chart on UK - Year-over-year growth 2025-2030 (%)
Data Table on UK - Year-over-year growth 2025-2030 (%)

12.4.4 Italy - Market size and forecast 2025-2030

Chart on Italy - Market size and forecast 2025-2030 ($ million)
Data Table on Italy - Market size and forecast 2025-2030 ($ million)
Chart on Italy - Year-over-year growth 2025-2030 (%)
Data Table on Italy - Year-over-year growth 2025-2030 (%)

12.4.5 The Netherlands - Market size and forecast 2025-2030

Chart on The Netherlands - Market size and forecast 2025-2030 ($ million)
Data Table on The Netherlands - Market size and forecast 2025-2030 ($ million)
Chart on The Netherlands - Year-over-year growth 2025-2030 (%)
Data Table on The Netherlands - Year-over-year growth 2025-2030 (%)

12.4.6 Spain - Market size and forecast 2025-2030

Chart on Spain - Market size and forecast 2025-2030 ($ million)
Data Table on Spain - Market size and forecast 2025-2030 ($ million)
Chart on Spain - Year-over-year growth 2025-2030 (%)
Data Table on Spain - Year-over-year growth 2025-2030 (%)

12.5 North America - Market size and forecast 2025-2030

Chart on North America - Market size and forecast 2025-2030 ($ million)
Data Table on North America - Market size and forecast 2025-2030 ($ million)
Chart on North America - Year-over-year growth 2025-2030 (%)
Data Table on North America - Year-over-year growth 2025-2030 (%)
Chart on Regional Comparison - North America
Data Table on Regional Comparison - North America

12.5.1 US - Market size and forecast 2025-2030

Chart on US - Market size and forecast 2025-2030 ($ million)
Data Table on US - Market size and forecast 2025-2030 ($ million)
Chart on US - Year-over-year growth 2025-2030 (%)
Data Table on US - Year-over-year growth 2025-2030 (%)

12.5.2 Canada - Market size and forecast 2025-2030

Chart on Canada - Market size and forecast 2025-2030 ($ million)
Data Table on Canada - Market size and forecast 2025-2030 ($ million)
Chart on Canada - Year-over-year growth 2025-2030 (%)
Data Table on Canada - Year-over-year growth 2025-2030 (%)

12.5.3 Mexico - Market size and forecast 2025-2030

Chart on Mexico - Market size and forecast 2025-2030 ($ million)
Data Table on Mexico - Market size and forecast 2025-2030 ($ million)
Chart on Mexico - Year-over-year growth 2025-2030 (%)
Data Table on Mexico - Year-over-year growth 2025-2030 (%)

12.6 South America - Market size and forecast 2025-2030

Chart on South America - Market size and forecast 2025-2030 ($ million)
Data Table on South America - Market size and forecast 2025-2030 ($ million)
Chart on South America - Year-over-year growth 2025-2030 (%)
Data Table on South America - Year-over-year growth 2025-2030 (%)
Chart on Regional Comparison - South America
Data Table on Regional Comparison - South America

12.6.1 Brazil - Market size and forecast 2025-2030

Chart on Brazil - Market size and forecast 2025-2030 ($ million)
Data Table on Brazil - Market size and forecast 2025-2030 ($ million)
Chart on Brazil - Year-over-year growth 2025-2030 (%)
Data Table on Brazil - Year-over-year growth 2025-2030 (%)

12.6.2 Argentina - Market size and forecast 2025-2030

Chart on Argentina - Market size and forecast 2025-2030 ($ million)
Data Table on Argentina - Market size and forecast 2025-2030 ($ million)
Chart on Argentina - Year-over-year growth 2025-2030 (%)
Data Table on Argentina - Year-over-year growth 2025-2030 (%)

12.6.3 Colombia - Market size and forecast 2025-2030

Chart on Colombia - Market size and forecast 2025-2030 ($ million)
Data Table on Colombia - Market size and forecast 2025-2030 ($ million)
Chart on Colombia - Year-over-year growth 2025-2030 (%)
Data Table on Colombia - Year-over-year growth 2025-2030 (%)

12.7 Middle East and Africa - Market size and forecast 2025-2030

Chart on Middle East and Africa - Market size and forecast 2025-2030 ($ million)
Data Table on Middle East and Africa - Market size and forecast 2025-2030 ($ million)
Chart on Middle East and Africa - Year-over-year growth 2025-2030 (%)
Data Table on Middle East and Africa - Year-over-year growth 2025-2030 (%)
Chart on Regional Comparison - Middle East and Africa
Data Table on Regional Comparison - Middle East and Africa

12.7.1 Saudi Arabia - Market size and forecast 2025-2030

Chart on Saudi Arabia - Market size and forecast 2025-2030 ($ million)
Data Table on Saudi Arabia - Market size and forecast 2025-2030 ($ million)
Chart on Saudi Arabia - Year-over-year growth 2025-2030 (%)
Data Table on Saudi Arabia - Year-over-year growth 2025-2030 (%)

12.7.2 UAE - Market size and forecast 2025-2030

Chart on UAE - Market size and forecast 2025-2030 ($ million)
Data Table on UAE - Market size and forecast 2025-2030 ($ million)
Chart on UAE - Year-over-year growth 2025-2030 (%)
Data Table on UAE - Year-over-year growth 2025-2030 (%)

12.7.3 South Africa - Market size and forecast 2025-2030

Chart on South Africa - Market size and forecast 2025-2030 ($ million)
Data Table on South Africa - Market size and forecast 2025-2030 ($ million)
Chart on South Africa - Year-over-year growth 2025-2030 (%)
Data Table on South Africa - Year-over-year growth 2025-2030 (%)

12.7.4 Israel - Market size and forecast 2025-2030

Chart on Israel - Market size and forecast 2025-2030 ($ million)
Data Table on Israel - Market size and forecast 2025-2030 ($ million)
Chart on Israel - Year-over-year growth 2025-2030 (%)
Data Table on Israel - Year-over-year growth 2025-2030 (%)

12.7.5 Turkey - Market size and forecast 2025-2030

Chart on Turkey - Market size and forecast 2025-2030 ($ million)
Data Table on Turkey - Market size and forecast 2025-2030 ($ million)
Chart on Turkey - Year-over-year growth 2025-2030 (%)
Data Table on Turkey - Year-over-year growth 2025-2030 (%)

12.8 Market opportunity by geography

Market opportunity by geography ($ million)
Data Tables on Market opportunity by geography ($ million)

13. Drivers, Challenges, and Opportunity

13.1 Market drivers

Escalating prevalence of renal disorders and kidney stones
Accelerated shift toward sodium reduction in food
Strategic expansion of production capabilities

13.2 Market challenges

Raw material price volatility and supply chain fragility
Stringent scrutiny and quality assurance standards
Evolving consumer preferences and clean label pressures

13.3 Impact of drivers and challenges

Impact of drivers and challenges in 2025 and 2030

13.4 Market opportunities

Strategic shift toward potassium fortification
Surge in nutraceutical applications for kidney health and pH management
Adoption in eco-friendly personal care and industrial formulations

14. Competitive Landscape

14.1 Overview

14.2

Overview on criticality of inputs and factors of differentiation

14.3 Landscape disruption

Overview on factors of disruption

14.4 Industry risks

Impact of key risks on business

15. Competitive Analysis

15.1 Companies profiled

Companies covered

15.2 Company ranking index

15.3 Market positioning of companies

Matrix on companies position and classification

15.4 Archer Daniels Midland Co.

Archer Daniels Midland Co. - Overview
Archer Daniels Midland Co. - Business segments
Archer Daniels Midland Co. - Key news
Archer Daniels Midland Co. - Key offerings
Archer Daniels Midland Co. - Segment focus
SWOT

15.5 ATP Group

ATP Group - Overview
ATP Group - Product / Service
ATP Group - Key offerings
SWOT

15.6 Cargill Inc.

Cargill Inc. - Overview
Cargill Inc. - Product / Service
Cargill Inc. - Key offerings
SWOT

15.7 FBC Industries Inc.

FBC Industries Inc. - Overview
FBC Industries Inc. - Product / Service
FBC Industries Inc. - Key offerings
SWOT

15.8 Foodchem International Corp.

Foodchem International Corp. - Overview
Foodchem International Corp. - Product / Service
Foodchem International Corp. - Key offerings
SWOT

15.9 Gadot Biochemical Industries

Gadot Biochemical Industries - Overview
Gadot Biochemical Industries - Product / Service
Gadot Biochemical Industries - Key offerings
SWOT

15.10 Huangshi Xinghua Biochem Co.

Huangshi Xinghua Biochem Co. - Overview
Huangshi Xinghua Biochem Co. - Product / Service
Huangshi Xinghua Biochem Co. - Key offerings
SWOT

15.11 Jungbunzlauer Suisse AG

Jungbunzlauer Suisse AG - Overview
Jungbunzlauer Suisse AG - Product / Service
Jungbunzlauer Suisse AG - Key offerings
SWOT

15.12 RZBC Group Co. Ltd.

RZBC Group Co. Ltd. - Overview
RZBC Group Co. Ltd. - Product / Service
RZBC Group Co. Ltd. - Key offerings
SWOT

15.13 Sigma Aldrich Chemicals Ltd.

Sigma Aldrich Chemicals Ltd. - Overview
Sigma Aldrich Chemicals Ltd. - Product / Service
Sigma Aldrich Chemicals Ltd. - Key offerings
SWOT

15.14 Spectrum Chemical Mfg. Corp.

Spectrum Chemical Mfg. Corp. - Overview
Spectrum Chemical Mfg. Corp. - Product / Service
Spectrum Chemical Mfg. Corp. - Key offerings
SWOT

15.15 Sucroal

Sucroal - Overview
Sucroal - Product / Service
Sucroal - Key offerings
SWOT

15.16 Tokyo Chemical Co. Ltd.

Tokyo Chemical Co. Ltd. - Overview
Tokyo Chemical Co. Ltd. - Product / Service
Tokyo Chemical Co. Ltd. - Key offerings
SWOT

15.17 Weifang Ensign Industry Co.

Weifang Ensign Industry Co. - Overview
Weifang Ensign Industry Co. - Product / Service
Weifang Ensign Industry Co. - Key offerings
SWOT

15.18 Yangzhou Gami Biochem Co.

Yangzhou Gami Biochem Co. - Overview
Yangzhou Gami Biochem Co. - Product / Service
Yangzhou Gami Biochem Co. - Key offerings
SWOT

16. Appendix

16.1 Scope of the report

Market definition
Objectives
Notes and caveats

16.2 Inclusions and exclusions checklist

Inclusions checklist
Exclusions checklist

16.3 Currency conversion rates for US$

16.4 Research methodology

16.5 Data procurement

Information sources

16.6 Data validation

16.7 Validation techniques employed for market sizing

16.8 Data synthesis

16.9 360 degree market analysis

16.10 List of abbreviations

Research Methodology

Technavio presents a detailed picture of the market by way of study, synthesis, and summation of data from multiple sources. The analysts have presented the various facets of the market with a particular focus on identifying the key industry influencers. The data thus presented is comprehensive, reliable, and the result of extensive research, both primary and secondary.

INFORMATION SOURCES

Primary sources

  • Manufacturers and suppliers
  • Channel partners
  • Industry experts
  • Strategic decision makers

Secondary sources

  • Industry journals and periodicals
  • Government data
  • Financial reports of key industry players
  • Historical data
  • Press releases

DATA ANALYSIS

Data Synthesis

  • Collation of data
  • Estimation of key figures
  • Analysis of derived insights

Data Validation

  • Triangulation with data models
  • Reference against proprietary databases
  • Corroboration with industry experts

REPORT WRITING

Qualitative

  • Market drivers
  • Market challenges
  • Market trends
  • Five forces analysis

Quantitative

  • Market size and forecast
  • Market segmentation
  • Geographical insights
  • Competitive landscape

Interested in this report?

Get your sample now to see our research methodology and insights!

Download Now

Frequently Asked Questions

Potassium Citrate market growth will increase by USD 133.4 million during 2026-2030 .

The Potassium Citrate market is expected to grow at a CAGR of 3.2% during 2026-2030 .

Potassium Citrate market is segmented by Application (Acidity regulator, Diuretic, Emulsifier, Antioxidant, Others) End-user (Food and beverage, Pharmaceuticals, Dietary supplements, Personal care, Others) Type (Monohydrate, Anhydrous)

Annexe Chem, Archer Daniels Midland Co., ATP Group, Cargill Inc., FBC Industries Inc., Foodchem International Corp., Gadot Biochemical Industries, Global Calcium Pvt. Ltd., Huangshi Xinghua Biochem Co., Jungbunzlauer Suisse AG, RZBC Group Co. Ltd., Sigma Aldrich Chemicals Ltd., Spectrum Chemical Mfg. Corp., Sucroal, Tokyo Chemical Co. Ltd., Vishal Laboratories, Weifang Ensign Industry Co., Yangzhou Gami Biochem Co. are a few of the key vendors in the Potassium Citrate market.

APAC will register the highest growth rate of 46.3% among the other regions. Therefore, the Potassium Citrate market in APAC is expected to garner significant business opportunities for the vendors during the forecast period.

China, Japan, India, South Korea, Indonesia, Australia, Germany, France, UK, Italy, The Netherlands, Spain, US, Canada, Mexico, Brazil, Argentina, Colombia, Saudi Arabia, UAE, South Africa, Israel, Turkey

  • Escalating prevalence of renal disorders and kidney stones is the driving factor this market.

The Potassium Citrate market vendors should focus on grabbing business opportunities from the Application segment as it accounted for the largest market share in the base year.