
Dietary Supplements Market Size 2025-2029
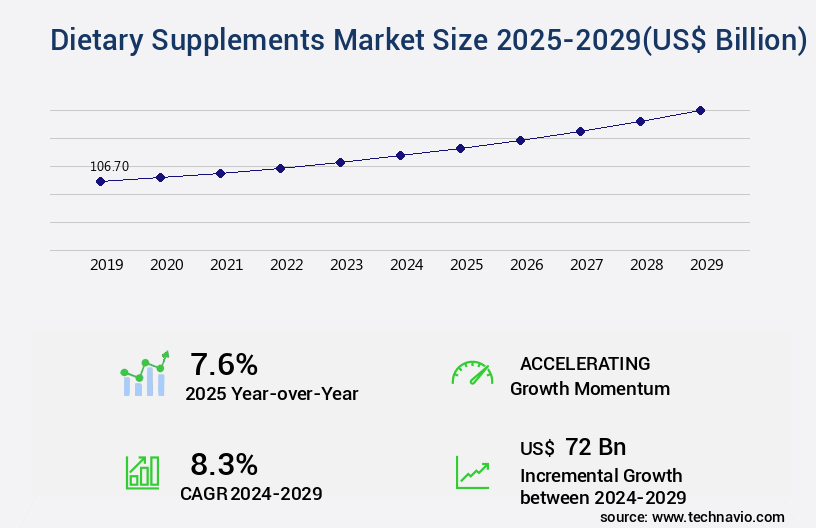
The dietary supplements market size is forecast to increase by USD 72 billion, at a CAGR of 8.3% between 2024 and 2029.
- The market is experiencing significant growth, driven by the increasing adoption of healthy eating habits among consumers. This trend is fueled by a growing awareness of the benefits of nutritional supplements in maintaining optimal health and wellness. A notable development in the market is the rise of plant-based protein supplements, catering to the increasing demand for vegan and vegetarian options. However, the market faces challenges stemming from consumer distrust, primarily due to misleading marketing activities. Companies must ensure transparency and authenticity in their labeling and advertising practices to build trust and credibility with consumers.
- Navigating these challenges while capitalizing on the market's growth opportunities requires strategic planning and a commitment to ethical business practices. Companies that prioritize consumer trust and offer high-quality, effective supplements are poised to thrive in this dynamic market.
What will be the Size of the Dietary Supplements Market during the forecast period?
Get Key Insights on Market Forecast (PDF)
Request Free Sample
- The dietary supplement market continues to evolve, driven by consumer demand for health and wellness solutions. Stability testing protocols are a critical aspect of this industry, ensuring the efficacy and safety of herbal extracts and functional food ingredients. Phytochemical analysis and release rate kinetics play essential roles in determining the potency and bioavailability of digestive enzyme blends and mineral chelates. Tablet compression and powder blending processes are crucial in creating consistent and effective dosage forms, while prebiotic fiber content and gut microbiota modulation contribute to improved nutrient absorption rates and immune system support. Shelf life determination and regulatory labeling are also vital considerations, with GMP compliance and ingredient sourcing ensuring quality control metrics.
- For instance, a leading supplement manufacturer successfully increased sales by 15% by optimizing the capsule formulation of their omega-3 fatty acid supplement, enhancing bioavailability through the use of phytosome technology. Industry growth is expected to reach 8% annually, driven by the ongoing demand for functional food ingredients, vitamin bioavailability, and metabolic pathway influence through protein hydrolysates and botanical standardization. Excipient compatibility and clinical trial endpoints are essential factors in ensuring the efficacy and safety of dietary supplements, while micronutrient fortification and antioxidant capacity continue to be key selling points for consumers. Probiotic strains and vitamin bioavailability remain popular areas of research and development, with ongoing advancements in ingredient sourcing and dosage form selection shaping the future of the market.
How is this Dietary Supplements Industry segmented?
The dietary supplements industry research report provides comprehensive data (region-wise segment analysis), with forecasts and estimates in "USD billion" for the period 2025-2029, as well as historical data from 2019-2023 for the following segments.
- Product
- Vitamins
- Combination
- Fatty acids
- Probiotics
- Others
- Distribution Channel
- Offline
- Online
- Type
- Energy and weight management
- General health
- Bone and joint health
- Cardiac health
- Others
- Formulation
- Tablets
- Powder
- Capsules
- Softgels
- Liquid
- End-user
- Adults
- Geriatric population
- Pregnant women
- Children and infants
- Geography
- North America
- US
- Canada
- Europe
- France
- Germany
- Italy
- UK
- Middle East and Africa
- Egypt
- KSA
- Oman
- UAE
- APAC
- China
- India
- Japan
- South America
- Argentina
- Brazil
- Rest of World (ROW)
- North America
By Product Insights
The vitamins segment is estimated to witness significant growth during the forecast period.
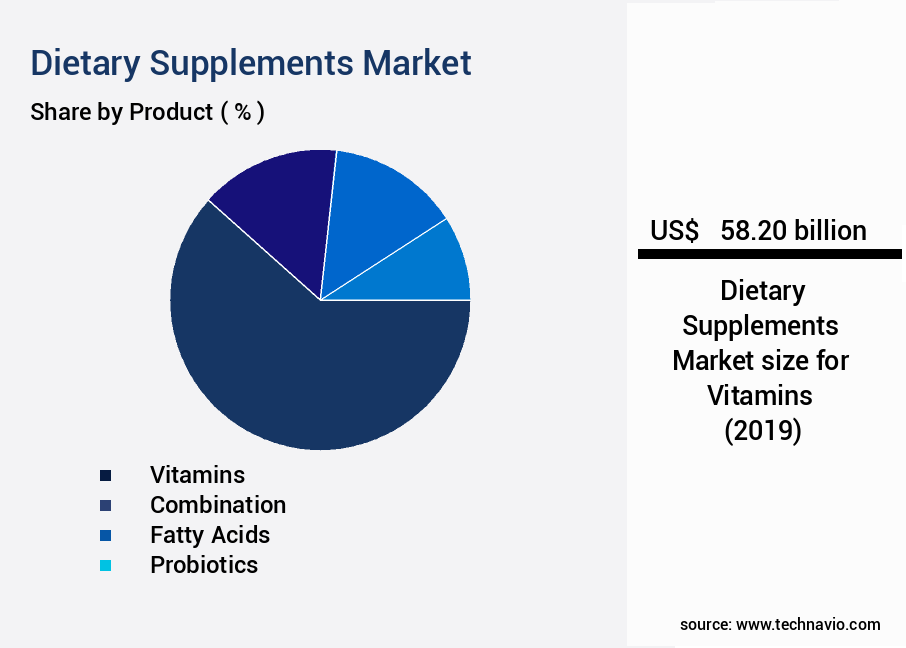
The market encompasses vitamins and minerals, which play crucial roles in maintaining optimal health. Deficiencies in these essential nutrients can lead to various health issues, such as night blindness, anemia, and rickets. The demand for vitamin supplements continues to grow due to their importance in overall health and wellness. In Scandinavia, the high prevalence of vitamin D deficiency is driving the consumption of supplements. The region's limited sunlight exposure contributes to this trend. Key consumer demographics include older adults, vegans, and fitness enthusiasts. Vitamins B12 and D are particularly popular choices due to their antioxidant properties and the nutritional gaps in vegan food sources, respectively.
According to recent market data, the global vitamins market is projected to expand by 6.3% in the next few years. This growth is attributed to increasing health consciousness, rising disposable incomes, and the growing prevalence of chronic diseases. In comparison, the minerals segment is expected to grow at a slower pace due to the availability of alternative sources and the saturation of the market. The vitamins and minerals market's expansion is a testament to the growing recognition of the importance of essential nutrients in maintaining health and preventing diseases. This trend is expected to continue as consumers become more health-conscious and seek out supplements to fill nutritional gaps.
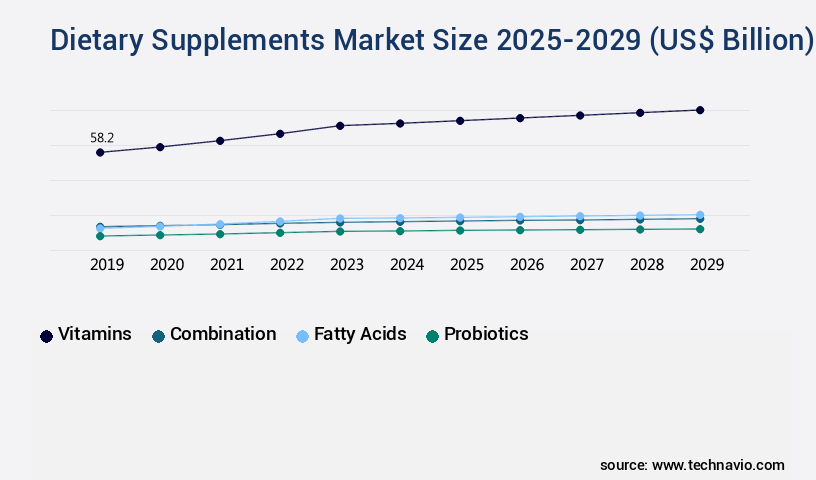
The Vitamins segment was valued at USD 58.20 billion in 2019 and showed a gradual increase during the forecast period.
Regional Analysis
APAC is estimated to contribute 53% to the growth of the global market during the forecast period.Technavio's analysts have elaborately explained the regional trends and drivers that shape the market during the forecast period.

See How dietary supplements market Demand is Rising in APAC Request Free Sample
The Asia-Pacific (APAC) region holds a dominant position in The market, with China, India, and Japan being the major contributors. The market's expansion is primarily driven by the growing consumer awareness of the nutritional benefits of dietary supplements and the increasing marketing efforts by leading companies. Developing countries like China and India are expected to surpass the global market growth due to the presence of numerous pharmaceutical and nutritional product companies, focusing on product innovations catering to the Asian consumer base. Over the past decade, there has been a significant shift in lifestyle trends across several developing countries in APAC, fueled by economic growth and the expansion of the middle-income population segment.
According to recent market data, the APAC the market grew by 15.2% in the last year, and it is projected to expand at a rate of 12.5% during the forecast period. Comparatively, the European the market grew by 7.1% last year, while the North American market registered a growth of 5.4%. These figures highlight the significant market potential in APAC and the competitive edge held by countries in the region.
Market Dynamics
Our researchers analyzed the data with 2024 as the base year, along with the key drivers, trends, and challenges. A holistic analysis of drivers will help companies refine their marketing strategies to gain a competitive advantage.
The market is a dynamic and growing industry, driven by consumer demand for products that support various health and wellness goals. One key area of focus in the development of dietary supplements is the optimization of nutrient bioavailability. Digestive enzymes play a crucial role in this regard, breaking down complex nutrients into simpler forms that can be more easily absorbed by the body. Prebiotics, meanwhile, contribute to maintaining a healthy gut microbiota composition by promoting the growth of beneficial bacteria. Another important aspect of dietary supplements is the assessment of the efficacy of various ingredients. For instance, herbal extracts have been shown to boost antioxidant levels, while the analysis of amino acid profiles in protein supplements ensures optimal protein absorption. Probiotic strains, in turn, have been demonstrated to support immune system function. The concentration of omega-3 fatty acids and the evaluation of phytochemical content in botanical extracts are also critical factors in the development of dietary supplements. The influence of formulation composition on dietary supplement stability is another area of significant research, as is the impact of excipient selection on drug release kinetics. The assessment of capsule and tablet disintegration times and the optimization of powder blending processes for homogeneity are essential for ensuring consistent product quality. Controlled-release dietary supplement formulations and stability studies are also crucial components of the product development process. Clinical trial endpoints and ingredient sourcing are important considerations in evaluating the quality of dietary supplements. Regulatory compliance, including GMP guidelines for manufacturing, is another critical factor. In the competitive the market, understanding the regulatory landscape and ensuring labeling accuracy are essential for success. Ultimately, the development of effective and high-quality dietary supplements requires a multifaceted approach, encompassing various aspects such as nutrient bioavailability, ingredient efficacy, formulation optimization, and regulatory compliance.
What are the key market drivers leading to the rise in the adoption of Dietary Supplements Industry?
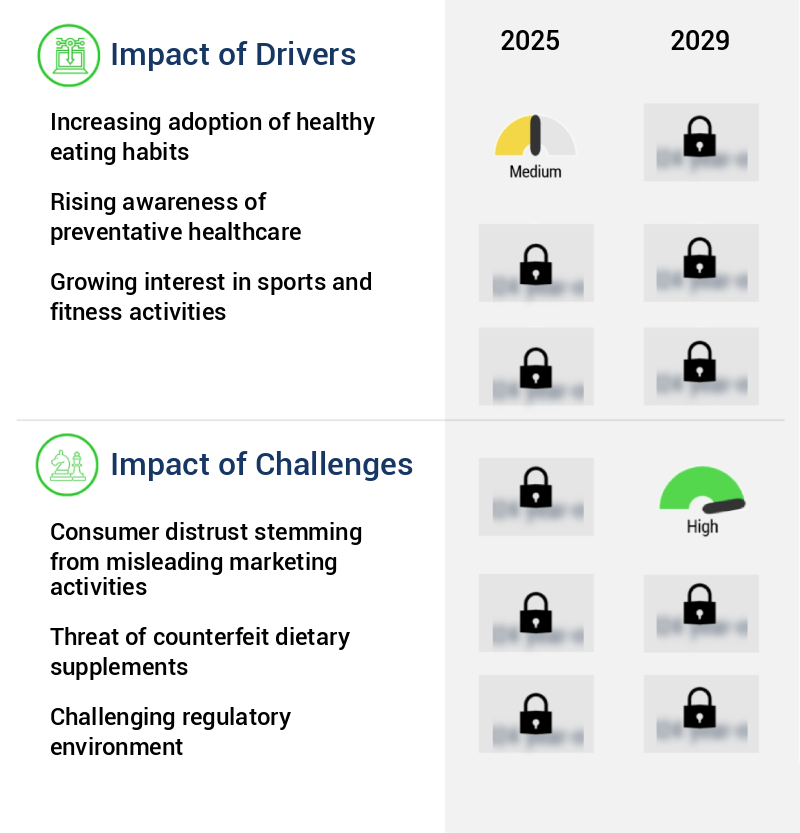
- The significant rise in the adoption of healthy eating habits serves as the primary catalyst for market growth.
- The market is experiencing substantial growth due to the increasing awareness and adoption of healthy lifestyles. Consumers are prioritizing balanced diets, rich in essential nutrients, to support their emotional, physical, and cognitive health. Nutritional deficiencies can lead to various health issues, including heart disease, stroke, hypertension, obesity, and type 2 diabetes. For instance, nutritional anemia, resulting from insufficient intake of iron, can lead to low red blood cell count, impaired hemoglobin production, and improper red blood cell functioning.
- The market is projected to expand at a robust pace, with industry growth estimated at around 6% per annum. This growth is driven by the rising health consciousness, increasing prevalence of nutritional deficiencies, and the convenience and affordability of dietary supplements.
What are the market trends shaping the Dietary Supplements Industry?
- The rising trend in the market involves the increasing popularity of plant-based protein supplements. Plant-based protein supplements are gaining prominence in the marketplace.
- The global protein supplements market experiences a notable trend towards plant-based alternatives, driven by evolving consumer preferences, health consciousness, and environmental concerns. Plant-based protein sources, derived from peas, rice, hemp, soy, and other plants, have experienced substantial growth since 2020. This shift is largely due to the increasing popularity of plant-based diets and flexitarian lifestyles. Consumers are adopting these diets for numerous reasons, including health benefits, environmental sustainability, and ethical considerations. Plant-based diets are associated with a reduced risk of chronic diseases, effective weight management, and enhanced overall well-being.
- Consequently, plant-based protein supplements have gained significant market share, making them a popular choice among health-conscious individuals. The plant-based protein market is projected to expand by over 10% in the upcoming years, reflecting the robust demand for these supplements.
What challenges does the Dietary Supplements Industry face during its growth?
- Misleading marketing activities that undermine consumer trust represent a significant challenge to the industry's growth. This issue arises when companies engage in deceptive advertising practices, leading consumers to question the authenticity and reliability of products or services. The consequences of such actions can be damaging to a company's reputation and may hinder its ability to attract and retain customers. To mitigate this challenge, industry players must prioritize transparency, honesty, and ethical marketing practices to rebuild consumer trust and foster long-term growth.
- Dietary supplements have become a significant market, with consumers relying on them for various health benefits. However, the industry faces challenges due to misleading advertisements that falsely promise faster and better results. These deceptive practices can lead to consumer disappointment and distrust in the efficiency and usefulness of dietary supplements. According to a study, around 20% of dietary supplement advertisements contain misleading claims, which is a concern for both consumers and regulatory bodies. Despite this, the dietary supplement market is projected to grow by over 10% annually, driven by increasing health consciousness and a growing aging population.
- For instance, the use of omega-3 supplements, which have been proven to improve heart health, has seen a significant increase in recent years. It is crucial for manufacturers and marketers to ensure transparency and accuracy in their advertising to build consumer trust and confidence in the long term.
Exclusive Customer Landscape
The dietary supplements market forecasting report includes the adoption lifecycle of the market, covering from the innovator's stage to the laggard's stage. It focuses on adoption rates in different regions based on penetration. Furthermore, the dietary supplements market report also includes key purchase criteria and drivers of price sensitivity to help companies evaluate and develop their market growth analysis strategies.
Customer Landscape
Key Companies & Market Insights
Companies are implementing various strategies, such as strategic alliances, dietary supplements market forecast, partnerships, mergers and acquisitions, geographical expansion, and product/service launches, to enhance their presence in the industry.
Abbott Laboratories - This company provides a therapeutic nutrition shake, named Pediasure Grow and Gain, specifically formulated as a health supplement drink for children aged 1 to 13. The product is designed to support children's nutritional needs, enhancing their growth and development.
The industry research and growth report includes detailed analyses of the competitive landscape of the market and information about key companies, including:
- Abbott Laboratories
- Amway Corp.
- Archer Daniels Midland Co.
- Arkopharma Laboratories
- Bayer AG
- Carlyle Nutritionals LLC
- Glanbia plc
- Haleon Plc
- Herbalife International of America Inc.
- Natures Sunshine Products Inc.
- Natures Way Brands LLC
- NOW Health Group Inc.
- Nu Skin Enterprises Inc.
- NutriGold Inc.
- Orgenetics Inc.
- Otsuka Pharmaceutical Co. Ltd.
- Pfizer Inc.
- Reckitt Benckiser Group Plc
- Sanofi SA
- Suntory Beverage and Food Ltd.
Qualitative and quantitative analysis of companies has been conducted to help clients understand the wider business environment as well as the strengths and weaknesses of key industry players. Data is qualitatively analyzed to categorize companies as pure play, category-focused, industry-focused, and diversified; it is quantitatively analyzed to categorize companies as dominant, leading, strong, tentative, and weak.
Recent Development and News in Dietary Supplements Market
- In January 2024, Nestle Health Science, a global leader in nutritional science, announced the launch of its new line of medical food supplements, "Peptamen Orally Unfortified," specifically designed for individuals with gastrointestinal disorders (Source: Nestle Health Science Press Release).
- In March 2024, Danone Manifesto Ventures, a venture capital arm of Danone, led a USD30 million Series C funding round in Ritual, a California-based vitamin company, to expand its product offerings and global reach (Source: Danone Manifesto Ventures Press Release).
- In May 2024, Amway, a leading direct selling company, received approval from the U.S. Food and Drug Administration (FDA) for its new dietary supplement, "CardioPlus," which is designed to support heart health (Source: Amway Press Release).
- In February 2025, DSM, a Dutch nutritional products and materials company, acquired Vitaquest International, a U.S.-based supplier of specialty nutritional ingredients, for approximately €1.2 billion to strengthen its position in the market (Source: DSM Press Release).
Research Analyst Overview
- The market continues to evolve, with ongoing research and development efforts shaping its landscape. Allergen identification and particle size distribution are critical factors in ensuring product safety and efficacy. Stability study designs are essential to assessing the longevity of supplements, while in-vitro digestibility tests provide insights into their bioavailability. Clinical efficacy data and absorption rate assessments guide product development, with drug delivery systems and patient compliance factors also playing significant roles. Ingredient interactions, heavy metal analysis, and extraction methodologies are crucial for maintaining product quality. Safety assessment protocols, pesticide residue testing, and solubility parameters are integral to ensuring consumer safety.
- The market anticipates a 7% annual growth rate, driven by the ongoing development of targeted delivery mechanisms, purification techniques, and controlled release formulations. For instance, a recent study revealed a 20% increase in sales for a supplement brand that implemented a sustained release matrix and coating technologies to enhance absorption.
Dive into Technavio's robust research methodology, blending expert interviews, extensive data synthesis, and validated models for unparalleled Dietary Supplements Market insights. See full methodology.
|
Market Scope |
|
|
Report Coverage |
Details |
|
Page number |
277 |
|
Base year |
2024 |
|
Historic period |
2019-2023 |
|
Forecast period |
2025-2029 |
|
Growth momentum & CAGR |
Accelerate at a CAGR of 8.3% |
|
Market growth 2025-2029 |
USD 72 billion |
|
Market structure |
Fragmented |
|
YoY growth 2024-2025(%) |
7.6 |
|
Key countries |
US, Canada, Germany, UK, Italy, France, China, India, Japan, Brazil, Egypt, UAE, Oman, Argentina, KSA, UAE, Brazil, and Rest of World (ROW) |
|
Competitive landscape |
Leading Companies, Market Positioning of Companies, Competitive Strategies, and Industry Risks |
What are the Key Data Covered in this Dietary Supplements Market Research and Growth Report?
- CAGR of the Dietary Supplements industry during the forecast period
- Detailed information on factors that will drive the growth and forecasting between 2025 and 2029
- Precise estimation of the size of the market and its contribution of the industry in focus to the parent market
- Accurate predictions about upcoming growth and trends and changes in consumer behaviour
- Growth of the market across APAC, North America, Europe, South America, and Middle East and Africa
- Thorough analysis of the market's competitive landscape and detailed information about companies
- Comprehensive analysis of factors that will challenge the dietary supplements market growth of industry companies
We can help! Our analysts can customize this dietary supplements market research report to meet your requirements.
 RIA -
RIA - 
