Sports Drink Market Size 2025-2029
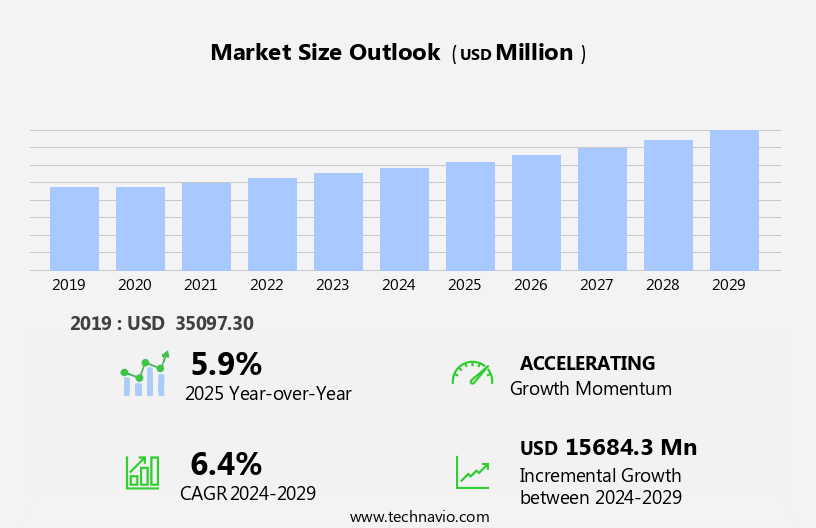
The sports drink market size is forecast to increase by USD 15.68 billion at a CAGR of 6.4% between 2024 and 2029.
- The market is experiencing significant growth, driven by the increasing consumer focus on health and wellness. With the global population becoming more health-conscious, there is a rising demand for hydration products that offer added nutritional benefits. Changing consumer demographics, particularly the millennial and Gen Z generations, are fueling this trend, as they prioritize fitness and an active lifestyle. However, the market is not without challenges. The threat from other health and wellness products, such as functional beverages and nutritional supplements, is intensifying.
- These competitors offer similar health benefits but may be perceived as more natural or convenient alternatives. To capitalize on market opportunities and navigate challenges effectively, companies in the market must focus on product innovation, targeted marketing, and strategic partnerships. By addressing consumer preferences and staying ahead of competitors, market players can differentiate themselves and maintain a strong market position.
What will be the Size of the Sports Drink Market during the forecast period?

Request Free Sample
- The market in the United States continues to experience strong growth, driven by consumer preferences for convenient, nutrient-dense beverages that support mental focus, muscle recovery, and hydration during physical activity. Fruit juices and natural flavors remain popular choices, while sugar alternatives and environmental sustainability are key trends shaping the market. Brands are also leveraging social media marketing, influencer partnerships, and data-driven marketing strategies to connect with their target audience. Sports drinks provide essential electrolytes, vitamins, and energy to fuel strength training and endurance capacity, making them a staple in the fitness industry. Brands are investing in product innovation, including absorption rate technology, artificial intelligence, and personalized nutrition, to optimize performance and cater to evolving consumer needs.
- Social responsibility and brand reputation are increasingly important considerations, with companies focusing on recyclable packaging, loyalty programs, and strategic partnerships with sports medicine professionals and fitness organizations. As consumer expectations for transparency and value proposition continue to rise, sports drink brands must prioritize customer satisfaction, post-workout recovery, and cognitive function to maintain market share.
How is this Sports Drink Industry segmented?
The sports drink industry research report provides comprehensive data (region-wise segment analysis), with forecasts and estimates in "USD million" for the period 2025-2029, as well as historical data from 2019-2023 for the following segments.
- Distribution Channel
- Packaging
- Product Type
- Isotonic drinks
- Hypotonic drinks
- Hypertonic drinks
- End-user
- Fitness enthusiasts and general consumers
- Athletes and sports professionals
- Lifestyle users
- Geography
- APAC
- Australia
- China
- India
- Japan
- South Korea
- North America
- Europe
- South America
- Middle East and Africa
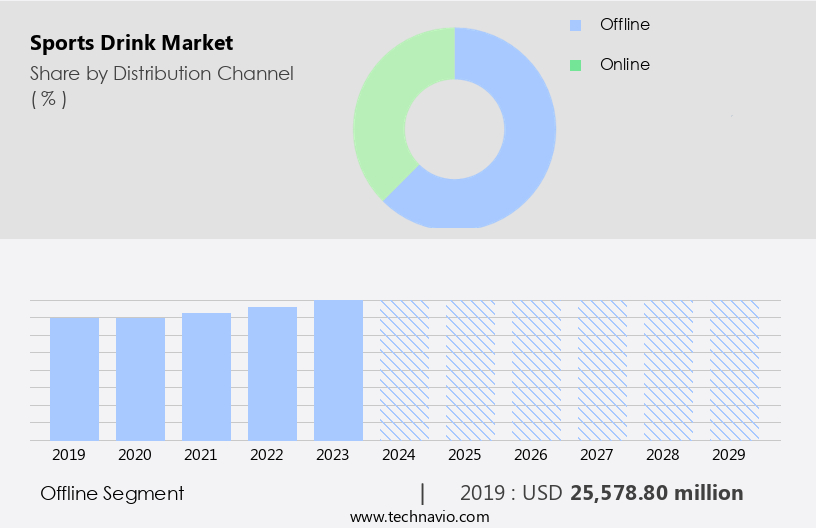
By Distribution Channel Insights
The offline segment is estimated to witness significant growth during the forecast period. The market primarily relies on offline distribution channels, including retail formats such as specialty stores, hypermarkets, supermarkets, convenience stores, and warehouse clubs. These channels account for a significant portion of the market's revenue, with hypermarkets, supermarkets, and department stores being major contributors due to their extensive product offerings and promotional deals. The penetration of organized retail stores has significantly boosted sales of sports drinks, with many retailers dedicating separate sections to these beverages. Consumer insights reveal that health-conscious individuals, including fitness enthusiasts, endurance athletes, and recreational athletes, are the primary buyers of sports drinks. They seek scientific validation through clinical studies, natural ingredients, and low sugar content in their beverage choices.
Innovation pipelines focus on sugar-free options, organic certification, vegan alternatives, and functional food ingredients to cater to diverse consumer demographics and dietary restrictions. Product development prioritizes taste preferences, shelf life, and personalized nutrition. Marketing strategies highlight performance enhancement, isotonic beverages, and carbohydrate electrolyte solutions for electrolyte replacement. Price sensitivity and brand loyalty also influence sales, with smart packaging and product innovation playing essential roles in brand awareness and differentiation. Additionally, distribution channels prioritize dehydration prevention, calorie content, and ingredient blends to cater to various lifestyle trends and consumer health concerns. Data analytics and consumer demographics continue to shape the value perception of sports drinks in the market.

Get a glance at the market report of share of various segments Request Free Sample
The Offline segment was valued at USD 25.58 billion in 2019 and showed a gradual increase during the forecast period.
Regional Analysis
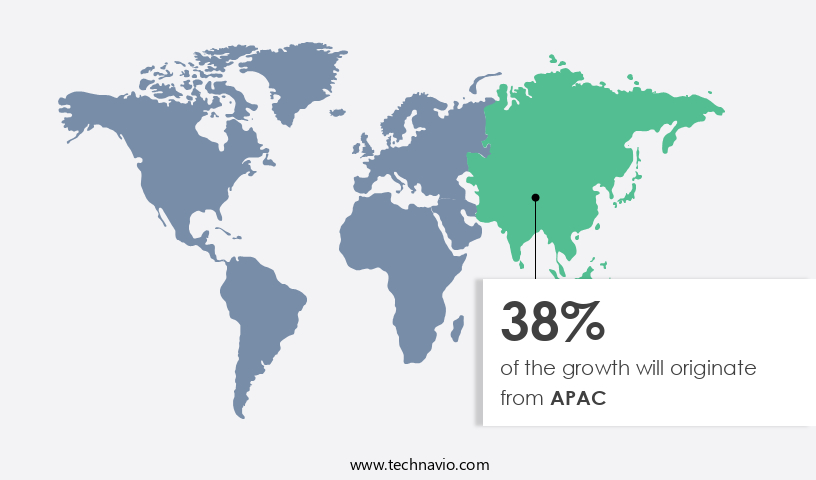
APAC is estimated to contribute 38% to the growth of the global market during the forecast period. Technavio's analysts have elaborately explained the regional trends and drivers that shape the market during the forecast period.

For more insights on the market size of various regions, Request Free Sample
The market in APAC is experiencing significant growth due to increasing consumer awareness towards proactive personal healthcare and the rising number of individuals adopting an active lifestyle. Clinical studies validating the benefits of sports drinks for athletic performance and muscle recovery have fueled demand for these beverages. Consumers, particularly fitness enthusiasts and endurance athletes, seek out options that cater to their dietary restrictions, such as sugar-free, organic certification, vegan, and low-sodium alternatives. The innovation pipeline includes natural ingredient-based formulations, functional beverages, and smart packaging solutions. Health-conscious consumers prioritize taste preferences, calorie content, and ingredient blends. Sodium content and carbohydrate electrolyte solutions are essential for electrolyte replacement during intense workouts.
Brand awareness and marketing strategies targeting millennial and Gen Z consumers, as well as professional athletes, contribute to the market's growth. Supply chain management and ingredient sourcing are crucial aspects of the industry, ensuring shelf life, personalized nutrition, and performance enhancement. Data analytics and consumer insights help companies tailor their offerings to meet the evolving needs and lifestyle trends of their customer base. Online and retail sales channels continue to dominate the market, with price sensitivity and brand loyalty playing key roles in consumer decision-making.
Market Dynamics
Our researchers analyzed the data with 2024 as the base year, along with the key drivers, trends, and challenges. A holistic analysis of drivers will help companies refine their marketing strategies to gain a competitive advantage.
What are the key market drivers leading to the rise in the adoption of Sports Drink Industry?
- Consumer focus on health and wellness is the key driver of the market. The health and wellness trend has gained prominence among consumers, driven by rising healthcare costs and an aging population. With increasing life expectancy comes a higher incidence of chronic diseases. In response, consumers seek convenient and affordable ways to maintain their health. Sports drinks, which contain carbohydrates, electrolytes, vitamins, and nutrients, offer a nutritious option for those looking to enhance their well-being. Manufacturers and retailers can capitalize on this consumer trend by offering sports drinks as a healthier alternative to energy drinks, which are often rich in stimulants like caffeine, guarana, and herbal supplements.
- While energy drinks can help improve productivity and provide essential nutrients, they may not be the best choice for those seeking a healthier lifestyle. Sports drinks, on the other hand, offer a more balanced approach to health and energy.
What are the market trends shaping the Sports Drink Industry?
- Changing consumer demographics is the upcoming market trend. The market is experiencing significant growth due to demographic changes and increasing health consciousness. With urbanization leading to higher disposable incomes, consumers are adopting new lifestyle habits, including regular exercise and a more active lifestyle. This shift in consumer behavior, coupled with the growing awareness of the benefits of sports drinks for hydration and nutrient replenishment during workouts, is driving market growth. Additionally, the increasing working population and hectic schedules have resulted in a decrease in home-cooked meals and an increase in the consumption of ready-to-eat and processed foods.
- The adverse effects of these food choices on health have led consumers to seek healthier alternatives, making sports drinks an attractive option. Overall, these factors are expected to contribute to the growth of the market during the forecast period.
What challenges does the Sports Drink Industry face during its growth?
- Threat from other health and wellness products is a key challenge affecting the industry's growth. The market faces significant challenges due to the availability of effective alternatives, such as protein shakes or smoothies, supplementary tablets, and energy drinks or powders. These options offer more natural and direct nutrition, and in some cases, align better with health and wellness trends. Additionally, consumers are increasingly prioritizing reducing their sugar intake, leading to a preference for beverages and supplements with minimal or no artificial sweeteners.
- Sports drinks, which are typically carbonated and contain sugar, may not meet these evolving consumer preferences. To remain competitive, market participants must adapt by offering more natural, low-sugar, and plant-based alternatives. This shift could potentially open new opportunities for growth in the market.
Exclusive Customer Landscape
The sports drink market forecasting report includes the adoption lifecycle of the market, covering from the innovator's stage to the laggard's stage. It focuses on adoption rates in different regions based on penetration. Furthermore, the sports drink market report also includes key purchase criteria and drivers of price sensitivity to help companies evaluate and develop their market growth analysis strategies.
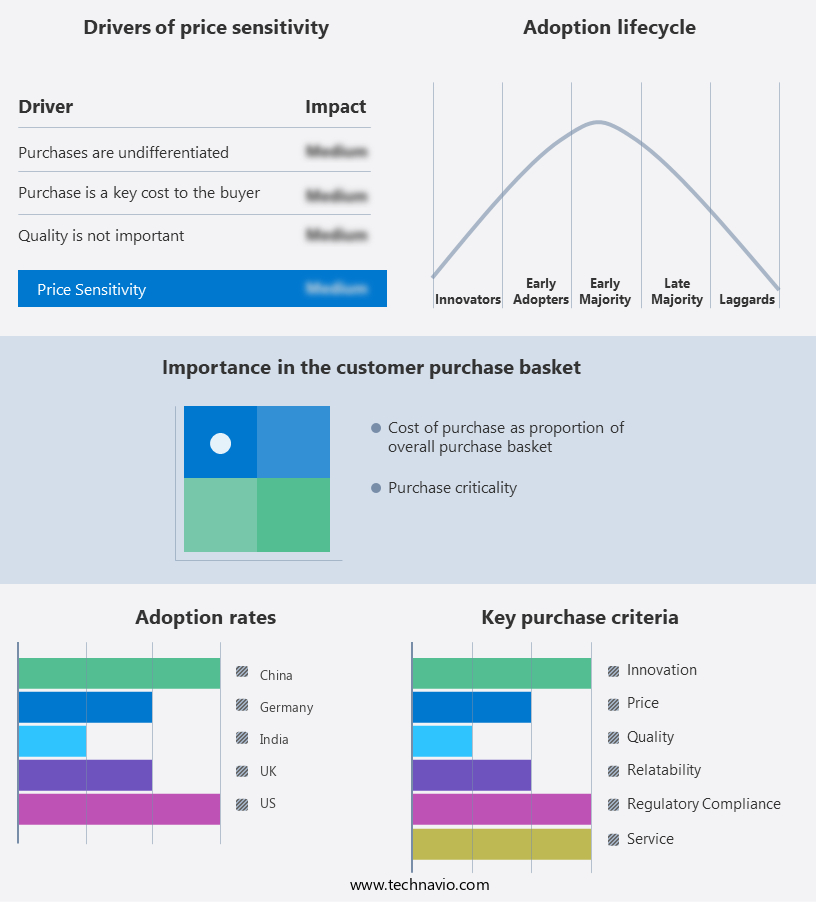
Customer Landscape
Key Companies & Market Insights
Companies are implementing various strategies, such as strategic alliances, sports drink market forecast, partnerships, mergers and acquisitions, geographical expansion, and product/service launches, to enhance their presence in the industry.
Abbott Laboratories - The company offers sports drinks such as Pedialyte Sport.
The industry research and growth report includes detailed analyses of the competitive landscape of the market and information about key companies, including:
- Abbott Laboratories
- Acli Mate
- Active Nutrition International GmbH
- Ajinomoto Co. Inc.
- All Sport
- Biosteel Sports Inc.
- Britvic plc
- Cipla Inc.
- Danone SA
- Decathlon SA
- Gujarat Cooperative Milk Marketing Federation Ltd.
- MyDrink Beverages
- Nestle SA
- Otsuka Pharmaceutical Co Ltd.
- PepsiCo Inc.
- Steric Trading Pty Ltd.
- Suntory Beverage and Food Ltd.
- The Coca Cola Co.
- The Kraft Heinz Co.
Qualitative and quantitative analysis of companies has been conducted to help clients understand the wider business environment as well as the strengths and weaknesses of key industry players. Data is qualitatively analyzed to categorize companies as pure play, category-focused, industry-focused, and diversified; it is quantitatively analyzed to categorize companies as dominant, leading, strong, tentative, and weak.
Research Analyst Overview
The market continues to evolve, driven by consumer preferences for beverages that support an active lifestyle and enhance athletic performance. Fitness enthusiasts, endurance athletes, and recreational athletes alike seek out beverages that provide essential nutrients for optimal hydration and energy. Science plays a crucial role in the development of sports drinks, with a focus on clinical studies and scientific validation to support product claims. Innovation in the pipeline includes sugar-free options, natural ingredients, organic certification, and vegan alternatives, catering to various dietary restrictions and taste preferences. Packaging formats have also evolved to meet consumer demands, with an emphasis on smart packaging, longer shelf life, and personalized nutrition.
Sodium content, carbohydrate electrolyte solutions, and isotonic beverages remain key components of sports drinks, providing essential electrolytes for dehydration prevention and muscle recovery. Consumer insights reveal that health concerns, value perception, and brand loyalty are significant factors in the market. Millennial and Gen Z consumers, in particular, prioritize natural ingredients, functional food, and transparency in sourcing and manufacturing processes. Marketing strategies for sports drinks focus on performance enhancement, energy boost, and wellness trends. Functional beverages and energy drinks have gained popularity, offering consumers additional benefits beyond basic hydration. Brand awareness and distribution channels are essential for success in the market.
Online sales and retail sales channels cater to the diverse needs of consumers, with a focus on convenience and accessibility. Data analytics and consumer demographics play a crucial role in comprehending market trends and consumer preferences. Price sensitivity and brand loyalty are also key factors, with consumers seeking out cost-effective options and loyal brands that align with their values and lifestyle. In the realm of sports nutrition, sports drinks offer a convenient and effective solution for consumers seeking to optimize their performance and support their active lifestyle. The market continues to innovate, with a focus on natural ingredients, functional benefits, and sustainable practices.
|
Market Scope
|
|
Report Coverage
|
Details
|
|
Page number
|
238
|
|
Base year
|
2024
|
|
Historic period
|
2019-2023 |
|
Forecast period
|
2025-2029
|
|
Growth momentum & CAGR
|
Accelerate at a CAGR of 6.4%
|
|
Market growth 2025-2029
|
USD 15.68 billion
|
|
Market structure
|
Fragmented
|
|
YoY growth 2024-2025(%)
|
5.9
|
|
Key countries
|
US, China, Canada, India, Japan, UK, Germany, South Korea, France, and Australia
|
|
Competitive landscape
|
Leading Companies, Market Positioning of Companies, Competitive Strategies, and Industry Risks
|
Request Free Sample
What are the Key Data Covered in this Sports Drink Market Research and Growth Report?
- CAGR of the Sports Drink industry during the forecast period
- Detailed information on factors that will drive the growth and forecasting between 2025 and 2029
- Precise estimation of the size of the market and its contribution of the industry in focus to the parent market
- Accurate predictions about upcoming growth and trends and changes in consumer behaviour
- Growth of the market across APAC, North America, Europe, South America, and Middle East and Africa
- Thorough analysis of the market's competitive landscape and detailed information about companies
- Comprehensive analysis of factors that will challenge the sports drink market growth and forecasting
We can help! Our analysts can customize this sports drink market research report to meet your requirements.
Get in touch
1 Executive Summary
- 1.1 Market overview
- Executive Summary - Chart on Market Overview
- Executive Summary - Data Table on Market Overview
- Executive Summary - Chart on Global Market Characteristics
- Executive Summary - Chart on Market by Geography
- Executive Summary - Chart on Market Segmentation by Distribution Channel
- Executive Summary - Chart on Market Segmentation by Packaging
- Executive Summary - Chart on Market Segmentation by Product Type
- Executive Summary - Chart on Market Segmentation by End-user
- Executive Summary - Chart on Incremental Growth
- Executive Summary - Data Table on Incremental Growth
- Executive Summary - Chart on Company Market Positioning
2 Technavio Analysis
- 2.1 Analysis of price sensitivity, lifecycle, customer purchase basket, adoption rates, and purchase criteria
- Analysis of price sensitivity, lifecycle, customer purchase basket, adoption rates, and purchase criteria
- 2.2 Criticality of inputs and Factors of differentiation
- Overview on criticality of inputs and factors of differentiation
- 2.3 Factors of disruption
- Overview on factors of disruption
- 2.4 Impact of drivers and challenges
- Impact of drivers and challenges in 2024 and 2029
3 Market Landscape
- 3.1 Market ecosystem
- Parent Market
- Data Table on - Parent Market
- 3.2 Market characteristics
- Market characteristics analysis
4 Market Sizing
- 4.1 Market definition
- Offerings of companies included in the market definition
- 4.2 Market segment analysis
- 4.4 Market outlook: Forecast for 2024-2029
- Chart on Global - Market size and forecast 2024-2029 ($ million)
- Data Table on Global - Market size and forecast 2024-2029 ($ million)
- Chart on Global Market: Year-over-year growth 2024-2029 (%)
- Data Table on Global Market: Year-over-year growth 2024-2029 (%)
5 Historic Market Size
- 5.1 Global Sports Drink Market 2019 - 2023
- Historic Market Size - Data Table on Global Sports Drink Market 2019 - 2023 ($ million)
- 5.2 Distribution Channel segment analysis 2019 - 2023
- Historic Market Size - Distribution Channel Segment 2019 - 2023 ($ million)
- 5.3 Packaging segment analysis 2019 - 2023
- Historic Market Size - Packaging Segment 2019 - 2023 ($ million)
- 5.4 Product Type segment analysis 2019 - 2023
- Historic Market Size - Product Type Segment 2019 - 2023 ($ million)
- 5.5 End-user segment analysis 2019 - 2023
- Historic Market Size - End-user Segment 2019 - 2023 ($ million)
- 5.6 Geography segment analysis 2019 - 2023
- Historic Market Size - Geography Segment 2019 - 2023 ($ million)
- 5.7 Country segment analysis 2019 - 2023
- Historic Market Size - Country Segment 2019 - 2023 ($ million)
6 Qualitative Analysis
- 6.1 Impact of AI on global sports drink market
7 Five Forces Analysis
- 7.1 Five forces summary
- Five forces analysis - Comparison between 2024 and 2029
- 7.2 Bargaining power of buyers
- Bargaining power of buyers - Impact of key factors 2024 and 2029
- 7.3 Bargaining power of suppliers
- Bargaining power of suppliers - Impact of key factors in 2024 and 2029
- 7.4 Threat of new entrants
- Threat of new entrants - Impact of key factors in 2024 and 2029
- 7.5 Threat of substitutes
- Threat of substitutes - Impact of key factors in 2024 and 2029
- 7.6 Threat of rivalry
- Threat of rivalry - Impact of key factors in 2024 and 2029
- 7.7 Market condition
- Chart on Market condition - Five forces 2024 and 2029
8 Market Segmentation by Distribution Channel
- 8.1 Market segments
- Chart on Distribution Channel - Market share 2024-2029 (%)
- Data Table on Distribution Channel - Market share 2024-2029 (%)
- 8.2 Comparison by Distribution Channel
- Chart on Comparison by Distribution Channel
- Data Table on Comparison by Distribution Channel
- 8.3 Offline - Market size and forecast 2024-2029
- Chart on Offline - Market size and forecast 2024-2029 ($ million)
- Data Table on Offline - Market size and forecast 2024-2029 ($ million)
- Chart on Offline - Year-over-year growth 2024-2029 (%)
- Data Table on Offline - Year-over-year growth 2024-2029 (%)
- 8.4 Online - Market size and forecast 2024-2029
- Chart on Online - Market size and forecast 2024-2029 ($ million)
- Data Table on Online - Market size and forecast 2024-2029 ($ million)
- Chart on Online - Year-over-year growth 2024-2029 (%)
- Data Table on Online - Year-over-year growth 2024-2029 (%)
- 8.5 Market opportunity by Distribution Channel
- Market opportunity by Distribution Channel ($ million)
- Data Table on Market opportunity by Distribution Channel ($ million)
9 Market Segmentation by Packaging
- 9.1 Market segments
- Chart on Packaging - Market share 2024-2029 (%)
- Data Table on Packaging - Market share 2024-2029 (%)
- 9.2 Comparison by Packaging
- Chart on Comparison by Packaging
- Data Table on Comparison by Packaging
- 9.3 PET bottles - Market size and forecast 2024-2029
- Chart on PET bottles - Market size and forecast 2024-2029 ($ million)
- Data Table on PET bottles - Market size and forecast 2024-2029 ($ million)
- Chart on PET bottles - Year-over-year growth 2024-2029 (%)
- Data Table on PET bottles - Year-over-year growth 2024-2029 (%)
- 9.4 Cans - Market size and forecast 2024-2029
- Chart on Cans - Market size and forecast 2024-2029 ($ million)
- Data Table on Cans - Market size and forecast 2024-2029 ($ million)
- Chart on Cans - Year-over-year growth 2024-2029 (%)
- Data Table on Cans - Year-over-year growth 2024-2029 (%)
- 9.5 Market opportunity by Packaging
- Market opportunity by Packaging ($ million)
- Data Table on Market opportunity by Packaging ($ million)
10 Market Segmentation by Product Type
- 10.1 Market segments
- Chart on Product Type - Market share 2024-2029 (%)
- Data Table on Product Type - Market share 2024-2029 (%)
- 10.2 Comparison by Product Type
- Chart on Comparison by Product Type
- Data Table on Comparison by Product Type
- 10.3 Isotonic drinks - Market size and forecast 2024-2029
- Chart on Isotonic drinks - Market size and forecast 2024-2029 ($ million)
- Data Table on Isotonic drinks - Market size and forecast 2024-2029 ($ million)
- Chart on Isotonic drinks - Year-over-year growth 2024-2029 (%)
- Data Table on Isotonic drinks - Year-over-year growth 2024-2029 (%)
- 10.4 Hypotonic drinks - Market size and forecast 2024-2029
- Chart on Hypotonic drinks - Market size and forecast 2024-2029 ($ million)
- Data Table on Hypotonic drinks - Market size and forecast 2024-2029 ($ million)
- Chart on Hypotonic drinks - Year-over-year growth 2024-2029 (%)
- Data Table on Hypotonic drinks - Year-over-year growth 2024-2029 (%)
- 10.5 Hypertonic drinks - Market size and forecast 2024-2029
- Chart on Hypertonic drinks - Market size and forecast 2024-2029 ($ million)
- Data Table on Hypertonic drinks - Market size and forecast 2024-2029 ($ million)
- Chart on Hypertonic drinks - Year-over-year growth 2024-2029 (%)
- Data Table on Hypertonic drinks - Year-over-year growth 2024-2029 (%)
- 10.6 Market opportunity by Product Type
- Market opportunity by Product Type ($ million)
- Data Table on Market opportunity by Product Type ($ million)
11 Market Segmentation by End-user
- 11.1 Market segments
- Chart on End-user - Market share 2024-2029 (%)
- Data Table on End-user - Market share 2024-2029 (%)
- 11.2 Comparison by End-user
- Chart on Comparison by End-user
- Data Table on Comparison by End-user
- 11.3 Fitness enthusiasts and general consumers - Market size and forecast 2024-2029
- Chart on Fitness enthusiasts and general consumers - Market size and forecast 2024-2029 ($ million)
- Data Table on Fitness enthusiasts and general consumers - Market size and forecast 2024-2029 ($ million)
- Chart on Fitness enthusiasts and general consumers - Year-over-year growth 2024-2029 (%)
- Data Table on Fitness enthusiasts and general consumers - Year-over-year growth 2024-2029 (%)
- 11.4 Athletes and sports professionals - Market size and forecast 2024-2029
- Chart on Athletes and sports professionals - Market size and forecast 2024-2029 ($ million)
- Data Table on Athletes and sports professionals - Market size and forecast 2024-2029 ($ million)
- Chart on Athletes and sports professionals - Year-over-year growth 2024-2029 (%)
- Data Table on Athletes and sports professionals - Year-over-year growth 2024-2029 (%)
- 11.5 Lifestyle users - Market size and forecast 2024-2029
- Chart on Lifestyle users - Market size and forecast 2024-2029 ($ million)
- Data Table on Lifestyle users - Market size and forecast 2024-2029 ($ million)
- Chart on Lifestyle users - Year-over-year growth 2024-2029 (%)
- Data Table on Lifestyle users - Year-over-year growth 2024-2029 (%)
- 11.6 Market opportunity by End-user
- Market opportunity by End-user ($ million)
- Data Table on Market opportunity by End-user ($ million)
12 Customer Landscape
- 12.1 Customer landscape overview
- Analysis of price sensitivity, lifecycle, customer purchase basket, adoption rates, and purchase criteria
13 Geographic Landscape
- 13.1 Geographic segmentation
- Chart on Market share by geography 2024-2029 (%)
- Data Table on Market share by geography 2024-2029 (%)
- 13.2 Geographic comparison
- Chart on Geographic comparison
- Data Table on Geographic comparison
- 13.3 APAC - Market size and forecast 2024-2029
- Chart on APAC - Market size and forecast 2024-2029 ($ million)
- Data Table on APAC - Market size and forecast 2024-2029 ($ million)
- Chart on APAC - Year-over-year growth 2024-2029 (%)
- Data Table on APAC - Year-over-year growth 2024-2029 (%)
- 13.4 North America - Market size and forecast 2024-2029
- Chart on North America - Market size and forecast 2024-2029 ($ million)
- Data Table on North America - Market size and forecast 2024-2029 ($ million)
- Chart on North America - Year-over-year growth 2024-2029 (%)
- Data Table on North America - Year-over-year growth 2024-2029 (%)
- 13.5 Europe - Market size and forecast 2024-2029
- Chart on Europe - Market size and forecast 2024-2029 ($ million)
- Data Table on Europe - Market size and forecast 2024-2029 ($ million)
- Chart on Europe - Year-over-year growth 2024-2029 (%)
- Data Table on Europe - Year-over-year growth 2024-2029 (%)
- 13.6 South America - Market size and forecast 2024-2029
- Chart on South America - Market size and forecast 2024-2029 ($ million)
- Data Table on South America - Market size and forecast 2024-2029 ($ million)
- Chart on South America - Year-over-year growth 2024-2029 (%)
- Data Table on South America - Year-over-year growth 2024-2029 (%)
- 13.7 Middle East and Africa - Market size and forecast 2024-2029
- Chart on Middle East and Africa - Market size and forecast 2024-2029 ($ million)
- Data Table on Middle East and Africa - Market size and forecast 2024-2029 ($ million)
- Chart on Middle East and Africa - Year-over-year growth 2024-2029 (%)
- Data Table on Middle East and Africa - Year-over-year growth 2024-2029 (%)
- 13.8 US - Market size and forecast 2024-2029
- Chart on US - Market size and forecast 2024-2029 ($ million)
- Data Table on US - Market size and forecast 2024-2029 ($ million)
- Chart on US - Year-over-year growth 2024-2029 (%)
- Data Table on US - Year-over-year growth 2024-2029 (%)
- 13.9 China - Market size and forecast 2024-2029
- Chart on China - Market size and forecast 2024-2029 ($ million)
- Data Table on China - Market size and forecast 2024-2029 ($ million)
- Chart on China - Year-over-year growth 2024-2029 (%)
- Data Table on China - Year-over-year growth 2024-2029 (%)
- 13.10 Canada - Market size and forecast 2024-2029
- Chart on Canada - Market size and forecast 2024-2029 ($ million)
- Data Table on Canada - Market size and forecast 2024-2029 ($ million)
- Chart on Canada - Year-over-year growth 2024-2029 (%)
- Data Table on Canada - Year-over-year growth 2024-2029 (%)
- 13.11 India - Market size and forecast 2024-2029
- Chart on India - Market size and forecast 2024-2029 ($ million)
- Data Table on India - Market size and forecast 2024-2029 ($ million)
- Chart on India - Year-over-year growth 2024-2029 (%)
- Data Table on India - Year-over-year growth 2024-2029 (%)
- 13.12 Japan - Market size and forecast 2024-2029
- Chart on Japan - Market size and forecast 2024-2029 ($ million)
- Data Table on Japan - Market size and forecast 2024-2029 ($ million)
- Chart on Japan - Year-over-year growth 2024-2029 (%)
- Data Table on Japan - Year-over-year growth 2024-2029 (%)
- 13.13 UK - Market size and forecast 2024-2029
- Chart on UK - Market size and forecast 2024-2029 ($ million)
- Data Table on UK - Market size and forecast 2024-2029 ($ million)
- Chart on UK - Year-over-year growth 2024-2029 (%)
- Data Table on UK - Year-over-year growth 2024-2029 (%)
- 13.14 Germany - Market size and forecast 2024-2029
- Chart on Germany - Market size and forecast 2024-2029 ($ million)
- Data Table on Germany - Market size and forecast 2024-2029 ($ million)
- Chart on Germany - Year-over-year growth 2024-2029 (%)
- Data Table on Germany - Year-over-year growth 2024-2029 (%)
- 13.15 South Korea - Market size and forecast 2024-2029
- Chart on South Korea - Market size and forecast 2024-2029 ($ million)
- Data Table on South Korea - Market size and forecast 2024-2029 ($ million)
- Chart on South Korea - Year-over-year growth 2024-2029 (%)
- Data Table on South Korea - Year-over-year growth 2024-2029 (%)
- 13.16 France - Market size and forecast 2024-2029
- Chart on France - Market size and forecast 2024-2029 ($ million)
- Data Table on France - Market size and forecast 2024-2029 ($ million)
- Chart on France - Year-over-year growth 2024-2029 (%)
- Data Table on France - Year-over-year growth 2024-2029 (%)
- 13.17 Australia - Market size and forecast 2024-2029
- Chart on Australia - Market size and forecast 2024-2029 ($ million)
- Data Table on Australia - Market size and forecast 2024-2029 ($ million)
- Chart on Australia - Year-over-year growth 2024-2029 (%)
- Data Table on Australia - Year-over-year growth 2024-2029 (%)
- 13.18 Market opportunity by geography
- Market opportunity by geography ($ million)
- Data Tables on Market opportunity by geography ($ million)
14 Drivers, Challenges, and Opportunity/Restraints
- 14.3 Impact of drivers and challenges
- Impact of drivers and challenges in 2024 and 2029
- 14.4 Market opportunities/restraints
15 Competitive Landscape
- 15.2 Competitive Landscape
- Overview on criticality of inputs and factors of differentiation
- 15.3 Landscape disruption
- Overview on factors of disruption
- 15.4 Industry risks
- Impact of key risks on business
16 Competitive Analysis
- 16.2 Company ranking index
- 16.3 Market positioning of companies
- Matrix on companies position and classification
- 16.4 Abbott Laboratories
- Abbott Laboratories - Overview
- Abbott Laboratories - Business segments
- Abbott Laboratories - Key news
- Abbott Laboratories - Key offerings
- Abbott Laboratories - Segment focus
- SWOT
- 16.5 Active Nutrition International GmbH
- Active Nutrition International GmbH - Overview
- Active Nutrition International GmbH - Product / Service
- Active Nutrition International GmbH - Key offerings
- SWOT
- 16.6 Ajinomoto Co. Inc.
- Ajinomoto Co. Inc. - Overview
- Ajinomoto Co. Inc. - Business segments
- Ajinomoto Co. Inc. - Key news
- Ajinomoto Co. Inc. - Key offerings
- Ajinomoto Co. Inc. - Segment focus
- SWOT
- 16.7 All Sport
- All Sport - Overview
- All Sport - Product / Service
- All Sport - Key offerings
- SWOT
- 16.8 Biosteel Sports Inc.
- Biosteel Sports Inc. - Overview
- Biosteel Sports Inc. - Product / Service
- Biosteel Sports Inc. - Key offerings
- SWOT
- 16.9 Britvic plc
- Britvic plc - Overview
- Britvic plc - Product / Service
- Britvic plc - Key news
- Britvic plc - Key offerings
- SWOT
- 16.10 Danone SA
- Danone SA - Overview
- Danone SA - Business segments
- Danone SA - Key news
- Danone SA - Key offerings
- Danone SA - Segment focus
- SWOT
- 16.11 Decathlon SA
- Decathlon SA - Overview
- Decathlon SA - Product / Service
- Decathlon SA - Key offerings
- SWOT
- 16.12 MyDrink Beverages
- MyDrink Beverages - Overview
- MyDrink Beverages - Product / Service
- MyDrink Beverages - Key offerings
- SWOT
- 16.13 Nestle SA
- Nestle SA - Overview
- Nestle SA - Business segments
- Nestle SA - Key news
- Nestle SA - Key offerings
- Nestle SA - Segment focus
- SWOT
- 16.14 Otsuka Pharmaceutical Co Ltd.
- Otsuka Pharmaceutical Co Ltd. - Overview
- Otsuka Pharmaceutical Co Ltd. - Product / Service
- Otsuka Pharmaceutical Co Ltd. - Key offerings
- SWOT
- 16.15 PepsiCo Inc.
- PepsiCo Inc. - Overview
- PepsiCo Inc. - Business segments
- PepsiCo Inc. - Key news
- PepsiCo Inc. - Key offerings
- PepsiCo Inc. - Segment focus
- SWOT
- 16.16 Suntory Beverage and Food Ltd.
- Suntory Beverage and Food Ltd. - Overview
- Suntory Beverage and Food Ltd. - Business segments
- Suntory Beverage and Food Ltd. - Key news
- Suntory Beverage and Food Ltd. - Key offerings
- Suntory Beverage and Food Ltd. - Segment focus
- SWOT
- 16.17 The Coca Cola Co.
- The Coca Cola Co. - Overview
- The Coca Cola Co. - Business segments
- The Coca Cola Co. - Key news
- The Coca Cola Co. - Key offerings
- The Coca Cola Co. - Segment focus
- SWOT
- 16.18 The Kraft Heinz Co.
- The Kraft Heinz Co. - Overview
- The Kraft Heinz Co. - Business segments
- The Kraft Heinz Co. - Key news
- The Kraft Heinz Co. - Key offerings
- The Kraft Heinz Co. - Segment focus
- SWOT
17 Appendix
- 17.2 Inclusions and exclusions checklist
- Inclusions checklist
- Exclusions checklist
- 17.3 Currency conversion rates for US$
- Currency conversion rates for US$
- 17.4 Research methodology
- 17.7 Validation techniques employed for market sizing
- Validation techniques employed for market sizing
- 17.9 360 degree market analysis
- 360 degree market analysis
- 17.10 List of abbreviations