
Predictive Maintenance As A Service (Pmaas) Market Size and Growth Forecast 2026-2030
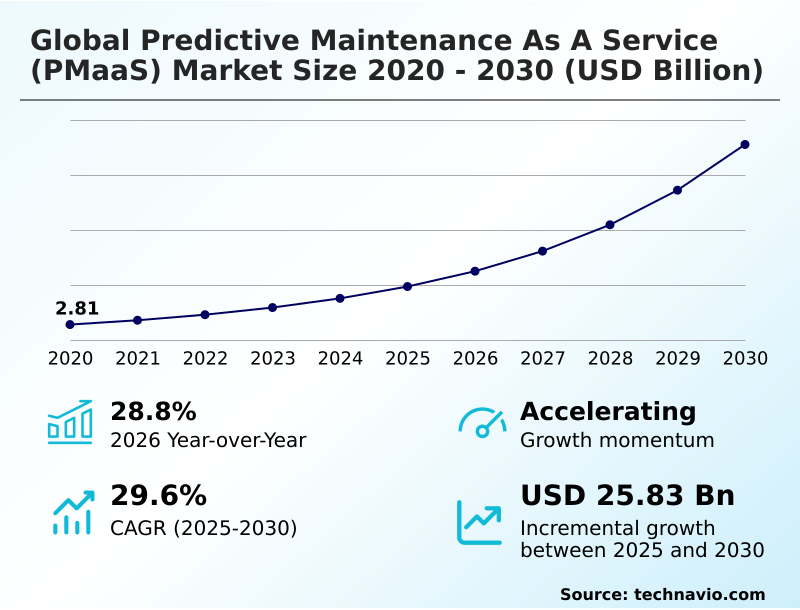
The Predictive Maintenance As A Service (Pmaas) Market size was valued at USD 9.72 billion in 2025 growing at a CAGR of 29.6% during the forecast period 2026-2030.
North America accounts for 38% of incremental growth during the forecast period. The Cloud based segment by Deployment was valued at USD 5.36 billion in 2024, while the Large Enterprises segment holds the largest revenue share by Business Segment.
The market is projected to grow by USD 32.74 billion from 2020 to 2030, with USD 25.83 billion of the growth expected during the forecast period of 2025 to 2030.
Get Key Insights on Market Forecast (PDF) Request Free Sample
Predictive Maintenance As A Service (Pmaas) Market Overview
The predictive maintenance as a service (pmaas) market is characterized by accelerating adoption, with a year-over-year growth of 28.8% driven by the convergence of industrial sensor technology and cloud computing. North America is a significant contributor to this expansion, accounting for approximately 38% of the incremental growth as its industries prioritize asset reliability engineering. The practical application of these services is evident in high-volume manufacturing environments. For instance, an automotive die-casting plant deploying real-time data collection from its machinery and using anomaly detection software can identify micro-fractures in tooling before they lead to a catastrophic failure. This preemptive action, guided by asset health monitoring, is critical for reducing unplanned downtime and optimizing total cost of ownership (TCO). This shift from reactive repairs to data-driven foresight allows for improved operational equipment effectiveness (OEE) and aligns maintenance activities directly with production continuity, a core principle of Industry 4.0 maintenance.
Drivers, Trends, and Challenges in the Predictive Maintenance As A Service (Pmaas) Market
A strategic shift towards AI-powered asset health monitoring for failure prediction is enabling industrial firms to redefine their operational frameworks in alignment with standards like ISO 55000. For a renewable energy operator, this means moving beyond simple alerts to using cloud-based analytics for prescriptive maintenance on wind turbine gearboxes, a process which can increase asset availability by several percentage points.
This involves integrating IoT sensors with legacy manufacturing systems and optimizing maintenance schedules with machine learning. The use of digital twin simulation for equipment failure scenarios allows engineers to test interventions without physical risk. This proactive approach is critical for improving asset reliability with predictive analytics and reducing unplanned downtime in manufacturing facilities.
The deployment of edge computing for low-latency industrial diagnostics is essential for real-time applications. However, organizations must address how to be ensuring data security in cloud maintenance platforms. Core technical functions include monitoring rotating equipment with vibration analysis and establishing predictive maintenance for renewable energy assets.
The approach extends to condition monitoring of high-voltage electrical grids, optimizing transportation fleet maintenance with AI, and applying predictive diagnostics for oil and gas infrastructure.
Ultimately, the goal is enhancing workplace safety through predictive alerts, aligning maintenance strategy with ESG goals, and managing asset lifecycle with predictive insights, while overcoming interoperability challenges in industrial IoT and training AI models with synthetic failure data.
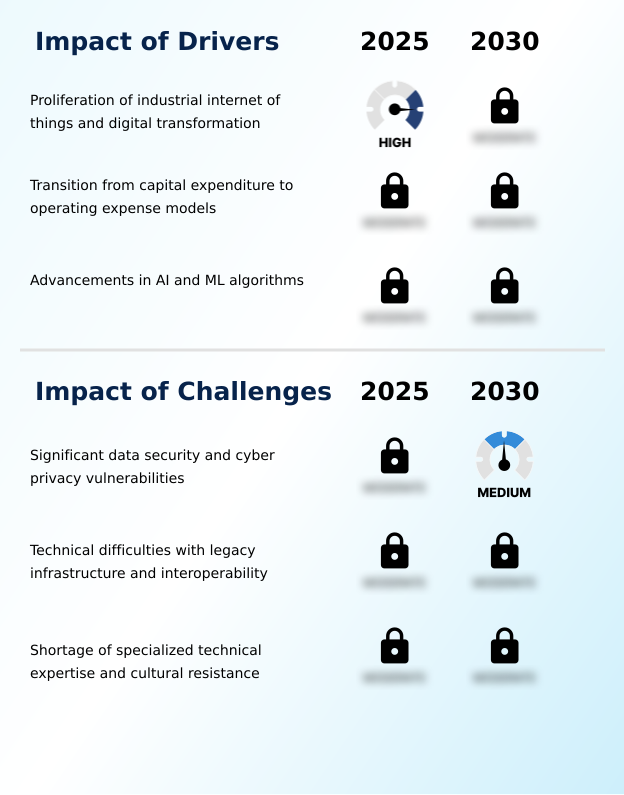
Primary Growth Driver: The proliferation of the Industrial Internet of Things and the broader digital transformation across industries are key drivers for the market.
The market's accelerating momentum, reflected in a year-over-year growth of 28.8%, is fueled by a convergence of financial and technological drivers.
The strategic shift from capital expenditure (capex) vs opex models has significantly lowered the barrier to entry, allowing small and medium-sized enterprises to adopt sophisticated analytical tools.
This financial flexibility is coupled with the widespread proliferation of the industrial internet of things (iiot), which provides the massive data streams necessary for advanced machine learning (ml) algorithms to function effectively.
As part of a broader digital transformation in industry, these technologies enable a higher degree of operational efficiency.
This not only reduces costs but also supports corporate sustainability goals aligned with circular economy principles by extending the useful life of machinery and minimizing waste.
Emerging Market Trend: The integration of generative AI and natural language processing is an emerging trend, enhancing the accessibility and interpretation of complex technical diagnostics in industrial settings.
Key trends are centered on making advanced analytics more accessible and effective. The integration of generative AI for synthetic data is a significant development, allowing for more robust training of machine learning models, particularly for rare failure events. Concurrently, natural language processing (NLP) is being embedded into user interfaces, enabling maintenance technicians to query complex systems using conversational language.
This democratization of data is paired with architectural shifts, where the combination of private 5G networks and edge computing analytics facilitates real-time, high-fidelity data processing directly at the asset.
This is especially impactful in the APAC region, which is projected to grow at 30.4%, where new smart factories are being built with this infrastructure from the ground up, often incorporating computer vision in maintenance for quality control.
Key Industry Challenge: Significant data security and cyber privacy vulnerabilities pose a key challenge, affecting the growth and adoption of predictive maintenance services.
Significant structural challenges persist, primarily centered on security, integration, and talent. Concerns over operational technology (ot) security and adherence to data sovereignty regulations remain a substantial barrier, compelling some enterprises to favor on-premise deployments despite the advantages of cloud platforms.
On a technical level, the process of legacy system retrofitting to enable data extraction is often costly and complex, compounded by a lack of industrial data interoperability between equipment from different vendors. This creates fragmented data ecosystems that inhibit holistic analysis.
Furthermore, a pronounced skills gap in data science and maintenance engineering means that even when data is successfully collected, a shortage of qualified personnel can prevent the translation of analytical insights into actionable maintenance strategies.
Explore Full Market Dynamics Analysis Request Free Sample
Predictive Maintenance As A Service (Pmaas) Market Segmentation
The predictive maintenance as a service (pmaas) industry research report provides comprehensive data including region-wise segment analysis, with forecasts and analysis for the period 2026-2030, as well as historical data from 2020-2024 for the following segments.
Deployment Segment Analysis
The cloud based segment is estimated to witness significant growth during the forecast period.
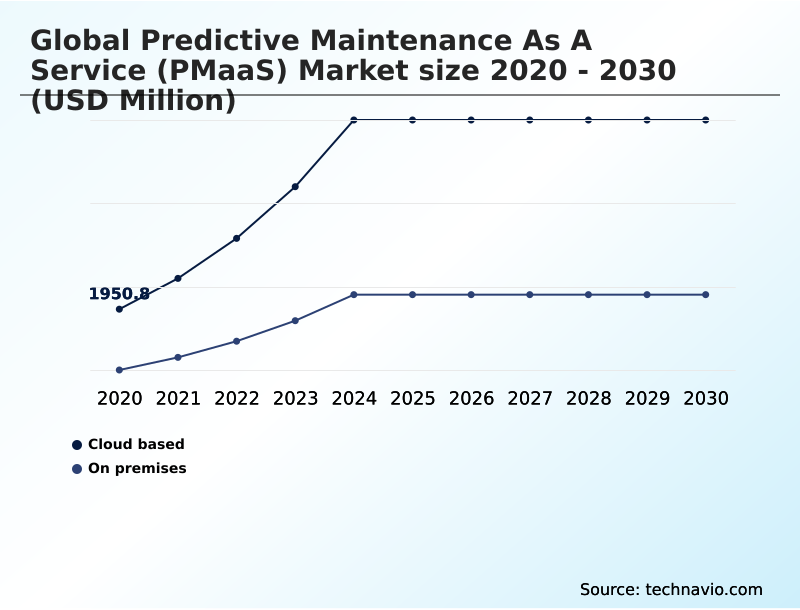
The cloud-based deployment model is the principal segment, offering significant advantages in scalability and reducing upfront capital expenditure on infrastructure.
This approach is central to modern industrial strategy, enabling organizations to utilize centralized servers for the storage and analysis of vast data volumes from industrial sensor technology.
Cloud-based diagnostic platforms facilitate real-time data collection and are essential for executing complex machine learning algorithms that underpin effective asset health monitoring. For enterprises with geographically dispersed assets, these systems provide a unified view of equipment status.
The high computational power is critical for advanced applications like digital twin simulation, allowing maintenance managers to model scenarios and integrate insights with enterprise asset management (EAM) systems for strategic decision-making.
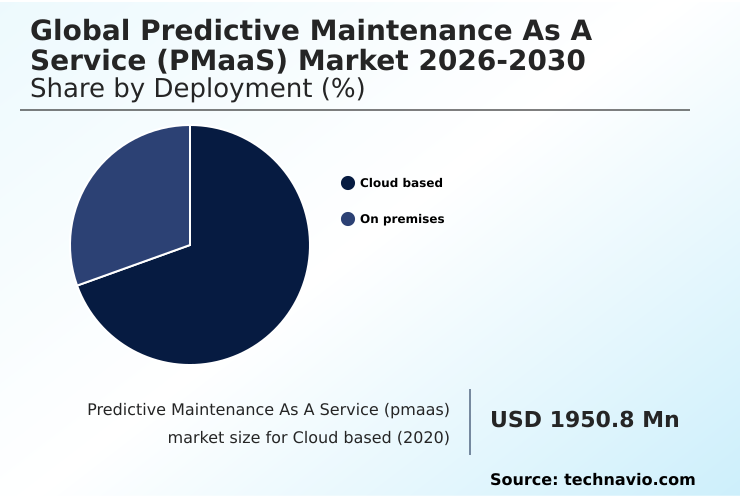
The Cloud based segment was valued at USD 5.36 billion in 2024 and showed a gradual increase during the forecast period.
Predictive Maintenance As A Service (Pmaas) Market by Region: North America Leads with 38% Growth Share
North America is estimated to contribute 38% to the growth of the global market during the forecast period.
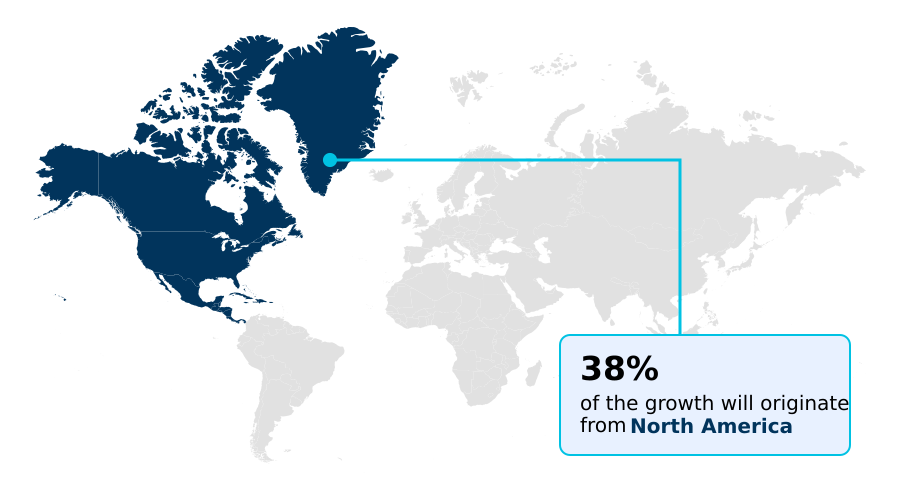
The global landscape is led by North America, which accounts for over 38% of the market's growth opportunity, driven by mature industrial sectors adopting OT/IT convergence.
In this region, advanced applications such as ensuring electrical grid resilience and managing autonomous haulage systems are prevalent. Europe, contributing nearly 28%, focuses on smart factory implementation, with Germany and the UK being key markets.
Meanwhile, the APAC region, representing about 23% of the opportunity, shows the fastest adoption rate, fueled by new manufacturing infrastructure in China and India.
The application of these services is highly specialized by region; for instance, subsea equipment monitoring is critical in the oil and gas sector of the Middle East, while South America focuses on mining and agricultural machinery.
Customer Landscape Analysis for the Predictive Maintenance As A Service (Pmaas) Market
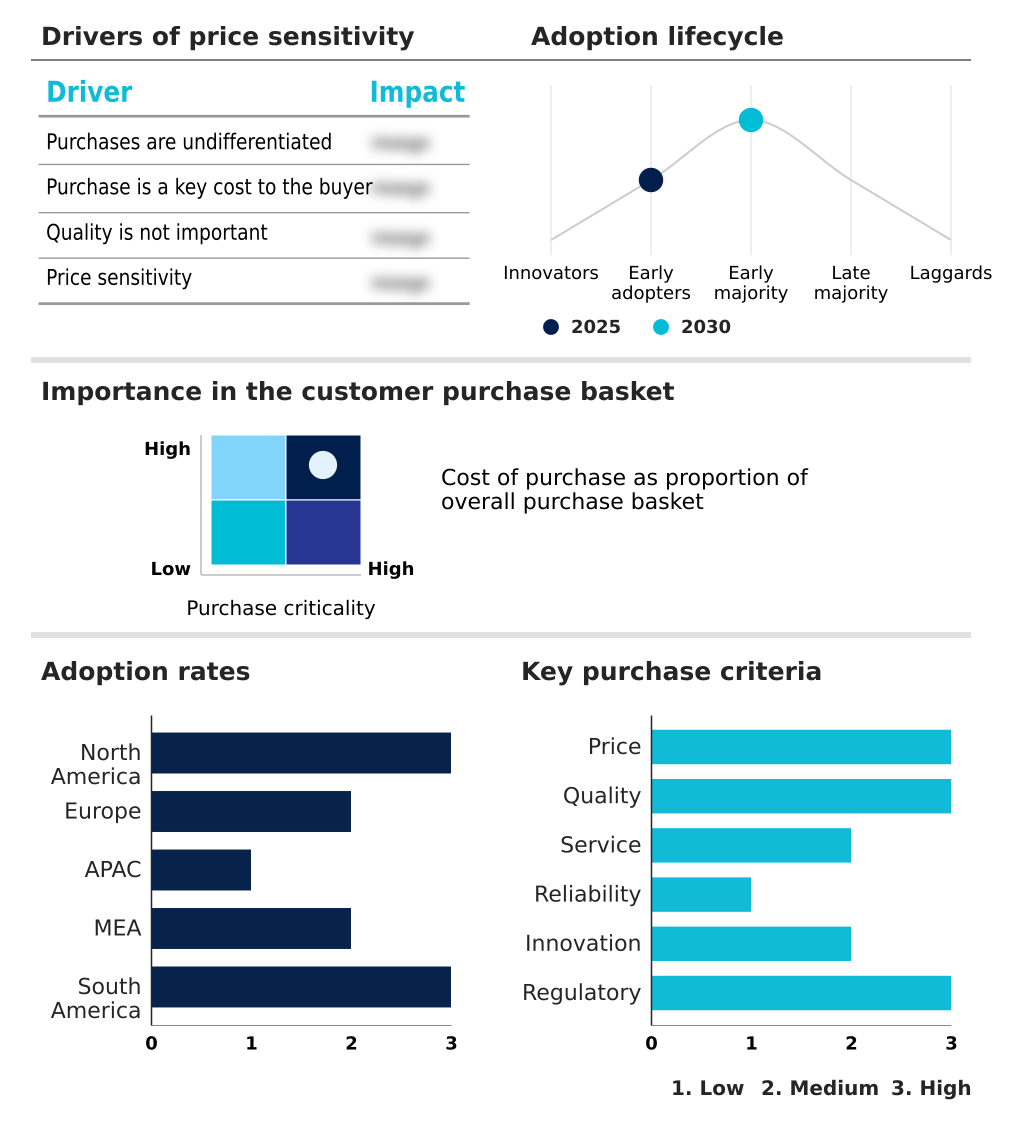
The predictive maintenance as a service (pmaas) market forecasting report includes the adoption lifecycle of the market, covering from the innovator’s stage to the laggard’s stage. It focuses on adoption rates in different regions based on penetration. Furthermore, the predictive maintenance as a service (pmaas) market report also includes key purchase criteria and drivers of price sensitivity to help companies evaluate and develop their market growth analysis strategies.
Competitive Landscape of the Predictive Maintenance As A Service (Pmaas) Market
Companies are implementing various strategies, such as strategic alliances, partnerships, mergers and acquisitions, geographical expansion, and product/service launches, to enhance their presence in the predictive maintenance as a service (pmaas) market industry.
ABB Ltd. - Delivers AI-powered predictive maintenance as a service, leveraging IoT analytics for asset failure prediction, health monitoring, and operational optimization on cloud-based platforms.
The industry research and growth report includes detailed analyses of the competitive landscape of the market and information about key companies, including:
- ABB Ltd.
- Augury Inc.
- C3.ai Inc.
- General Electric Co.
- Google LLC
- Hitachi Ltd.
- Honeywell International Inc.
- IBM Corp.
- IFS World Operations AB
- Infor Inc.
- Microsoft Corp.
- Oracle Corp.
- PTC Inc.
- SAP SE
- Schneider Electric SE
- Senseye Ltd
- Siemens AG
- SparkCognition Inc.
- TIBCO Software Inc.
- Uptake Technologies Inc.
Qualitative and quantitative analysis of companies has been conducted to help clients understand the wider business environment as well as the strengths and weaknesses of key industry players. Data is qualitatively analyzed to categorize companies as pure play, category-focused, industry-focused, and diversified; it is quantitatively analyzed to categorize companies as dominant, leading, strong, tentative, and weak.
Recent Developments in the Predictive Maintenance As A Service (Pmaas) Market
- In March, 2025, Schneider Electric launched an enhanced version of its digital advisor suite, incorporating a specialized generative engine to produce step-by-step repair instructions from live vibration data for industrial equipment.
- In April, 2025, the European Union Agency for Cybersecurity released a specialized reporting framework that mandates more rigorous encryption standards for industrial telemetry data used in cloud-based maintenance applications to enhance security.
- In May, 2025, Saudi Aramco integrated a comprehensive digital twin and predictive maintenance platform into its new hydrogen refining facility to monitor the performance of high-pressure storage tanks and pumping systems.
- In May, 2025, Suncor Energy deployed a new fleet-wide predictive maintenance program for its autonomous haul trucks at its bitumen mining sites, using real-time data to analyze engine vibration and hydraulic pressure for proactive repairs.
Research Analyst Overview: Predictive Maintenance As A Service (Pmaas) Market
Decisions regarding the adoption of predictive maintenance as a service (pmaas) have elevated from the plant floor to the boardroom, driven by total cost of ownership (TCO) implications and operational technology (OT) security concerns. Executive-level stakeholders are weighing the benefits of zero unplanned downtime against the complexities of industrial data interoperability and data sovereignty regulations.
This is particularly true in North America, which accounts for nearly 38% of the market's incremental growth. A key consideration is compliance with frameworks like the European Union Agency for Cybersecurity (ENISA) reporting standards for industrial telemetry, which dictates stringent encryption protocols.
The strategic implementation of asset performance management (apm) is no longer just a technical upgrade but a core component of risk management. For example, a firm's ability to securely perform subsea equipment monitoring or maintain electrical grid resilience through a third-party platform is now a matter of corporate governance, influencing investment in AI in maintenance and deep learning neural networks.
Dive into Technavio’s robust research methodology, blending expert interviews, extensive data synthesis, and validated models for unparalleled Predictive Maintenance As A Service (Pmaas) Market insights. See full methodology.
| Market Scope | |
|---|---|
| Page number | 302 |
| Base year | 2025 |
| Historic period | 2020-2024 |
| Forecast period | 2026-2030 |
| Growth momentum & CAGR | Accelerate at a CAGR of 29.6% |
| Market growth 2026-2030 | USD 25832.0 million |
| Market structure | Fragmented |
| YoY growth 2025-2026(%) | 28.8% |
| Key countries | US, Canada, Mexico, Germany, UK, France, Italy, The Netherlands, Spain, China, Japan, India, South Korea, Australia, Indonesia, Saudi Arabia, UAE, South Africa, Israel, Turkey, Brazil, Argentina and Colombia |
| Competitive landscape | Leading Companies, Market Positioning of Companies, Competitive Strategies, and Industry Risks |
Predictive Maintenance As A Service (Pmaas) Market: Key Questions Answered in This Report
-
What is the expected growth of the Predictive Maintenance As A Service (Pmaas) Market between 2026 and 2030?
-
The Predictive Maintenance As A Service (Pmaas) Market is expected to grow by USD 25.83 billion during 2026-2030, registering a CAGR of 29.6%. Year-over-year growth in 2026 is estimated at 28.8%%. This acceleration is shaped by proliferation of industrial internet of things and digital transformation, which is intensifying demand across multiple end-use verticals covered in the report.
-
-
What segmentation does the market report cover?
-
The report is segmented by Deployment (Cloud based, and On premises), Business Segment (Large Enterprises, and Small and medium enterprises), Application (Manufacturing, Energy and utilities, Transportation and logistics, Oil and gas, and Others) and Geography (North America, Europe, APAC, Middle East and Africa, South America). Among these, the Cloud based segment is estimated to witness significant growth during the forecast period, driven by rising adoption across key application areas. Each segment includes detailed qualitative and quantitative analysis, along with historical data from 2020-2024 and forecasts through 2030 with year-over-year growth rates.
-
-
Which regions are analyzed in the report?
-
The report covers North America, Europe, APAC, Middle East and Africa and South America. North America is estimated to contribute 38% to market growth during the forecast period. Country-level analysis includes US, Canada, Mexico, Germany, UK, France, Italy, The Netherlands, Spain, China, Japan, India, South Korea, Australia, Indonesia, Saudi Arabia, UAE, South Africa, Israel, Turkey, Brazil, Argentina and Colombia, with dedicated market size tables and year-over-year growth for each.
-
-
What are the key growth drivers and market challenges?
-
The primary driver is proliferation of industrial internet of things and digital transformation, which is accelerating investment and industry demand. The main challenge is significant data security and cyber privacy vulnerabilities, creating operational barriers for key market participants. The report quantifies the impact of each driver and challenge across 2026 and 2030 with comparative analysis.
-
-
Who are the major players in the Predictive Maintenance As A Service (Pmaas) Market?
-
Key vendors include ABB Ltd., Augury Inc., C3.ai Inc., General Electric Co., Google LLC, Hitachi Ltd., Honeywell International Inc., IBM Corp., IFS World Operations AB, Infor Inc., Microsoft Corp., Oracle Corp., PTC Inc., SAP SE, Schneider Electric SE, Senseye Ltd, Siemens AG, SparkCognition Inc., TIBCO Software Inc. and Uptake Technologies Inc.. The report provides qualitative and quantitative analysis categorizing companies as dominant, leading, strong, tentative, and weak based on their market positioning. Company profiles include business segment analysis, SWOT assessment, key offerings, and recent strategic developments.
-
Predictive Maintenance As A Service (Pmaas) Market Research Insights
The market's momentum is largely influenced by the strategic financial shift from capital expenditure (capex) vs opex models, which makes advanced technology accessible without large upfront investments. This dynamic fuels the adoption of cloud-based platforms, where asset reliability engineering is managed as a service.
As organizations adopt condition-based maintenance (cbm) to get a clear estimation of remaining useful life (rul), they must navigate complex data sovereignty regulations, particularly when operating across multiple jurisdictions. Adherence to frameworks governing cross-border data flow is now a critical factor in vendor selection for global enterprises.
This regulatory scrutiny shapes deployment choices between public cloud and on-premise solutions for firms handling sensitive operational data.
We can help! Our analysts can customize this predictive maintenance as a service (pmaas) market research report to meet your requirements.
 RIA -
RIA - 
